JTH's Account Talk

Friday

I've been out of town this week, so my participation in the markets has been limited.

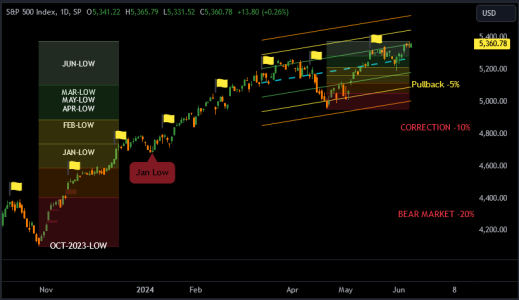
Anyhow, today is our last session of May. As it stands, on the weekly chart (not shown) we'll likely close with both a lower weekly high & low, thus last week's outside daily reversal was confirmed. But on positive note, for the 52-Week and 63-Day linear regression channels, we are close to the fair value middle line (line of best fit), so prices are on track (neither oversold nor overbought).

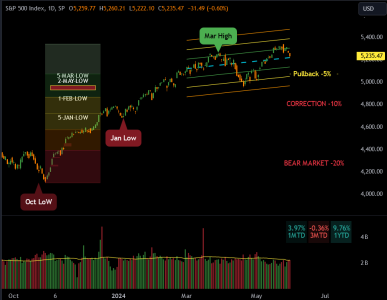
While June is my least favorite month, there isn't much here to get me alarmed. Even a healthy -5% pullback is still above the Mar/Apr/May monthly lows, those are the key levels I'm most concerned with.

Of Note, on Thursday SPX lost -.60%, the Top-50 ETF XLG lost -1.26%, while R2K closed up 1%. Is this the small cap rotation we've been waiting for?
202405031-1.png
 
Last edited:
Sunday

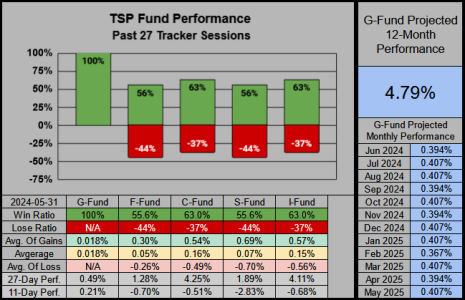
Across the past 27-Sessions the C & I Funds are nearly neck-in-neck with a slight edge towards the C-Fund.

20240602-1.png

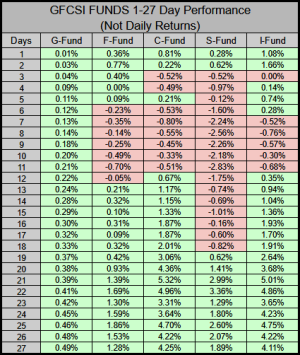
Comparing the CSI Funds, our I-Fund is winning across the past 7-Sessions.

20240602-2.png

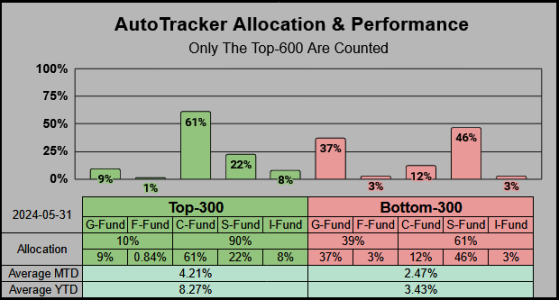
In Total, the Top-600 is 73% invested in the C-Fund Vs. 9% in the I-Fund

20240602-3.png

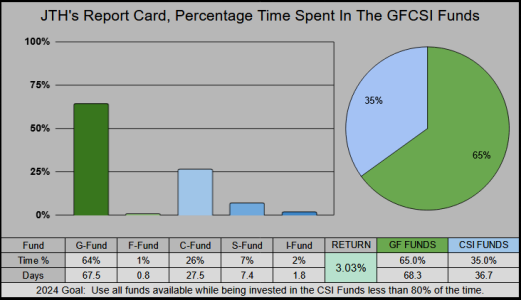
For myself, this will be the first time this year starting out the month fully invested in the C-Fund. Our C-Fund has an 8.26% lead over me. The only way to reduce this lead will be an in-an-out IFT (which hasn't worked for me this year) but I do love a good challenge.

20240602-4.png
 
Monday

BLOG: Stats for June

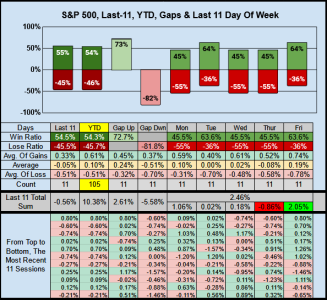
On the 11-session scale, gap downs at the open (vs. the close) have been very reliable, with an 81.8% loss ratio & total loss of -5.58%.

Mon/Wed/Thur have a 3-way tie with a 45.5% win ratio, Thursday gave us the largest 11-session loss with -.86%, with the last 3 closing down.

Tue/Fri have a 63.6% win ratio, with Friday giving us the largest 11-session gain with 2.05%. The last 4 Tuesdays & 6 Fridays have closed up.

20240603-1.png
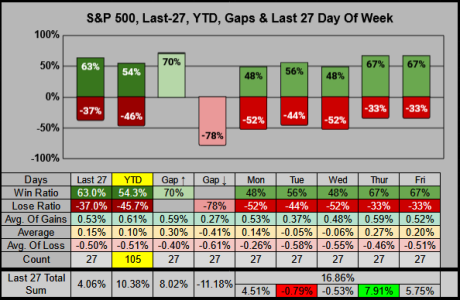
On the longer 27-session scale Thur/Fri are good, Tue/Wed are bad.

20240603-2.png


Re: Friday

Post #2

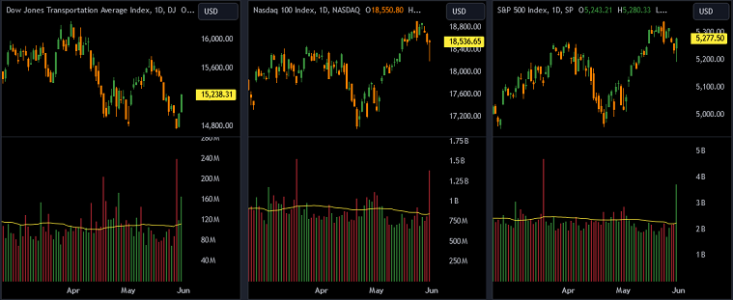
There are a handful of times (usually once a year) where we get a surge of volume with a confirming candlestick, (across several major indexes).

Last Wednesday the Transportation Index put in the heaviest volume since March 2022 and since then has 2 higher closes. Friday’s higher close overshadowed 7 days worth of price action.

On Friday the NASDAQ 100 put in the heaviest volume since March 2024’s Options Expiration. The long tail down comprised 90% of the candlestick.

On Friday the S&P 500 put in the heaviest volume since March 2024’s Options Expiration. The long tail down comprised 58% of the candlestick.

In totality this is usually an excellent setup for buyers.

20240603-0.png
 
The chart below shows us that while only 46% of the index's holdings closed positive, it was the heavier weighted Top-50 which kept us in the green on Tuesday.

If you haven't read my analysis on Gap and IFT data, here's the latest 100 sessions.

BLOG: Not the norm

20240604-0.png
 
Thursday

Here’s Lou, my new trading partner, an 8 year old Terrier mutt who has survived through two shelters and is now relaxing at his third (and final) home.


file.jpg
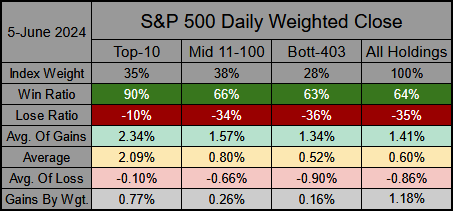
On Wednesday The S&P 500’s Top-10 earned .77% of the index's 1.18% gain. While the bulk of gains did come from the Top-10, participation was broad with 64% of the index's 503 holdings closing the day with a gain.

20240605-1.png


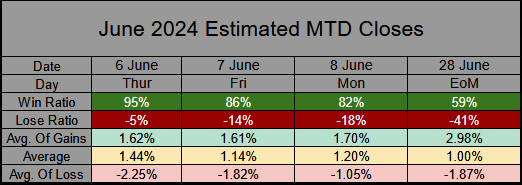
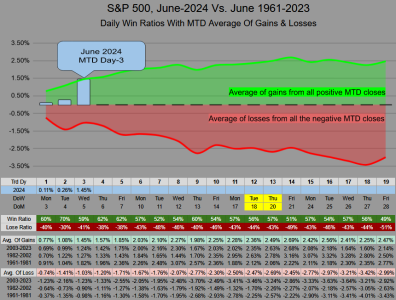
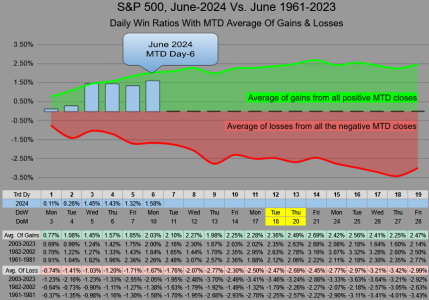
June 2024 MTD Day-3 closed 1.45% which places us in the upper 33%. Here are some statistical MTD projections for the next 3 sessions and the end of month.

20240605-2.png
This June, MTD data goes back the full 63 years to 1961. In the table at the bottom of the chart the data is broken down into three 21-year increments.

20240605-3.png


Re: Thursday

One of the best posts ever, and I only read the first line..

Here’s Lou, my new trading partner, an 8 year old Terrier mutt who has survived through two shelters and is now relaxing at his third (and final) home.


View attachment 61016
On Wednesday The S&P 500’s Top-10 earned .77% of the index's 1.18% gain. While the bulk of gains did come from the Top-10, participation was broad with 64% of the index's 503 holdings closing the day with a gain.

View attachment 61017


June 2024 MTD Day-3 closed 1.45% which places us in the upper 33%. Here are some statistical MTD projections for the next 3 sessions and the end of month.

View attachment 61018
This June, MTD data goes back the full 63 years to 1961. In the table at the bottom of the chart the data is broken down into three 21-year increments.

View attachment 61019


Re: Monday's Close

Good morning

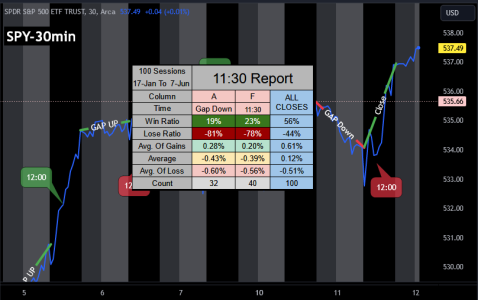
My least favorite stats to analyze are the 30-minute candlesticks. Sometimes the markets close early, which means the data has to be adjusted or (as with 30-May-2024's SPX glitch) there is a missing 30-minute candlestick at 11:00 :cool:

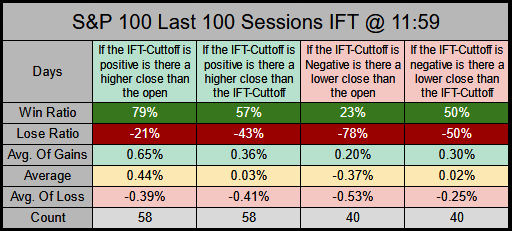
The question: When you IFT, will you get a better closing price than the open, and will you get a better closing price than the IFT-Cuttoff time.

For sellers:
If the IFT-Cuttoff is positive, the session had a 79% win ratio.
If the IFT-Cuttoff is positive, the session closed higher than the IFT-Cuttoff 57% of the time.

For buyers:
If the IFT-Cuttoff is negative, the session had a 78% lose ratio.
If the IFT-Cuttoff is negative, the session closed lower than the IFT-Cuttoff 50% of the time.

20240607-1.png
 
Sunday

Good morning

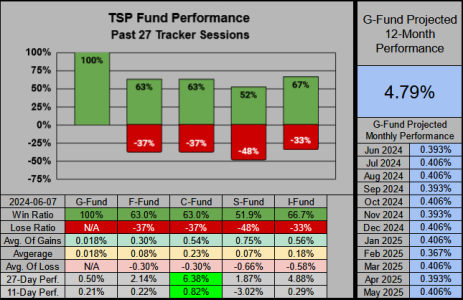
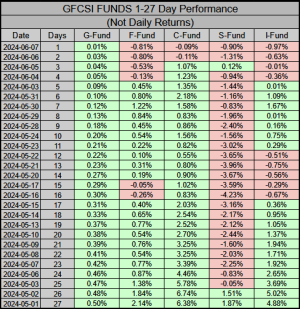
With a 1-session lead over the C-Fund , the I-Fund currently has the best win ratio at 66.7%
Across the past 27 & 11 sessions the C-Fund has the most cumulative gains at 6.38% & .82%

20240609-1.png


For a stark contrast:If you entered the C-Fund on May 16th you’d be up .83% across the past 16 sessions.
If you entered the S-Fund on May 16th you’d be down -4.23% across the past 16 sessions.

20240609-2.png


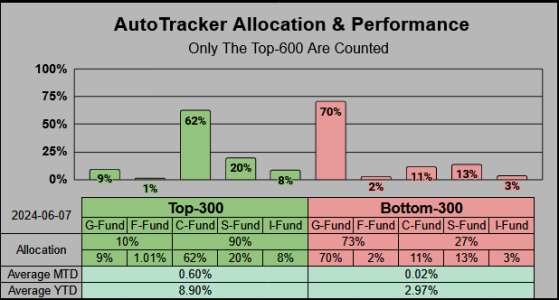
This might be the largest allocation shift I’ve noticed in the Top-600. The S-Fund allocation was reduced by 32.9% and appears to have entered the G-Fund.

20240609-3.png
 
Monday

I’ll be frank, starting out the week, I’m not optimistic, but at the same time my short-term positions are off the table, so I have no personal concerns. The recent low volume reflects a lack of buy/sell conviction at these levels. Perhaps folks (like me) aren’t interested in front-running Wednesday's CPI, Core CPI, and FOMC rate decision.


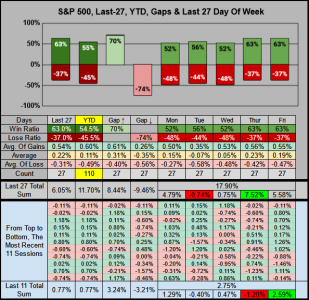
At 7.52% & -1.20% Thursday has given the most gains across 27 sessions and the most losses across 11 sessions. Our last 5 Tuesday closed up, last 4 Thursday closed down.

20240610-2.png


Here's the last 27 sessions dissected by how they gaped & closed within the first 30 minutes & the IFT-Cuttoff @ 11:59.


Column I has the best stats, 5 sessions gaped down, the first 30 minutes closed down, and the IFT-Cuttoff was down.
This 3-down Trifecta had an 80% lose ratio.

20240610-3.png


Tuesday

Good morning (Yellow Flag = CPI Report)

The CPI report comes out this Wednesday. It’s not typical for me to track economic conditions, but here I am taking a gander at the release dates of our last 7 CPI reports.

Prior to the report, prices ramped up 5 of 7 times.
Oct report stalled then declined -6.43% across 12 sessions.
Nov report gaped up, closing 1.91%.
Dec report closed .46%, the day after closed 1.37%
Jan -.07%, Feb -1.37%, & Mar 1.12% all were the start of 5-6 session minor pullbacks.
Our last report in Apr closed down -.95% and was part of the larger 16-session -5.91% pullback.

Last month I side-stepped the report (which gained 1.17%) it cost me 1.15% before getting back in.

Yellow Flag = Previous CPI Reports

20240611-2.png
 
Wednesday

Typically when the S&P 500 gaps down at the open, and the IFT-Cuttoff is below the previous day's close, the index will close down roughly 80% of the time.

On Tuesday we went against what's "typical" and closed the session positive.

20240612-3.png

Column B: Weighted at 35% of the index, 80% of the Top-10 closed positive, and contributed the bulk of Tuesday's gains to the index.

20240612-2.png
 
Re: The Four Quarters

Nice day for a rally with broad participation across the index.

Column D: Even 69% of the Bottom-turd-403 holdings are currently winning today's session.

20240612-4.png
 
Thursday

By weight, the Top-3 gave us 74% of Wednesday's index gains.

20240613-0.png


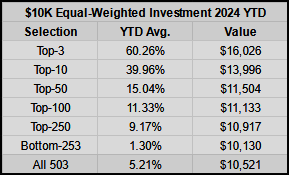
We are past the point where the snake is eating its tail. By weight the Top-3 comprise 20.36% of the index. For 2024, starting with 10K, if you bought and equally-weighted just the Top-3, (Microsoft, Apple & Nvidia), you’d be up 60.26% YTD and your 10K would be valued at 16K

20240613-1.png


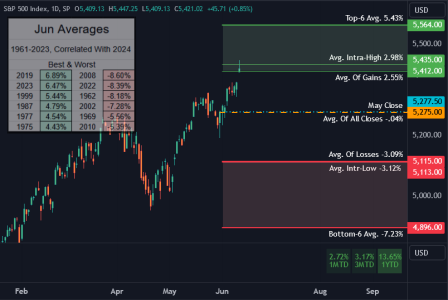
From 1961-2023 the month of June closed positive 34 of 63 times for an average gain of 2.55%

We are now above this level (SPX 5412) and currently 2.72% MTD at SPX 5421

20240613-2.png

 
From 1961-2023 the month of June closed positive 34 of 63 times for an average gain of 2.55%

Going back to those early days, I wonder if the S&P 500 has always been extremely top heavy like it is now, or if it's a new phenomenon.

I know fighting monopolies was big at some period, so maybe?
 
Going back to those early days, I wonder if the S&P 500 has always been extremely top heavy like it is now, or if it's a new phenomenon.

I know fighting monopolies was big at some period, so maybe?

It's a good question, (just guessing) but back then I don't even know if the weightings were public knowledge. Honestly, for myself, I think the stats are evolving to the point were the most recent 21 years are significantly more relevant than the previous 42.

Really from 2009 on, it's a full-on computer simulation of "War Games" style Chess.

There's good read, but I need some time to sift through it (but it looks well thought out).

History of Companies and Industries Listed on the S&P 500
 
Back
Top