JTH's Account Talk

Wednesday

Good morning

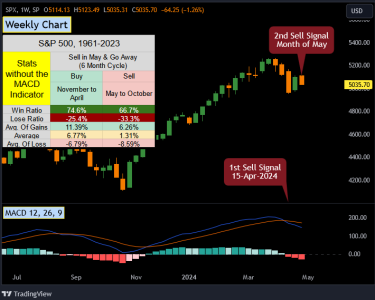
Long-term investors who perhaps only want to do 2 trades a year, may want to consider a Sell In May & Go Away strategy. At face value, (without indicators) the best 6 months are in fact better than the worst 6 months, with over 80% of the yearly average gains occurring from November to April. Outlined in the Stock Trader's Almanac with a good illustration in Stockcharts.com you might improve upon this strategy by adding an additional trigger (in this example a weekly MACD). I have not backtested the results myself, but I can tell you it appears this strategy (as I interpreted it) has recently triggered a sell signal.

Additional stats for the month of May can be found in my latest blog Stats for May, thanks for reading…Jason

20240501-2.png
 
Where The Money Is Made & Lost

Good morning (Mini-Blog Series)

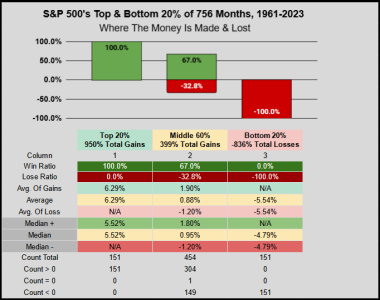
Our Top & Bottom 20% cover a range of 151 months each, while the middle 60% covers the remaining 454 months. If you’ve ever wondered why so few traders can consistently outperform the benchmark S&P 500 index, the chart below illustrates an edge towards the winners.

To truncate, if you avoid the worst month, you might sidestep a -5.54% loss, but if you misstep the best month, you will have lost out on a 6.29% gain. In the meantime the middle months (where most of our time is spent) have a strong upside bias.

-The Top 20% has an average monthly gain of 6.29% and cumulative gain of 950%
-The Bottom 20% has an average loss of -5.54% and cumulative loss of -836%
-This difference gives the Top 20% a monthly edge of .75% and cumulative total edge of 114%.
- The Middle 60% has an impressive 67% win ratio, average gain of .88%, and cumulative gain of 399%.

So at face value, even if we could avoid a Bottom 20% month, the risk of also avoiding a Middle 60% month or a Top 20% month puts us at a statistical disadvantage.

20240503-1.png


Bonus: April 2024’s -4.16% loss ranks as the 91st worst month, so it does fall within the bottom 20%, but I did not include 2024 data in the study above.
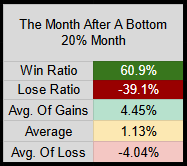
After a Bottom 20% month, the following month had a 60.9% win ratio with an average gain of 1.13%. This is higher than the 63-Year average monthly gain of .68%

20240503-2.png

Cheers...Jason
 
Last edited:
THANKS,
For your help with this. I’m a computer programmer for SSA, who continually keeps taking classes at community colleges to keep up on the latest.stuff.
D
 
THANKS,
For your help with this. I’m a computer programmer for SSA, who continually keeps taking classes at community colleges to keep up on the latest.stuff.
D

You're welcome, I had originally intended to be a programmer, but I didn't have the skill-set, motivation, or talent :)

My step dad was a programmer starting in the 70s, he bought me my first PC the Commodore 64, I programed around with Basic (bought the game programing mags), but then puberty hit (started chasing girls) and I didn't get back into computers until 97. I did end up working & retiring out of Cyber Security, but it wasn't my bag, I was a much better manager than technician.

My biggest problem with working in this field was knowing a great deal of everything I learned today, would become obsolete tomorrow. While I've forgotten more than most of the younger guys might learn, if I stepped back in today, I'd be a dinosaur. The whole "Continuous Education" and constantly chasing the next certification didn't make me happy, so here I am plugging away at excel sheets (simple but relaxing).

Thanks for keeping that SSA Sh!t together, I don't even want to imagine how many holes have to be plugged to keep us all from sinking...
 
Sunday

Good morning

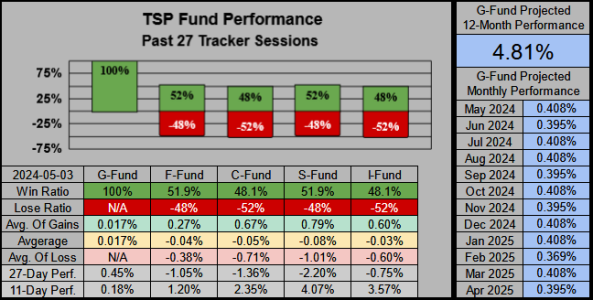
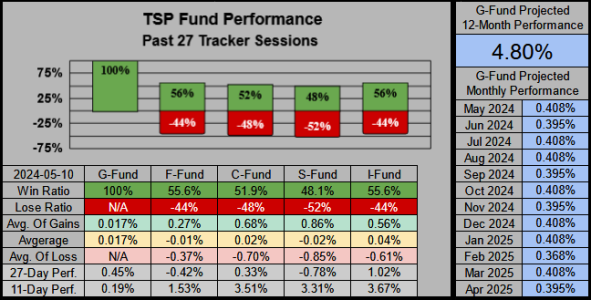
Our 27-day win ratios are below average, but the 11-day timeframe has picked up some momentum. The G-Fund payout is higher, but this 4.81% estimate does move around from week to week.

20240505-1.png
On the 1-27 day performance scale, we are in the green up to day 15 with the I-Fund leading at 2.09%.

20240505-2.png

This week there are only minor fluctuations on the AutoTracker’s Top-600.

20240505-3.png

For myself, I’m still allocated at 90% in the C-Fund. Over the past 13 sessions I’ve gone from -1.18% YTD to 1.73% YTD, so at least I’m back in the green and have slides back into the Top-600.

Have a great Sunday…Jason
 
Monday

Good morning

We are 11 sessions off the 19-April -5.91% pullback. Of the past 11 sessions, all have closed in the direction of their opening gap.

20240506-1.png


Of the last 27 times the the index gaped down at the open, 23 sessions closed down giving us an 85% success rate.

20240506-2.png

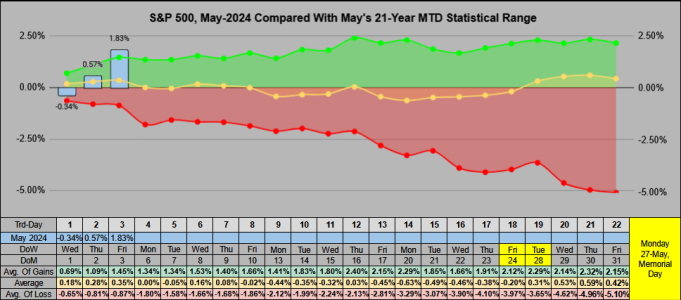
Three days into May, at 1.83% MTD, we’re off to a good start, it’s the 3rd best May of 21 years & 8th best of 63 years.

20240506-3.png


Monday's Close

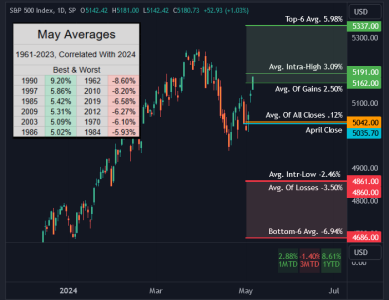
From 1961 to 2023 the Month of May has closed up 38 of 63 times giving us an average gain of 2.50% In May-2024 terms, 2.50% is SPX 5162. Today, we've closed above this level at 5180.73

20240506-1.2.png
Also, we are now 4 days into May, at 2.83% MTD, currently on track for the 2nd best May over the previous 21 years.
 
Max/Min

An alternative View

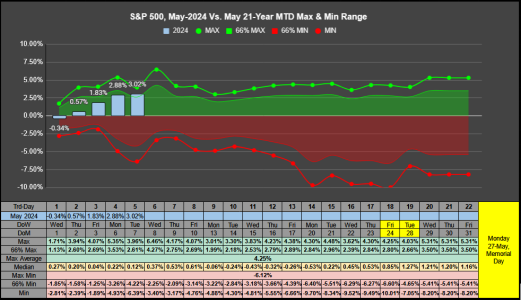
This is the month of May, with a 21-Year view of our Maximum & Minimum MTD Values (Green & Red Lines) with 66% Max/Min Values (Green & Red Areas). Our highest historical Max MTD is 6.46% which is Trading Day-6 (today), with 66% of Max at 4.27%, and a total Max MTD average at 4.25%

As an example, yesterday's Trading Day-5 closed at 3.02% which is above the 66% Max threshold, but below the MTD Max & Total Max Average.

20240508-1.png


Re: Sunday

Thanks JTH, now my head hurts. :laugh:

Yea, I agree, there's just no way I could Tik Tok this. I'm always looking for ways to simplify data but it's difficult to convey in an abbreviated format. When I'm the passenger in the car, I never know where the hell I'm at or remember how I got there :rolleyes:
 
It does seem as though the green morning / red afternoon and Vis versa has happened more often in the last 6 months or so than in the past. Nature of the beast.
I suppose that what makes a steady buy and hold strategy so appealing to some.
 
Sunday

Good Afternoon

The I-Fund has been doing a good job of keeping up with the C-Fund.

202405012-1.png
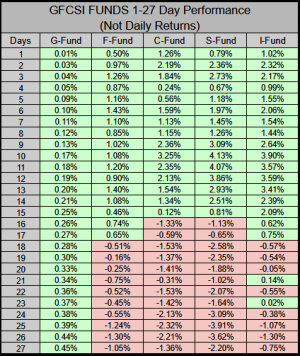
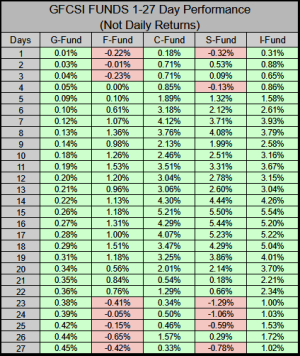
On the 1-27 day performance scale, we have green skies from day 5 to 22.

202405012-2.png


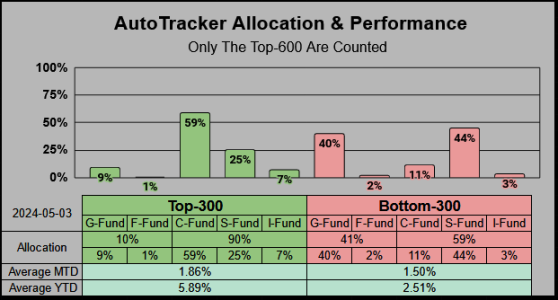
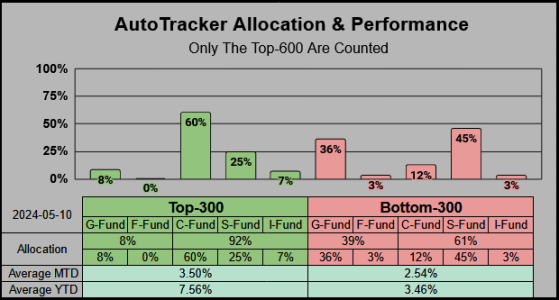
Per the recent norm, this week there’s only minor fluctuations on the AutoTracker’s Top-600.

202405012-3.png
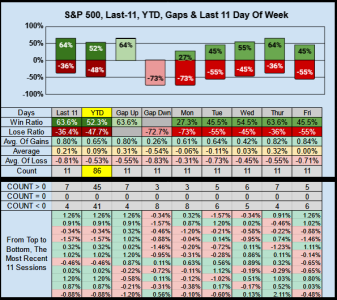
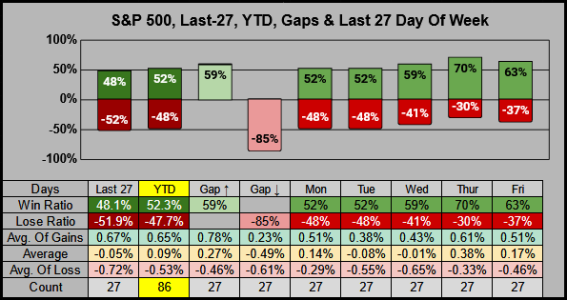
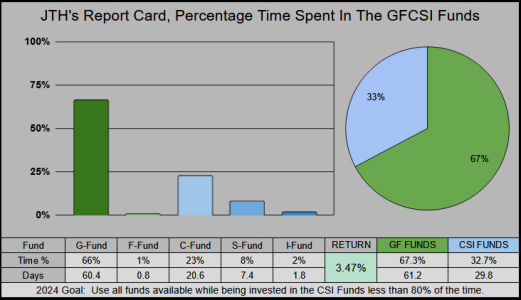
For myself, it’s now 18 sessions at 90% C-Fund with a YTD high of 3.47%.

202405012-4.png


Have a great Sunday…Jason

 
Back
Top