-
The Forum works well on MOBILE devices without an app: Just go to: https://forum.tsptalk.com
-
Please read our AutoTracker policy on the IFT deadline and remaining active. Thanks!
-
$ - Premium Service Content (Info) | AutoTracker Monthly Winners | Is Gmail et al, Blocking Our emails?
Find us on: Facebook & X | Posting Copyrighted Material
-
Join the TSP Talk AutoTracker: How to Get Started | Login | Main AutoTracker Page
You are using an out of date browser. It may not display this or other websites correctly.
You should upgrade or use an alternative browser.
You should upgrade or use an alternative browser.
JTH's Account Talk
- Thread starter JTH
- Start date
JTH
TSP Legend
- Reaction score
- 1,158
I like it but, Chiflada
Well, it if get worse, then I'll have 10% to add in next month.
JTH
TSP Legend
- Reaction score
- 1,158
Wednesday
Good morning
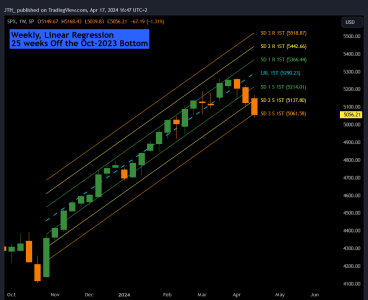
25 Weeks off the Oct-2023 bottom shows the Linear Regression Channel has pierced Standard Deviation 3. Although I have no way of proving this, the longer the data/time used, the more reliable the statistical range of price to the mean are.
Per the Google: The Empirical Rule states that 99.7% of data observed following a normal distribution lies within 3 standard deviations of the mean. Under this rule, 68% of the data falls within one standard deviation, 95% percent within two standard deviations, and 99.7% within three standard deviations from the mean.
In theory, the chart below should imply we are very oversold, within this range of both price & time. I should add the disclaimer, this bull run (with little retracement) is not the norm, so we may not see normal results.

JTH
TSP Legend
- Reaction score
- 1,158
Thursday
Good morning
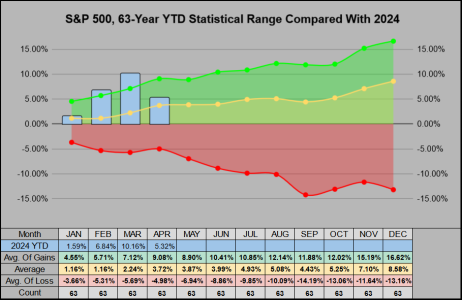
Looking at the 63-year YTD statistical range, this Wednesday we closed 5.31% YTD. By this perspective, we are still above the 63-year average YTD for April (the yellow line).
March was well out of bounds, so perhaps this is just an equalization of sorts. You'll notice, April to June are flat...

JTH
TSP Legend
- Reaction score
- 1,158
Monday
Good morning (post 2)
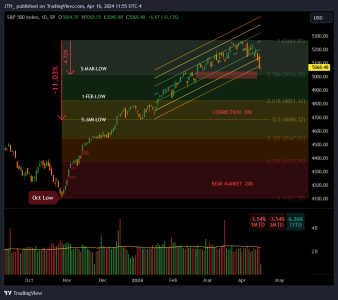
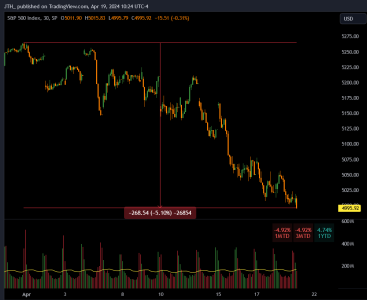
You may notice on the left side of the chart, I've annotated the previous 3 months of lows, this month we've pierced the 5-March low, and soon we may fill the most obvious lower open gap at 4983.21
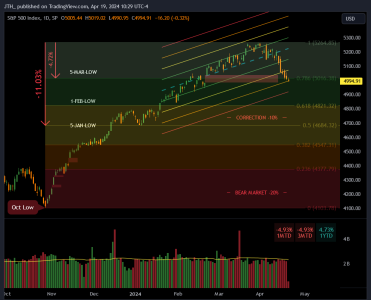
Each daily session the index closed positive 54% of the time, so this is what I focus on, but for fun....
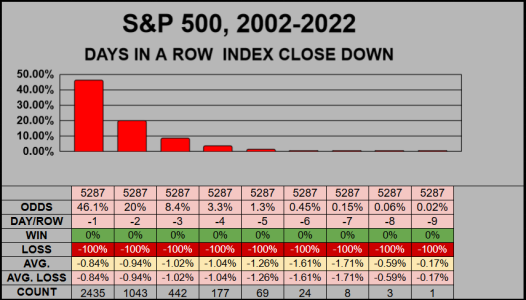
Today we are working on (potentially) our 6th consecutive close down. From 2002-2022 across 5,287 sessions and 2,435 negative sessions, a 6th negative close has happened 24 times which is about .45% of all sessions.
Good morning (post 2)
You may notice on the left side of the chart, I've annotated the previous 3 months of lows, this month we've pierced the 5-March low, and soon we may fill the most obvious lower open gap at 4983.21

Each daily session the index closed positive 54% of the time, so this is what I focus on, but for fun....
Today we are working on (potentially) our 6th consecutive close down. From 2002-2022 across 5,287 sessions and 2,435 negative sessions, a 6th negative close has happened 24 times which is about .45% of all sessions.

JTH
TSP Legend
- Reaction score
- 1,158
Re: Thursday 2 of 3
Good Morning
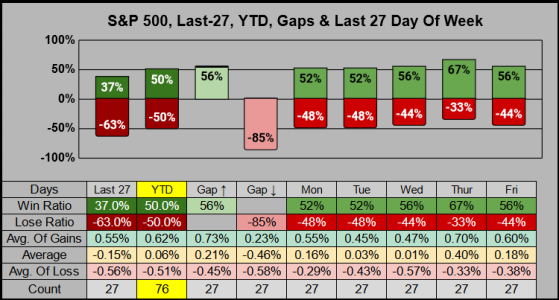
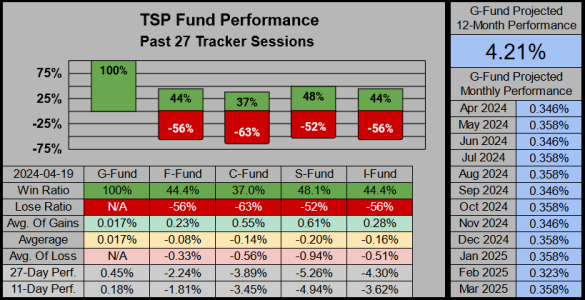
On the 27-day timeframe we have some fairly low win ratios, and only the G-Fund has a gain on the 11/27 day timeframes.
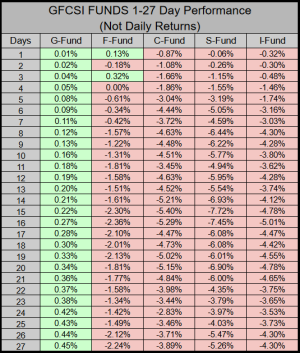
On the 1 to 27 day performance scale, it’s a strong sea of red.
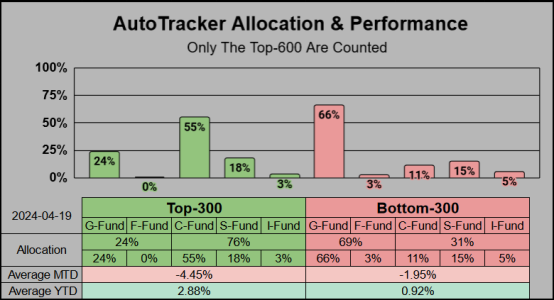
For the AutoTracker’s Top-600 our top half is mostly in the C-Fund, while the bottom half is mostly in the G-Gund. This April we’ve lost roughly half of this year’s gains.
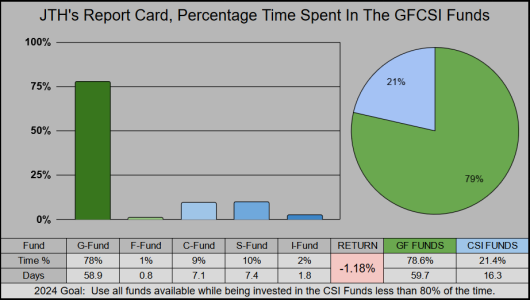
For myself, it’s the first time this year I'm in the red, have been kicked out of the Top-600, and the recent increased risk of 90C has yet to be rewarded. It’s not much of a concern for me, if we are lower next month, (than my previous IFT) then I’ll look for a spot to throw in the last 10% and ride the next wave up…or not…
Have a great Sunday…Jason
Good Morning
On the 27-day timeframe we have some fairly low win ratios, and only the G-Fund has a gain on the 11/27 day timeframes.

On the 1 to 27 day performance scale, it’s a strong sea of red.

For the AutoTracker’s Top-600 our top half is mostly in the C-Fund, while the bottom half is mostly in the G-Gund. This April we’ve lost roughly half of this year’s gains.

For myself, it’s the first time this year I'm in the red, have been kicked out of the Top-600, and the recent increased risk of 90C has yet to be rewarded. It’s not much of a concern for me, if we are lower next month, (than my previous IFT) then I’ll look for a spot to throw in the last 10% and ride the next wave up…or not…

Have a great Sunday…Jason
JTH
TSP Legend
- Reaction score
- 1,158
JTH
TSP Legend
- Reaction score
- 1,158
Wednesday
Good morning
Tomorrow I'll head back to Europe, so please don't break the markets while I'm gone
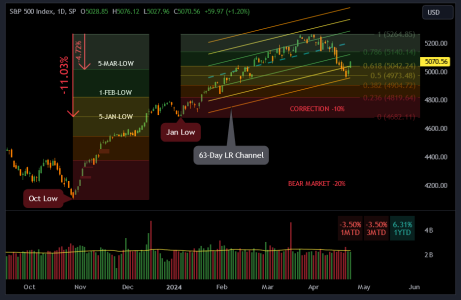
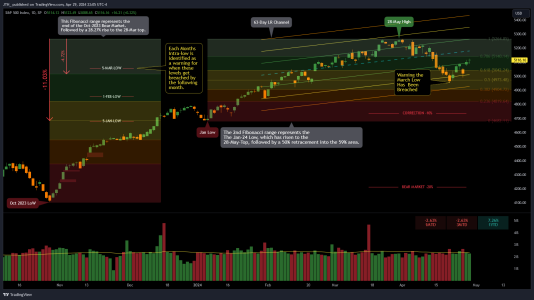
The Fibonacci range from the 5-Jan-2024 low shows we’ve retraced half of this year’s gains.
Last Friday the 3rd Standard Deviation on the 63-Day Linear Regression Channel was tagged.
Tuesday we closed back above the March Low.

JTH
TSP Legend
- Reaction score
- 1,158
Sunday
Good Evening
On the 27-day timeframe our CSI win ratios are below average.
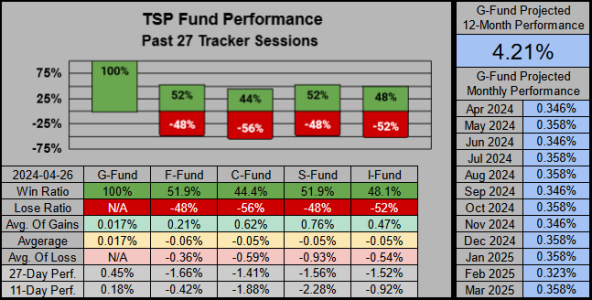
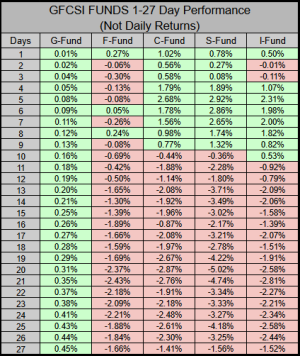
On the 1-27 day performance scale, we are starting to see some green in the shorter timeframes.
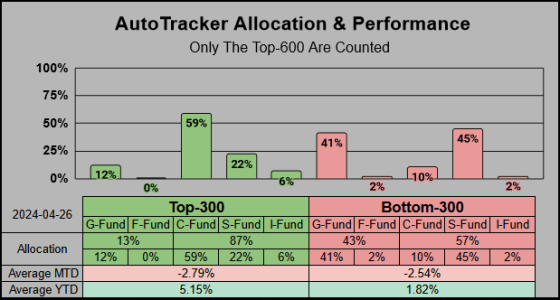
Per the usual trends this year, the Top-300 hold the C-Fund, and the Bottom-300 are predominantly in the G & S funds.
For myself, I’ve been invested in the CSI funds (timewise) 26% of the time, and with a goal of 80%, I have some work to do here. I have to admit that timing IFTs and allocations is far more difficult (for me) than a regular trading account, but part of the fun is knowing you have room for improvement.
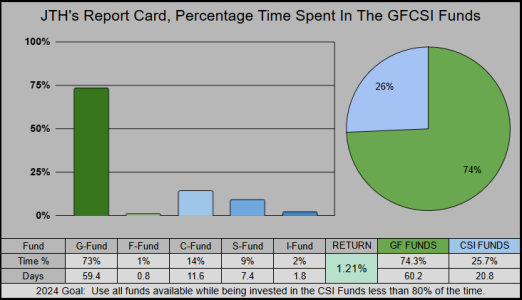
Have a great Sunday…Jason
Good Evening
On the 27-day timeframe our CSI win ratios are below average.

On the 1-27 day performance scale, we are starting to see some green in the shorter timeframes.

Per the usual trends this year, the Top-300 hold the C-Fund, and the Bottom-300 are predominantly in the G & S funds.

For myself, I’ve been invested in the CSI funds (timewise) 26% of the time, and with a goal of 80%, I have some work to do here. I have to admit that timing IFTs and allocations is far more difficult (for me) than a regular trading account, but part of the fun is knowing you have room for improvement.

Have a great Sunday…Jason
JTH
TSP Legend
- Reaction score
- 1,158
Monday
Good morning
Although it may not feel like it, last week’s 2.67% gain was the best of the past 25 weeks.
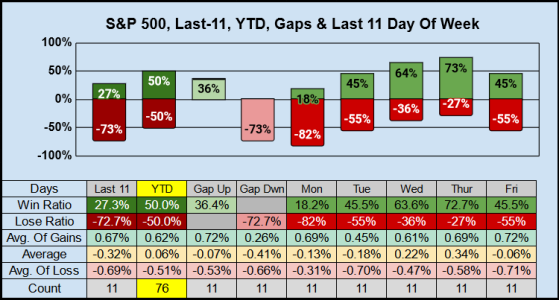
For the short-term across 11 sessions each, sellers are in control with the last 7 of 11 sessions having closed down. Overall, it’s been best to buy on Monday and sell on Wednesday or Thursday.
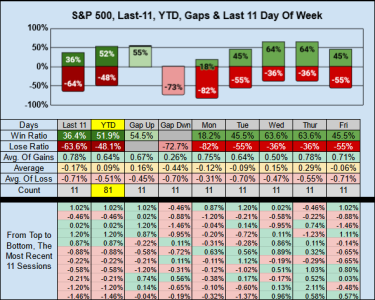
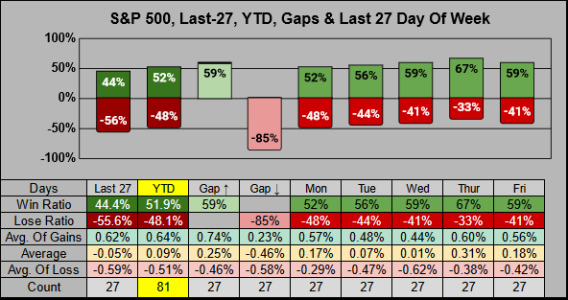
For the medium-term across 27 sessions each, sellers are in control with the last 15 of 27 sessions having closed down. Overall, it’s been best to buy on Monday and sell on Thursday.
For Buyers:
An opening gap down has given a 85% chance of closing the day down.
On Monday, the last 13 of 27 have closed down, giving us a 48% loss ratio.
Combined, an opening gap down with a Monday has a 52% loss ratio.
For Sellers:
An opening gap up has given a 59% chance of closing the day up.
Thursday has a 67% win ratio.
Combined, an opening gap up with a Thursday has a 63% win ratio.
Cheers...Jason
Good morning
Although it may not feel like it, last week’s 2.67% gain was the best of the past 25 weeks.
For the short-term across 11 sessions each, sellers are in control with the last 7 of 11 sessions having closed down. Overall, it’s been best to buy on Monday and sell on Wednesday or Thursday.

For the medium-term across 27 sessions each, sellers are in control with the last 15 of 27 sessions having closed down. Overall, it’s been best to buy on Monday and sell on Thursday.
For Buyers:
An opening gap down has given a 85% chance of closing the day down.
On Monday, the last 13 of 27 have closed down, giving us a 48% loss ratio.
Combined, an opening gap down with a Monday has a 52% loss ratio.
For Sellers:
An opening gap up has given a 59% chance of closing the day up.
Thursday has a 67% win ratio.
Combined, an opening gap up with a Thursday has a 63% win ratio.

Cheers...Jason
Epic
TSP Pro
- Reaction score
- 365
Re: Monday
Wow.... That certainly is an eye opening piece of information there.
Can't say enough good things about your meticulous record keeping and tracking all of this type of information, and then sharing it with all of us. Otherwise, I'd have no idea. Much appreciated ! ! ! :fing02:
Although it may not feel like it, last week’s 2.67% gain was the best of the past 25 weeks.
Wow.... That certainly is an eye opening piece of information there.
Can't say enough good things about your meticulous record keeping and tracking all of this type of information, and then sharing it with all of us. Otherwise, I'd have no idea. Much appreciated ! ! ! :fing02:
JTH
TSP Legend
- Reaction score
- 1,158
Re: Monday
Thank you, I did here it somewhere on a CNBC podcast and had just remembered this morning to check the stats for myself. I certainly wouldn't have thought last week was impressive, but then again I'm still thinking of the gaping hole I've been buying into this past month.
Over the past 7-sessions, we've just now recovered 50% of the 14-session -5.91% decline, so we are teetering in the fuzzy zone...
Wow.... That certainly is an eye opening piece of information there.
Can't say enough good things about your meticulous record keeping and tracking all of this type of information, and then sharing it with all of us. Otherwise, I'd have no idea. Much appreciated ! ! ! :fing02:
Thank you, I did here it somewhere on a CNBC podcast and had just remembered this morning to check the stats for myself. I certainly wouldn't have thought last week was impressive, but then again I'm still thinking of the gaping hole I've been buying into this past month.
Over the past 7-sessions, we've just now recovered 50% of the 14-session -5.91% decline, so we are teetering in the fuzzy zone...
- Reaction score
- 2,459
Re: Monday
I concur! Thanks, JTH!
I concur! Thanks, JTH!
Wow.... That certainly is an eye opening piece of information there.
Can't say enough good things about your meticulous record keeping and tracking all of this type of information, and then sharing it with all of us. Otherwise, I'd have no idea. Much appreciated ! ! ! :fing02:
Re: Wednesday
I’m a F/T programmer and I don’t have the patience to make judgments upon your input.c
Please simplify your work ASAP
Thanks
D
Thanks for all your input.Good morning
Tomorrow I'll head back to Europe, so please don't break the markets while I'm gone
The Fibonacci range from the 5-Jan-2024 low shows we’ve retraced half of this year’s gains.
Last Friday the 3rd Standard Deviation on the 63-Day Linear Regression Channel was tagged.
Tuesday we closed back above the March Low.
View attachment 60723
I’m a F/T programmer and I don’t have the patience to make judgments upon your input.c
Please simplify your work ASAP
Thanks
D
JTH
TSP Legend
- Reaction score
- 1,158
Re: Wednesday
So I'm gonna need some assist on this. Are looking for a clear buy/sell signal based on the consolidation of this data? Or are you thinking the data provided is too disjointed to make an accurate assessment.
Thanks for all your input.
I’m a F/T programmer and I don’t have the patience to make judgments upon your input.c
Please simplify your work ASAP
Thanks
D
So I'm gonna need some assist on this. Are looking for a clear buy/sell signal based on the consolidation of this data? Or are you thinking the data provided is too disjointed to make an accurate assessment.

JTH
TSP Legend
- Reaction score
- 1,158
Tuesday
Good morning
From 1961-2023 the average Monthly intra-low for the month of April was -2.63%. In 2024 terms this level is SPX 5116 (which is where we closed on Monday).
So today, we need 2.63% to close the month flat, but what are the chances of this happening? From 16,475 sessions, 178 sessions were 2.63% or greater, so historically we have about a 0.01% chance of closing any session at 2.63% or greater.
And of those 178 sessions:
51 occurred on a Tuesday
18 occurred in the month of April
8 occurred on the 30th of a month
6 occurred on the last day of a month
4 occurred on the 22nd trading day
Factoring in these 87 sessions we can now say we have roughly a .005% chance of closing the month flat or in the green.
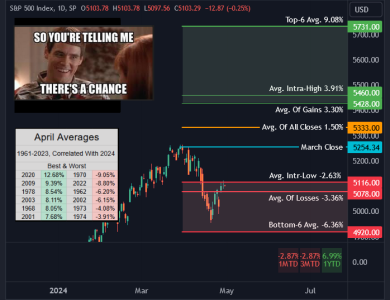
Have a great finish for the month, and let's see what happens this May...Jason
Good morning
From 1961-2023 the average Monthly intra-low for the month of April was -2.63%. In 2024 terms this level is SPX 5116 (which is where we closed on Monday).
So today, we need 2.63% to close the month flat, but what are the chances of this happening? From 16,475 sessions, 178 sessions were 2.63% or greater, so historically we have about a 0.01% chance of closing any session at 2.63% or greater.
And of those 178 sessions:
51 occurred on a Tuesday
18 occurred in the month of April
8 occurred on the 30th of a month
6 occurred on the last day of a month
4 occurred on the 22nd trading day
Factoring in these 87 sessions we can now say we have roughly a .005% chance of closing the month flat or in the green.

Have a great finish for the month, and let's see what happens this May...Jason
Similar threads
- Replies
- 0
- Views
- 84
- Replies
- 0
- Views
- 86
- Replies
- 0
- Views
- 106
- Replies
- 1
- Views
- 213

