JTH's Account Talk

Sunday

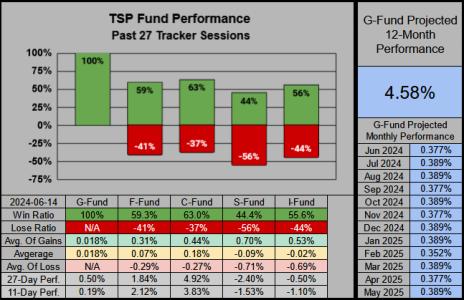
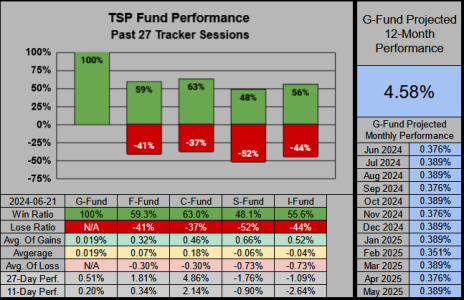
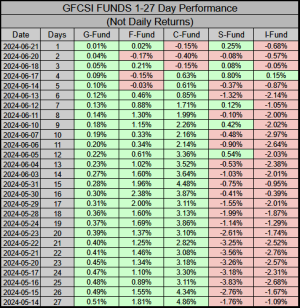
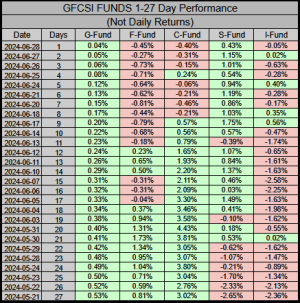
Per usual, the C-Fund is killing it this year with a 27-Session 63% win ratio and the best average gains of all funds.

20240616-1.png


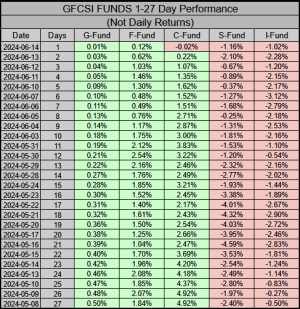
We have a sea of red on the S & I Funds.

At its worst, the S-Fund has lost -4.59% over the past 21 sessions.
At its worst, the I-Fund has lost -3.12% over the past 6 sessions.

20240616-2.png


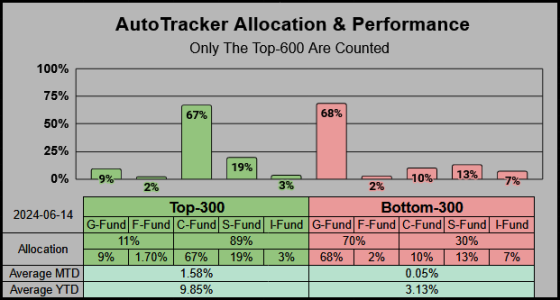
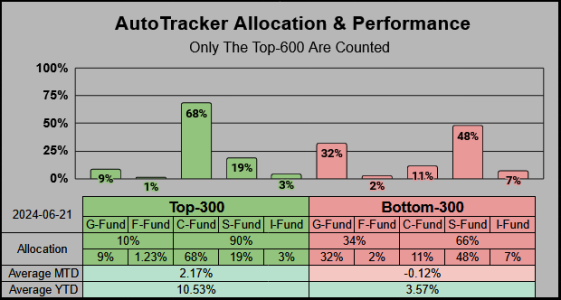
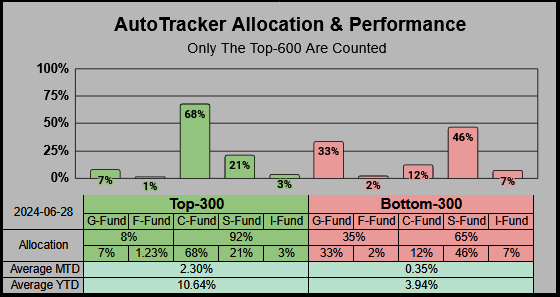
From the Top 600

The Top 300 are 67% allocated to the C-Fund Vs. The bottom 300 are 68% allocated to the G-Fund. There’s a herd of Buy & Hold S-Funders ranking from 637-724. This group needs about .50% to push the G-Funders out of the way.

20240616-3.png


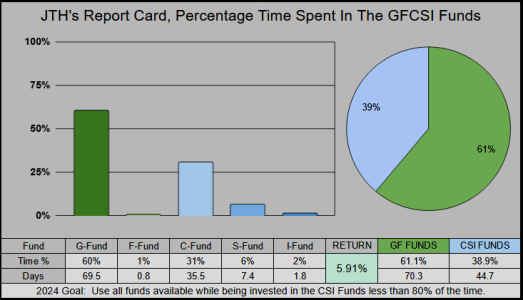
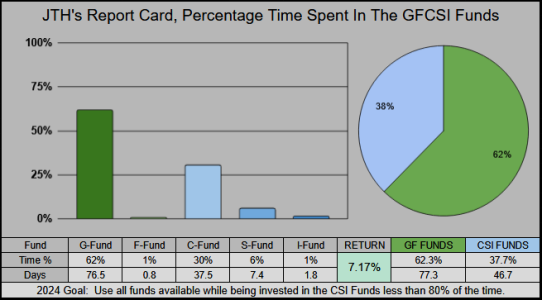
For myself, there was a quick 2-day trip in the G-Fund and now back in the C-Fund.

I made a play for the coffee cup, (it wasn’t a huge statistical edge), but I took it, and it ended up going against me. On the monthly scale I lost .20% to those pesky C-Funders. But there are always opportunities to be had, so I’ll look elsewhere.

20240616-4.png

 
Monday

Blog: The Best 252 Sessions


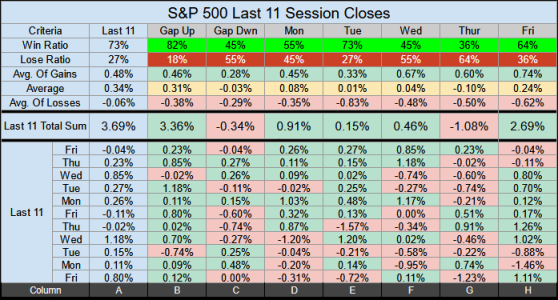
Column C: As of late, an opening gap down has been less reliable, only closing down 55% of the time. Long-term when the index gaps down, we close down 71% of the time.

Column E: Our last 6 Tuesdays have closed up and we have a 73% win ratio.

20240617-1.png
 
Yet another 52-Week High

Are we getting toppy yet?

I was curious how the S&P 500's current 52-week high & low range compared with previous weeks.

From 1961:

Last week our 52-week high & low range was 32.74% which ranks 1052 of 3311 (ranking in the upper 32 percentile)
Last week our 26-week high & low range was 16.01% which ranks 1557 of 3311 (ranking in the upper 47 percentile)
Last week our 13-week high & low range was 9.97% which ranks 1988 of 3311 (ranking in the 60 percentile)
 
Tuesday

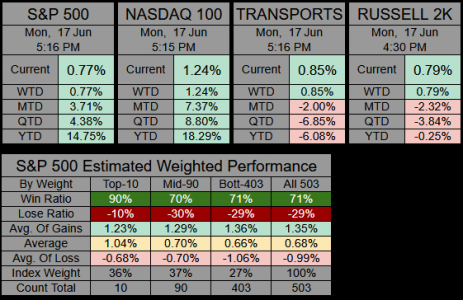
Monday was a great start to the week, all 4 of the major Indexes closed in the green.

The S&P 500's Top 10 had a 90% win ratio and even the Mid-90 & Bottom-403 pulled a 70% win ratio.

Since we've only had the Juneteenth stock market closure going back to 2022, it will be interesting to see how a middle-day holiday plays out (over time).

20240618-1.png
 
Thursday

Always a glutton for punishment... IFT EoB 100G
Gains are locked in for the month, (not that I wouldn’t want more), but 3.86% MTD is respectable.

At 7.01% YTD I’ve put risk-on in the CSI Funds 40% of the time. Compared with the C-Fund. 15.81% YTD at 40% is 6.32% so (by this measure) I’m doing well.


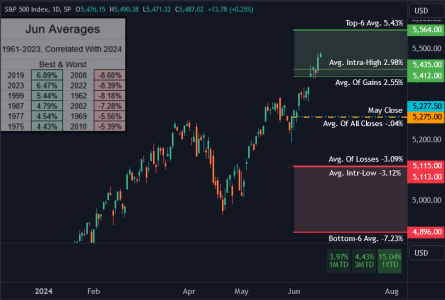
In the meantime, June is doing well, I have no data to justify calling a top, so we will go up until we don’t.

202406120-1.png


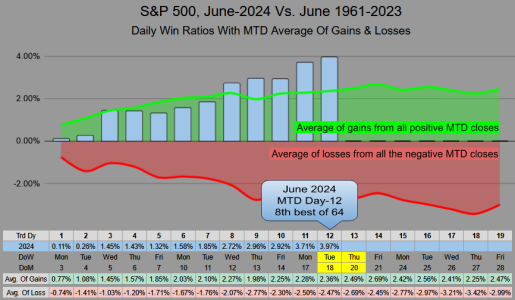
At this stage of the MTD chart, I expect the peak to fall somewhere between trading day 12 to 16.

202406120-2.png


Our new Top 3 now is weighted at 21.16% of the S&P 500 Index, and 22.72% of the NASDAQ 100

On the 2nd Column, Nvidia's Opening Gap was 3.11% but it's currently at -2.86%

202406120-3.png
 
Friday

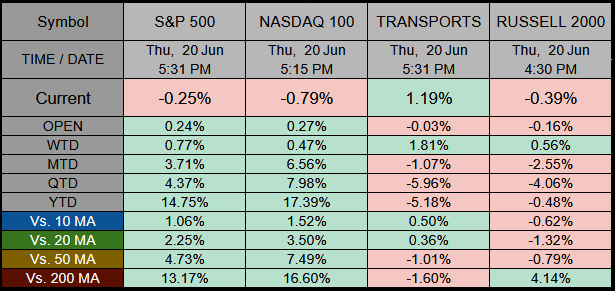
Some highlights from Thursday’s price action.

Both the S&P 500 & NASDAQ 100 gaped up at the open, but closed the session down.

202406121-0.png


Here's an Index breakdown of a gap reversal day.

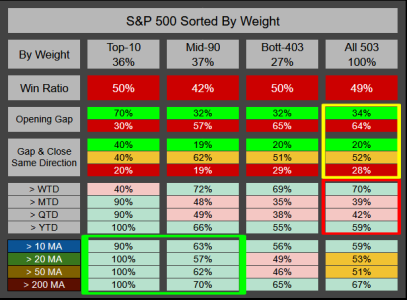
Within the yellow box: From all 503 holdings, 52% closed in the opposite direction of their opening gap.


Of the 34% of positive gaps, only 20% closed the session positive.
Of the 63% of negative gaps, 28% closed the session down.


202406121-1.png
Red Box: 39% of 503 holdings are positive MTD.
Green Box: The Top-100 are mostly above their 10/20/50/200 day moving averages.
 
Re: Sunday

From the 2024 Stats Blog

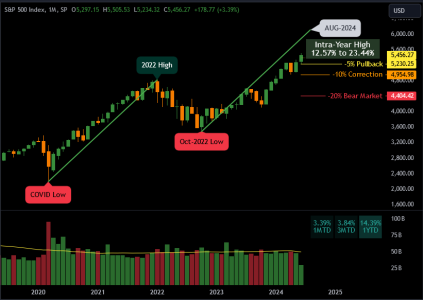
"Above the January 2022 high of 4818.62 we are entering uncharted territory. With having only historical support to use as a reference, I'll speculate we are in the process of a measured move up (using the Covid-low to the Jan 2022 high as a frame of reference). For entertainment, if I were to give an estimate for 2024:

The intra-high will range from 12.57% to 23.44%

The close will range from 4.43% to 9.54%
The Intra-low will range from -3.21% to -10.93% "

This measured move up ends in August, but charts are almost never perfectly symmetrical.

202406121-3.png
 
Sunday

Good Sunday

The C-Fund continues to reign supreme with a 63% win ratio and .18% average daily gains.

202406123-1.png
Across these past 3 sessions, the F-Fund had the most gains at .21%

202406123-2.png
From the Top-600:

The Top-300’s allocations are relatively unchanged.
The Bottom-300 saw a 36% reduction in the G-Fund which mostly moved into the S-Fund.

202406123-3.png
 
Monday

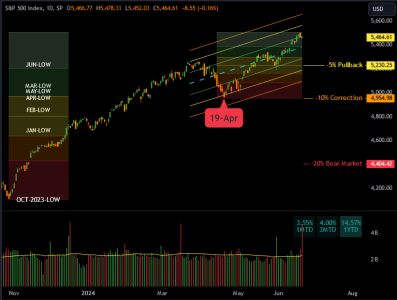
45 Sessions ago was the April Low. It was also the last time we closed down more than 2 consecutive sessions. Today we get our 5th test for a 3rd day down.
__ A -5% pullback is a 50% retracement of the Apr-low
__ A -10% correction is the Apr-low

202406124-0.png
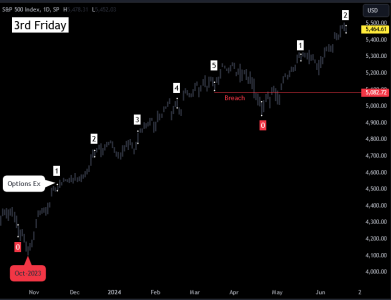
Excluding this last Friday’s Options Ex: 6 of 7 Options Ex have closed higher than the previous Options Ex.

202406124-00.png
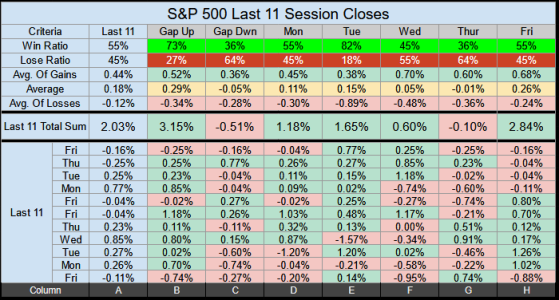
An an Open Gap Down combined with closing the session down is at 64%. This may seem like a strong stat, but across 252 sessions this stat runs at 71%
__ Our last 7 Tuesday sessions have closed positive. This is the longest Tuesday win streak since 28-Aug-2018 at 8 sessions.
__ Our last 4 Friday sessions have closed down, but the losses have been small.

202406124-1.png
 
Tuesday

A brief look at the Top-10, which is weighted at 36% of the S&P 500.

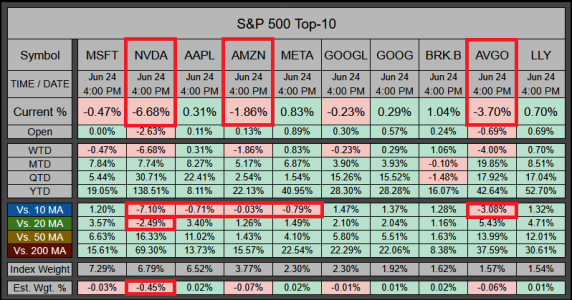
Nvidia lost -6.68% (losing a weighted -.45% for the index) with the Top-10 losing -.55% overall. Half of the Top-10 closed under the 10-Day moving average with Nvidia being the first to close below the 20 day MA.

20240625-02.png
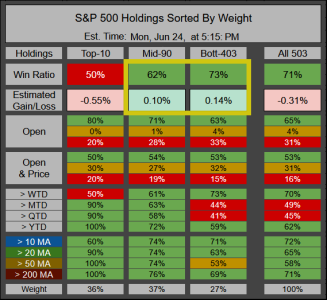
While the Index did close down -.31% our Mid-90 & Bottom-403 had a decent day.

62% of the Mid-90 finished positive, with an overall gain of .10%
73% of the Bottom-403 finished positive, with an overall gain of .14%

20240625-03.png
 
Re: Tuesday

I'm not adding anything of interest, but I never noticed that GOOGL (#6) and GOOG (#7) are both in the top 10. I guess that makes Alphabet #4 on the list combined.
 
Re: Tuesday

I'm not adding anything of interest, but I never noticed that GOOGL (#6) and GOOG (#7) are both in the top 10. I guess that makes Alphabet #4 on the list combined.

Yes, (I see it this way too) and it slightly annoys me, to think it should be listed as #4 and weighted at 4.22%. The other thing that chaps my hide is Google makes up 23% of XLC's Communication Services Sector. Both Meta and Google make up 45% of this sector (from 23 holdings). There's just not enough diversity in this ETF, everything else is weighted at < 5%.
 
Re: Tuesday

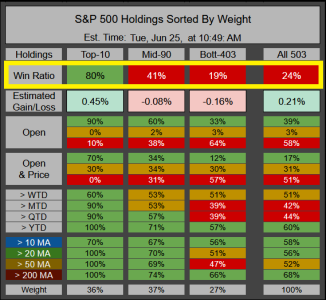
Interesting dynamic (opposite of yesterday).

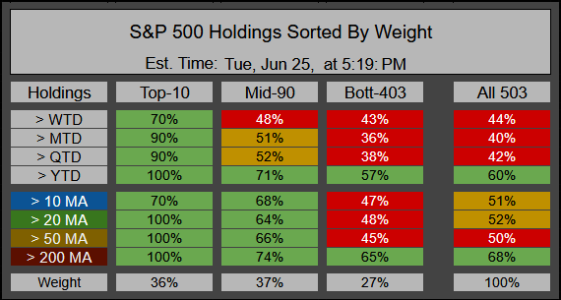
Eight of the Top-10 are pulling the index up, everything else appears to be pulling the index down.

Nividia is up 3.78% but with Monday’s loss of -6.68% (and a 3-day loss of -16.14%) this could prove to be nothing more than a dead-cat-style bounce.

80% of the Top-10 are positive on the session, with 5 greater than 1%.
41% of the Mid-90 are positive on the session.
19% of the Bottom-403 are positive on the session.

20240625-04.png
 
Wednesday

The S-Fund is up 2.25% YTD, while IWM’s Russell 2000 ETF is down -.07% YTD.

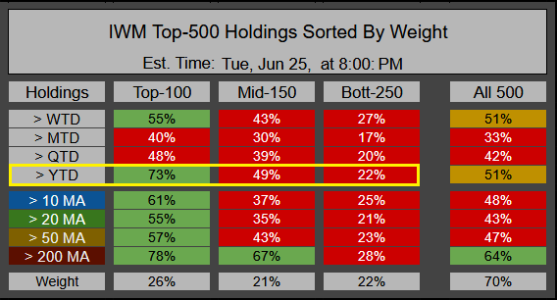
IWM has 1900+ holdings, but we only need to track its Top-500 to get a market weighted 70% of this index ETF. There is a common theme here and it’s the same theme running alongside the S&P 500. The lower the weight, the lower the performance. In every category of timeframes & moving averages shown, from the Top-100, to the Mid-150, to the Bottom-250 (of 500), performance gets progressively worse from top to bottom. As an example:

73% of the Top-100 are positive YTD
49% of the Mid-250 are positive YTD
22% of the Bottom-250 are positive YTD

20240626-01.png


The same theme is also shown on the S&P 500, the key difference, it has a lot less red than IWM, and it also represents the entire index.

20240626-02.png
 
Re: Tuesday

SPY 30-min gapped up .25% in the pre-market, then floated down into the red.

This kinda implied volatility might make for an interesting session.

20240626-03.png
 
Sunday

Good Sunday

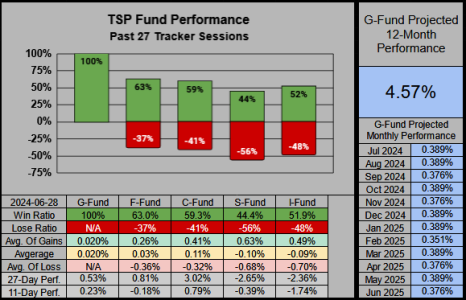
This week the F-Fund has the best win ratio, but the C-Fund continues to provide the best gains.

20240630-01.png


Across these past 10 sessions, the S-Fund has put in the best performance, but for sessions 11-27 it’s the C-Fund.

20240630-02.png


Of the Top-600, (in regards to allocations) there was little change. For MTD performance, the Bottom-300 averaged just 15% of what the Top-300 averaged.

20240630-03.png


Currently 100G. For the Month of June, 12 sessions were in the C-Fund with 7 in the G-Fund, earning 4.02% for the month.

20240630-04.png
 
Back
Top