-
The Forum works well on MOBILE devices without an app: Just go to: https://forum.tsptalk.com
-
Please read our AutoTracker policy on the IFT deadline and remaining active. Thanks!
-
$ - Premium Service Content (Info) | AutoTracker Monthly Winners | Is Gmail et al, Blocking Our emails?
Find us on: Facebook & X | Posting Copyrighted Material
-
Join the TSP Talk AutoTracker: How to Get Started | Login | Main AutoTracker Page
You are using an out of date browser. It may not display this or other websites correctly.
You should upgrade or use an alternative browser.
You should upgrade or use an alternative browser.
JTH's Account Talk
- Thread starter JTH
- Start date
JTH
TSP Legend
- Reaction score
- 1,158
Monday
Good morning
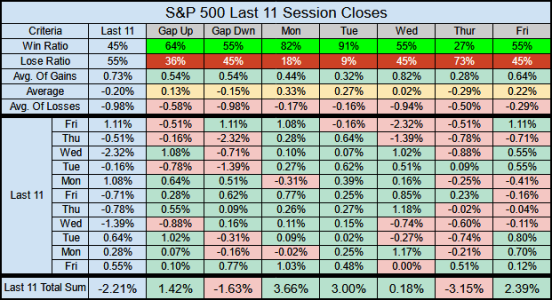
The past 11 sessions have a 45% win ratio, but the overall theme remains the same.
An opening Gap Up leads to a positive close 64% of the time (below the 72% long-term avg.)
An opening gap down leads to a negative close 45% of the time (below the 70% long-term avg.)
Mon & Tue are the best days of the week.
Wednesday is flat, Thursday is horrible, Friday is ok.
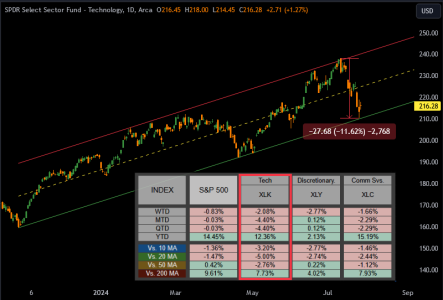
For the most part, it’s been 3 sectors which held back the index last week, with the Tech Sector leading the way down. The -11.62% correction bounced off the bottom of a parallel price channel which dates back to the Oct-2023 low.
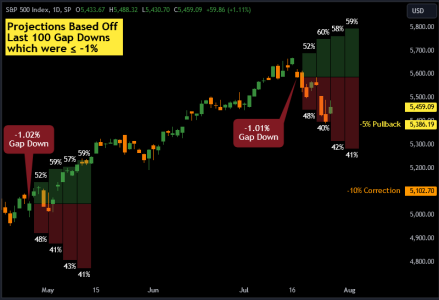
We’ve put 7 sessions into the 12-Day projection range based off last week’s blog Strong Gaps: The New Norm.
So it's the final week of the month, just 3 trading days left and we are flat for July.
Anything can happen....
Good morning
The past 11 sessions have a 45% win ratio, but the overall theme remains the same.
An opening Gap Up leads to a positive close 64% of the time (below the 72% long-term avg.)
An opening gap down leads to a negative close 45% of the time (below the 70% long-term avg.)
Mon & Tue are the best days of the week.
Wednesday is flat, Thursday is horrible, Friday is ok.

For the most part, it’s been 3 sectors which held back the index last week, with the Tech Sector leading the way down. The -11.62% correction bounced off the bottom of a parallel price channel which dates back to the Oct-2023 low.

We’ve put 7 sessions into the 12-Day projection range based off last week’s blog Strong Gaps: The New Norm.

So it's the final week of the month, just 3 trading days left and we are flat for July.
Anything can happen....
JTH
TSP Legend
- Reaction score
- 1,158
Not liking the S&P 500's price action today, (my impression) this is a large-cap Top-10 Tech bounce, but it's not all that impressive.
IWM's small caps, show broad-based selling across the entire spectrum, but it's mostly in the upper half of it's recent trading range, some selling at these levels is fair game.
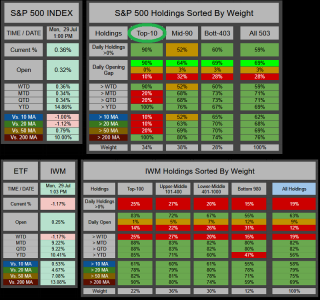
IWM's small caps, show broad-based selling across the entire spectrum, but it's mostly in the upper half of it's recent trading range, some selling at these levels is fair game.

JTH
TSP Legend
- Reaction score
- 1,158
Tuesday
Good afternoon
I was finishing up some stats for September when I thought I'd do some digging around with the Fed Funds Rate and see if I could find a correlation with monthly performance. I did a similar study some time ago, and recall being disinterested with the results (as I am again this time). Most likely the problem is the way the markets anticipate (or price in) economic data. If I want the correlation I'm looking for, then I will have to build a better model that can stagger the filtered results so that we can look 1-12 months out.
Anyhow, we have 752 months sorting the Fed Fund Rate from least to most, divided by 12-Columns, giving us 63 months per column. Our current rate resides within the black box. Ideally we want the best performance & gains on the left (with lower rates) and gradually getting worse as the columns go right. Some of this is true, but some of it does not fit the expectations.

- Reaction score
- 521
Most likely the problem is the way the markets anticipate (or price in) economic data.
I could imagine there are many different scenarios the market has faced during these Fed Fund Rates. Is the Fed in the middle of cutting or raising rates? How long has the economy been exposed to a rate?
Right now the market seems fully locked into the idea of a rate cut in September. So much so that the current probability of the Fed Fund Rate being its current value after the September FOMC meeting is at 0%. I think these probabilty changes are what affect the market.
I think any suggestion by the Fed tomorrow that they are still timid about cut in Septemebr will force the market to readjust its current prices to reflect its confiidence.
JTH
TSP Legend
- Reaction score
- 1,158
I could imagine there are many different scenarios the market has faced during these Fed Fund Rates. Is the Fed in the middle of cutting or raising rates? How long has the economy been exposed to a rate?
Yea, hence the issue, lot's of moving parts here, even if I could get it sorted correctly, there's no way I could build a probability model, maybe if we had 500 years of data :smile:
JTH
TSP Legend
- Reaction score
- 1,158
Wednesday
Good morning
The Top-10 S&P 500 holdings currently make up a weighted 34.16% of the Index. On Tuesday (collectively) they lost -.57% which means, the next 74 holdings would need to earn .57% just to break even. Instead, the next 493 holdings (after the Top-10) earned the index .13%
We should also consider 8 of the Top-10 are down for the month and trading below their 50-MA.
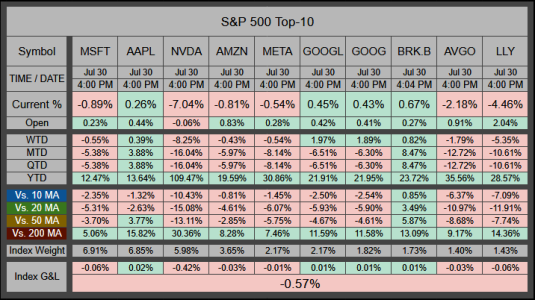
But this doesn’t tell us the full story. The Equal-Weighted Index closed positive on the day at .46%
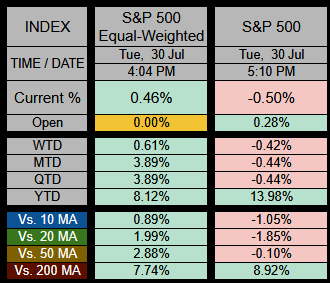
On the session, an equally weighted 68% of holdings closed > than 0%, and 55% of weighted holdings closed > than 0%, but this didn't help out the Index.

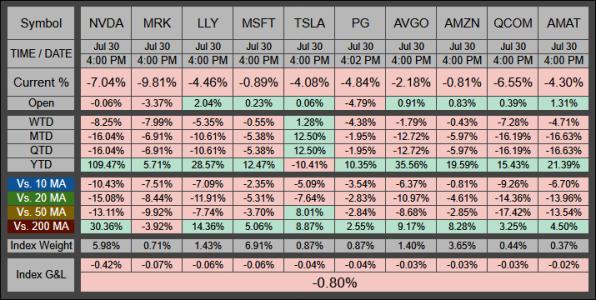
Here's the corporate....The Top-10 Weighted losers for the session, lost us an estimated -.80%
Good morning
The Top-10 S&P 500 holdings currently make up a weighted 34.16% of the Index. On Tuesday (collectively) they lost -.57% which means, the next 74 holdings would need to earn .57% just to break even. Instead, the next 493 holdings (after the Top-10) earned the index .13%
We should also consider 8 of the Top-10 are down for the month and trading below their 50-MA.

But this doesn’t tell us the full story. The Equal-Weighted Index closed positive on the day at .46%

On the session, an equally weighted 68% of holdings closed > than 0%, and 55% of weighted holdings closed > than 0%, but this didn't help out the Index.

Here's the corporate....The Top-10 Weighted losers for the session, lost us an estimated -.80%

JTH
TSP Legend
- Reaction score
- 1,158
Thursday
Good morning
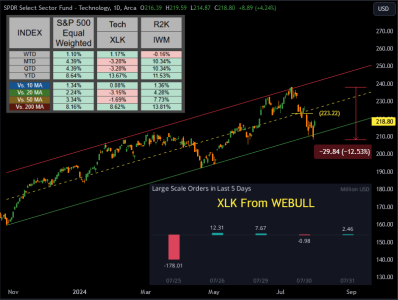
As we've noticed, there's been some fluctuations in performance amongst Large Cap Tech, The Equal-Weighted S&P 500, and the Russel 2000. One day Small caps lead, the next it's the Equal Weighted S&P 500, or it's Tech, but it doesn't ever seem to be all components at the same time.
One of the ETFs I'm watching the most, is XLK which is weighted at about 32% of the S&P 500. With a -12.53% loss off the 52-week highs, it's in "correction mode" and I'm watching to see if it can recover half of those losses with a close above 223.22 (at the yellow line), which would be a 50% bounce off the correction.

JTH
TSP Legend
- Reaction score
- 1,158
Report Card
Report Card time.
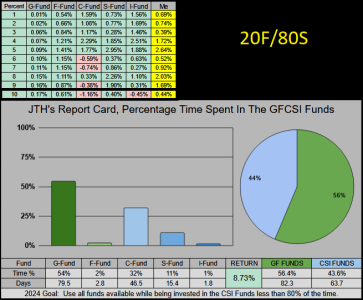
Finished out the month with a 1.46% gain & 8.73% YTD (not my best work). Over the past 10 sessions I've been 20F/80S which was a better decision than the previous 100C, but not by much and not for long...
The good news, we have a fresh set of IFTs, the bad news, the month is starting off badly, so if you're already in (like me) than there's some pain to be absorbed. If it gets bad enough than it's either an exit to G/F or lump in that 20F into one of the CSI funds and work towards an edge.
BLOG: Stats for August

Last edited:
JTH
TSP Legend
- Reaction score
- 1,158
At least you've got that 20% F-fund to cut down on today's losses in the S-fund. The bond ETF BND is up more than 0.4%.
Thx, and I may need every penny of it...
JTH
TSP Legend
- Reaction score
- 1,158
Friday
Good morning
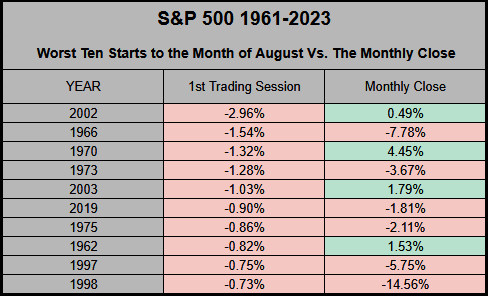
Thursday 1 August had a rough start with a -1.37% loss. Twas the 3rd worst start to August, going back to 1961. Listed below are the Bottom-10 worst August openings and their monthly close, from the previous 63-years.
Good morning
Thursday 1 August had a rough start with a -1.37% loss. Twas the 3rd worst start to August, going back to 1961. Listed below are the Bottom-10 worst August openings and their monthly close, from the previous 63-years.

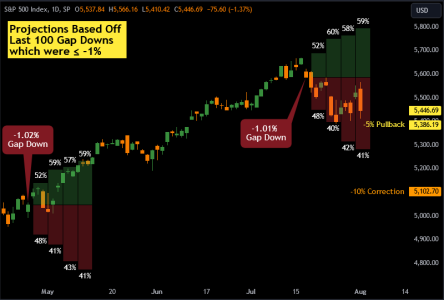
We’ve put 7 sessions into the 12-Day projection range based off last week’s blog
Today is the final day of the 12-day projection based on historical data from ≤ -1% gaps down. During this time we had an additional -.90% gap down on 24-July which has since been filled (but not overtaken).

JTH
TSP Legend
- Reaction score
- 1,158
Re: Wednesday
Good Sunday
BLOG: Correction...
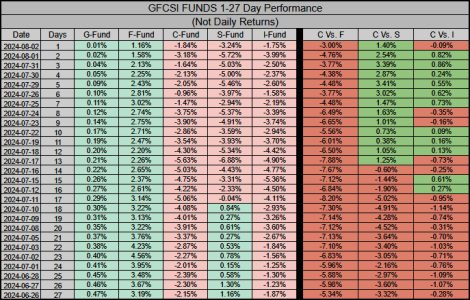
Of the past 27-sessions, there’s been a clear shift in performance, the F-Fund leads the pack with a 66.7% win ratio and 3.19% gain.
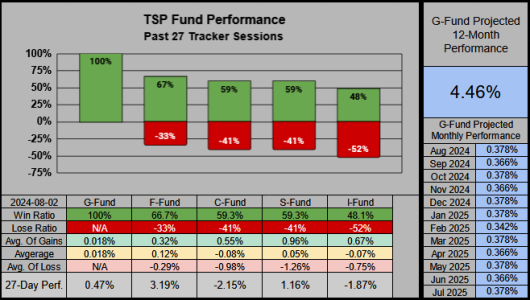
On the 2nd to last column, (C-Fund Vs. S-Fund) the C-Fund is outperforming the S-Fund over the past 13 sessions.
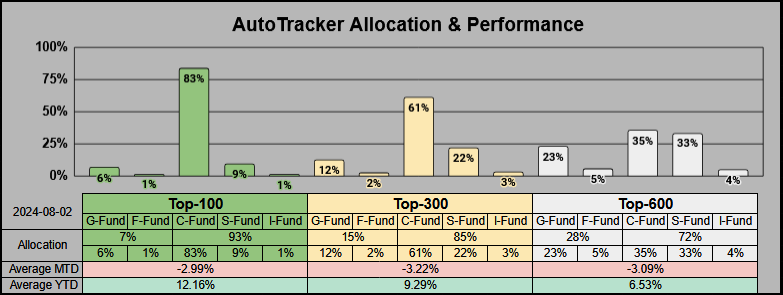
Our Top-100 have an 83% allocation into the C-Fund.
Good Sunday
BLOG: Correction...
Of the past 27-sessions, there’s been a clear shift in performance, the F-Fund leads the pack with a 66.7% win ratio and 3.19% gain.

On the 2nd to last column, (C-Fund Vs. S-Fund) the C-Fund is outperforming the S-Fund over the past 13 sessions.

Our Top-100 have an 83% allocation into the C-Fund.

JTH
TSP Legend
- Reaction score
- 1,158
Monday
Good morning
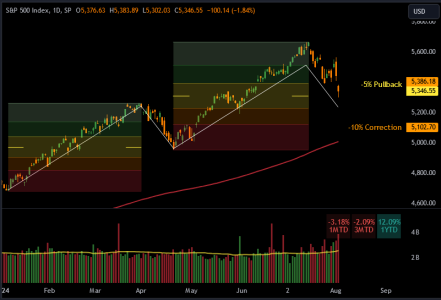
Not that any of us want to hear this, but it’s better to flush out the markets fast, then get sliced into smaller pieces over a long period of time. At this point if we hit the -10% correction, you just know we’ll be too close to the 200-SMA (at the red line) not to breach it. Going back to the Oct-2023 low (which was the last time we breached the 200-SMA) a 50% retracement takes us down to SPX 4889 which would be a -13.83% correction. A Bear Market’s -20% gets triggered at SPX 4535.
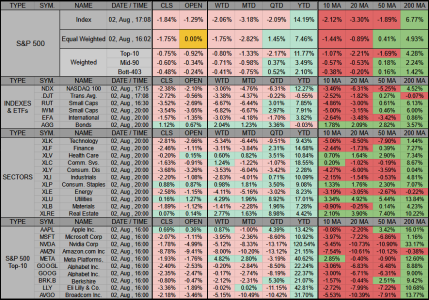
My spreadsheets were taking too long to load, so I’ve consolidated some of the data. The Transports & Amazon are below the 200-MA, I’m sure there will be more red to follow…
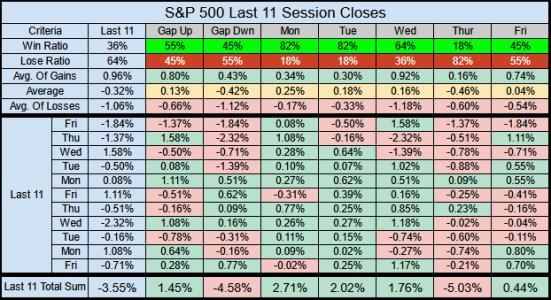
Here’s the short-term 11-session stats. The last 4 times we gaped down at the open we closed down, they were big gaps with strong negative closes, losing us -6.26% over those 4 sessions.
For myself (within TSP) there’s a train coming and I’m getting off the S-Fund’s tracks. From my previous post you can see the F-Fund has the current best performance, so that’s where I’ll take my chances.
IFT EoB Today from 20F/80S to 100F
If you haven’t read my latest blog, pls do.
Correction...
Good morning
Not that any of us want to hear this, but it’s better to flush out the markets fast, then get sliced into smaller pieces over a long period of time. At this point if we hit the -10% correction, you just know we’ll be too close to the 200-SMA (at the red line) not to breach it. Going back to the Oct-2023 low (which was the last time we breached the 200-SMA) a 50% retracement takes us down to SPX 4889 which would be a -13.83% correction. A Bear Market’s -20% gets triggered at SPX 4535.

My spreadsheets were taking too long to load, so I’ve consolidated some of the data. The Transports & Amazon are below the 200-MA, I’m sure there will be more red to follow…

Here’s the short-term 11-session stats. The last 4 times we gaped down at the open we closed down, they were big gaps with strong negative closes, losing us -6.26% over those 4 sessions.

For myself (within TSP) there’s a train coming and I’m getting off the S-Fund’s tracks. From my previous post you can see the F-Fund has the current best performance, so that’s where I’ll take my chances.
IFT EoB Today from 20F/80S to 100F
If you haven’t read my latest blog, pls do.
Correction...
Re: Monday
Guten morgen, Jason. Yes, I think I'm going to make the same move: 100% F-fund today.Good morning
Not that any of us want to hear this, but it’s better to flush out the markets fast, then get sliced into smaller pieces over a long period of time. At this point if we hit the -10% correction, you just know we’ll be too close to the 200-SMA (at the red line) not to breach it. Going back to the Oct-2023 low (which was the last time we breached the 200-SMA) a 50% retracement takes us down to SPX 4889 which would be a -13.83% correction. A Bear Market’s -20% gets triggered at SPX 4535.
View attachment 61484
My spreadsheets were taking too long to load, so I’ve consolidated some of the data. The Transports & Amazon are below the 200-MA, I’m sure there will be more red to follow…
View attachment 61485
Here’s the short-term 11-session stats. The last 4 times we gaped down at the open we closed down, they were big gaps with strong negative closes, losing us -6.26% over those 4 sessions.
View attachment 61486
For myself (within TSP) there’s a train coming and I’m getting off the S-Fund’s tracks. From my previous post you can see the F-Fund has the current best performance, so that’s where I’ll take my chances.
IFT EoB Today from 20F/80S to 100F
If you haven’t read my latest blog, pls do.
Correction...
JTH
TSP Legend
- Reaction score
- 1,158
Re: Monday
Thanks, I hope it works out for all of us, there's always the possibility of a pop tomorrow for a partial recovery, but I'm gonna sit this out on the sidelines, I'll still have 1 more IFT to pop back in if the conditions get better.
Guten morgen, Jason. Yes, I think I'm going to make the same move: 100% F-fund today.
Thanks, I hope it works out for all of us, there's always the possibility of a pop tomorrow for a partial recovery, but I'm gonna sit this out on the sidelines, I'll still have 1 more IFT to pop back in if the conditions get better.
JTH
TSP Legend
- Reaction score
- 1,158
Monday Part 2
This morning the S&P 500 gaped down at the open -3.66% tied as the 3rd worst from 1961
We never know how these things will work out, historically, here's what's happened before.
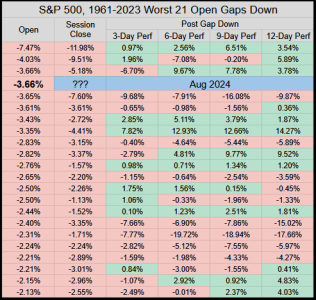
The 100 worst opening gaps down range from -1.16% to -11.98% with only 6 of those 100 closing the session positive.
The 12-Day Performance after has a 60% win ratio (in theory that would be this 21-Aug). So perhaps we have a 60% chance of a 3.61% gain (not including today) or a 40% chance of a -5.37% loss (on top of today's potential loss).

This morning the S&P 500 gaped down at the open -3.66% tied as the 3rd worst from 1961
We never know how these things will work out, historically, here's what's happened before.

The 100 worst opening gaps down range from -1.16% to -11.98% with only 6 of those 100 closing the session positive.
The 12-Day Performance after has a 60% win ratio (in theory that would be this 21-Aug). So perhaps we have a 60% chance of a 3.61% gain (not including today) or a 40% chance of a -5.37% loss (on top of today's potential loss).

JTH
TSP Legend
- Reaction score
- 1,158
Tuesday
Good morning
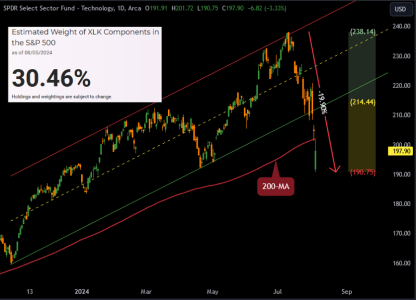
The Technology SPDR ETF XLK represents a weighted 30.46% of the S&P 500 Index. Off the 52-Week Highs the 7-Day Low has corrected -19.90%
Within XLK, the Top-3 S&P 500 stocks represent a weighted 19.67% of the S&P 500 Index and 46.46% of the XLK ETF.
Off the 52-Week Highs the 7-Day Low for the Top-3 Holdings has corrected:
-17.38% Apple
-17.67% Microsoft
-53.72% Nvidia Corp.
As a Guesstimate, looking at the chart below we would first need to stabilize above the 200-MA. Afterwards we might expect a 50% bounce to XLF 214.44. This is just under the green channel trendline. This is the ideal level I’d look for a rejection as we attempt to re-enter the channel. In my mind, once a channel (as strong & long as this one) is broken, it’s never recaptured, but an attempt is always made.
Anyhow, it should be fun to see how all this plays out…
Blog: What's Next?
Good morning
The Technology SPDR ETF XLK represents a weighted 30.46% of the S&P 500 Index. Off the 52-Week Highs the 7-Day Low has corrected -19.90%
Within XLK, the Top-3 S&P 500 stocks represent a weighted 19.67% of the S&P 500 Index and 46.46% of the XLK ETF.
Off the 52-Week Highs the 7-Day Low for the Top-3 Holdings has corrected:
-17.38% Apple
-17.67% Microsoft
-53.72% Nvidia Corp.
As a Guesstimate, looking at the chart below we would first need to stabilize above the 200-MA. Afterwards we might expect a 50% bounce to XLF 214.44. This is just under the green channel trendline. This is the ideal level I’d look for a rejection as we attempt to re-enter the channel. In my mind, once a channel (as strong & long as this one) is broken, it’s never recaptured, but an attempt is always made.

Anyhow, it should be fun to see how all this plays out…
Blog: What's Next?
- Reaction score
- 821
Re: Tuesday
Not sure what your idea of fun is but for sure it will be interesting. Hopefully not frustrating.
Good morning
Anyhow, it should be fun to see how all this plays out…
Blog: What's Next?
Not sure what your idea of fun is but for sure it will be interesting. Hopefully not frustrating.
Similar threads
- Replies
- 0
- Views
- 84
- Replies
- 0
- Views
- 86
- Replies
- 0
- Views
- 106
- Replies
- 1
- Views
- 213
