You know what? I have been deficient in watching my charts closely lately.
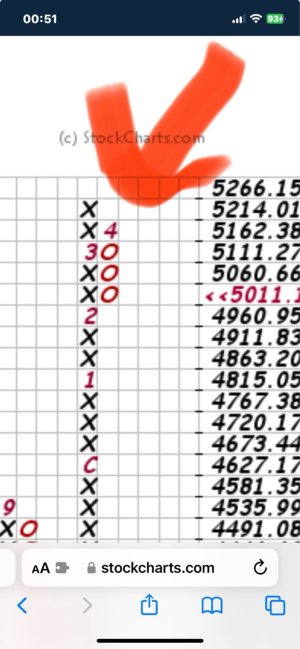
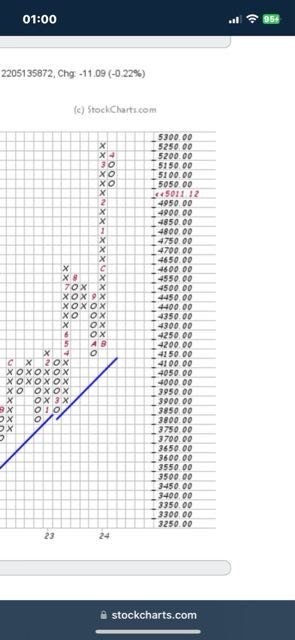
I’m very much a believer in the Point and Figure (P & F) charts available on Stockchart.com
Today I looked at the P&F charts for the S&P 500, the DWCF, and my GE and Apple stock .
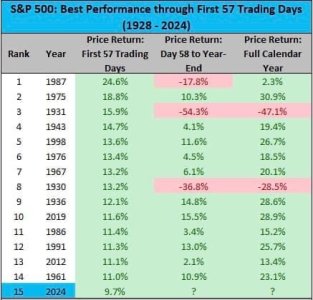
It’s a bit shocking when I look at it. I’m thinking that this market needs to take a break- and it could be a significant break, and soon.
I’m thinking down 3-5% is due any time now, maybe more.
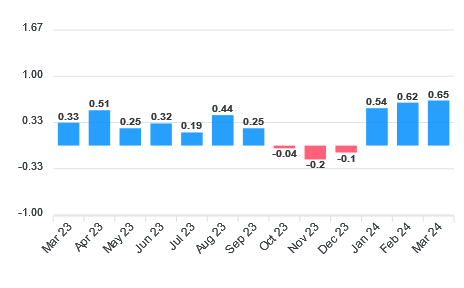
Nothing is wrong- it’s just too much up, for too long. A break /breather is due.
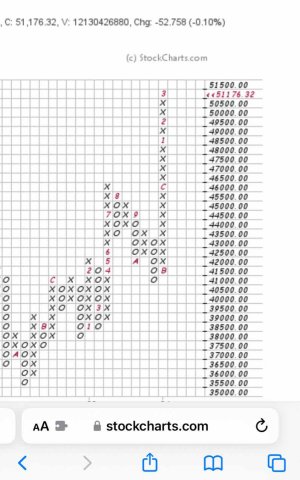
Take a look at that chart, and tell me that you think it will keep going higher..
Maybe a little longer, but not much. 2 weeks? 4? Sell in May and go away is not far off.
I’m thinking I will shift out of stocks and into “G” in a matter of a week or two. I don’t know what the trigger will be- but we are due for a breather sooner rather than later.
I’m staying in right now, but my radar is raising its antenna to be more sensitive and watching closer.
Good luck

Sent from my iPhone using
TSP Talk Forums


