FireWeatherMet
Market Veteran
- Reaction score
- 239
- AutoTracker

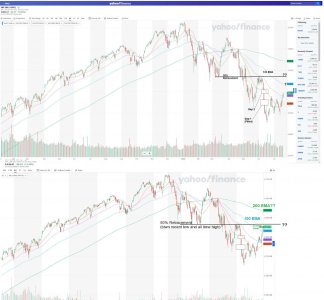
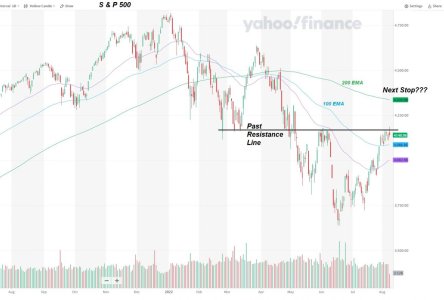
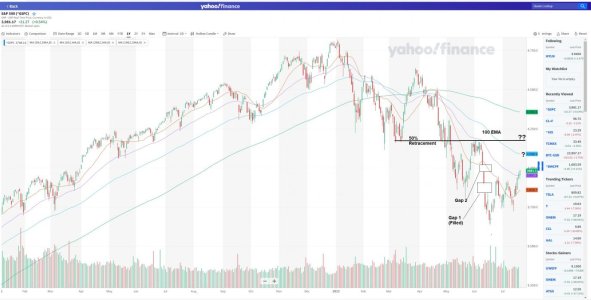
So far so good, after my move back into stocks. I've included the S&P chart (below) to mark out some key indicators for me, and guidance of where to go from here.
On July 7th, I noted that there were 2 "Open Gaps" on the charts (Tom first pointed them out on his daily wrap-ups) and as Tom says...these gaps usually (not always but most of the time) get filled.
I jumped in as the 1st gap was partially filled...and have been eying the 2nd gap that was about 4-5% higher, as the 1st target.
Well, now seems like we pierced the lower portion (as of this writing because things could change into the close), and have another 1% upwards potential to fill this 2nd open gap.
Now the question is...what to do after that?
If we were in a more classic "1-3 week Bear Flag", I would be phasing out and selling now. BUT...we are in a 5 week climb, and still surging upward even today, when there were all the reasons in the world for us to go negative (several huge monster up days that typically result in profit-taking & President getting Covid).
What could be the reasons for this? Well, to borrow the 1992 campaign slogan "Its Inflation, Stupid".
Fear of runaway inflation...sparks fear that the FED will spend years raising rates, trying to get it under control...like the 70s into the early 80's.
That leads to fears of a severe, long lasting recession.
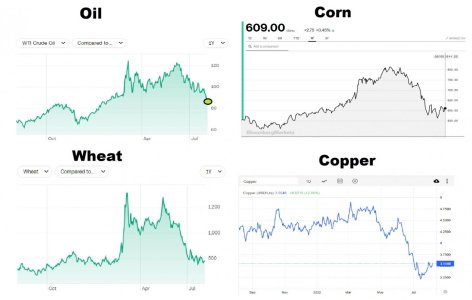
BUT...what's the prime driver of recent inflation? Answer is OIL...along with supply chain issues along with Ukraine War and related energy and food disruptions from that.
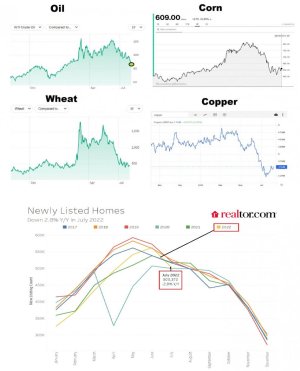
So lets look at the biggest issue...OIL...has dropped suddenly about 25% since its peak in June. Main part is OPEC has decided to produce more, as is the US now, due to increasing embargo restrictions on Russian oil.
We are now seeing prices at the pumps down 30-40 cents/gal from the recent highs. And July 4th is peak summer travel season, and by end of Aug/post Labor Day, pump prices typically drop more significantly.
So...the threat of RISING inflation seems to be over. But by no means are we returning to "Pandemic level" prices, part of those lows was simply because economic conditions were so bad in 2020 into early 2021.
But the market is a forward looking indicator, and it is "thinking" what is inflation going to look like 2-3 months from now? If chances are that inflation stays where it is or starts descending slightly, then its likely the June low was "The Bottom".
Here is some support to that thinking. https://www.marketwatch.com/story/h...rporate-bond-market-11658401317?siteid=yhoof2 From article:
"The S&P 500 has never lost ground over the following year when advancing volume was at least 85% of volume for two out of three days coming off a 52-week low, according to Jason Goepfert, the founder of Sundial Capital Research. That has happened 13 times."
"The signal is incredibly strong on the junk-bond side. In the nine previous times when the CDX HY spreads fell at least 75 basis points in three weeks, the S&P 500 rose over the next week, six months, and year, with 22% average returns over the next year. "
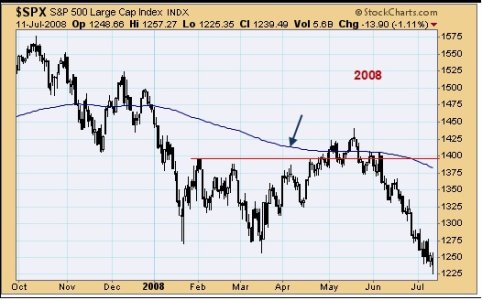
Another thing to consider, even if the June low was not the bottom, nost bear markets tend to have at least a "50%" retracement form the previous lows.
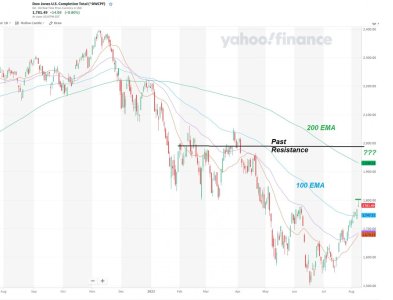
Looking at the S&P chart below, we still have a ways to go, we've surged past the 50 day EMA, and the next target (Oscar Carboni's fav) is the 100 day EMA (light blue line).. Just above that, is the approx "50% retracement". That's another 4-5% upward move, and definitely NOT something you want to miss.
So I'm going to at least consider staying in equites (C/S) until we start approaching those levels, even after the 2nd gap gets filled...but will watch oil prices, the FED, and world events, very carefully in the coming days/weeks/months.

Last edited:

