coolhand's Account Talk

View attachment 48541 View attachment 48542

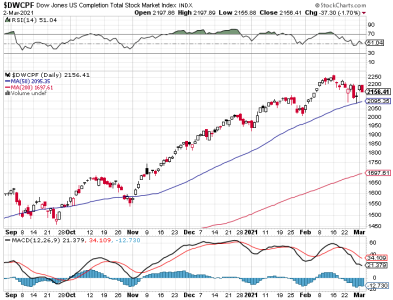
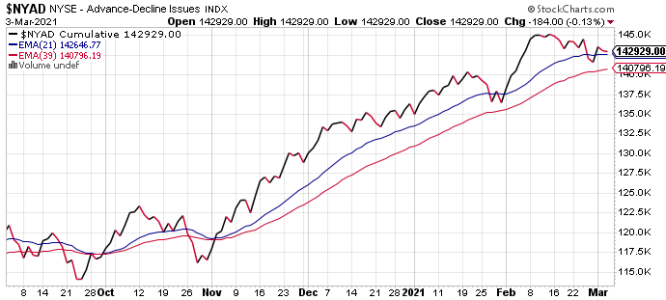
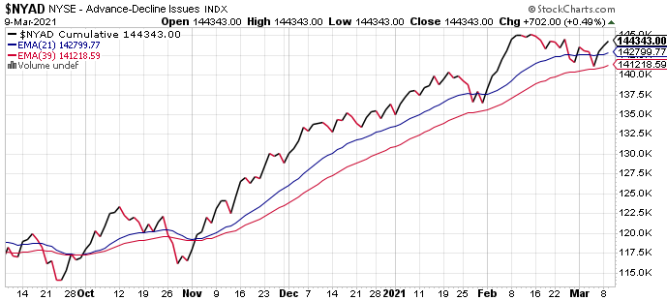
How much does the February 2021 chart look like October 2020 chart? Hoping we have the same kind of rebound as we did in November of 2020 :)

I think it's entirely possible that the market takes off again, but I can't be absolutely sure of it. At least not just yet. I've been watching for "it's different this time", which of course is why I watch the smart money. If price soars to fresh highs we could see another crazy run to the upside.
 
I think it's entirely possible that the market takes off again, but I can't be absolutely sure of it. At least not just yet. I've been watching for "it's different this time", which of course is why I watch the smart money. If price soars to fresh highs we could see another crazy run to the upside.

What propelled November and December was the anticipation, and then the fruition, of the last Covid relief bill passing in December.

What will propel this March climb will be the same- IF the Covid relief bill that passed the House is adopted in the Senate, then we should have a remarkable March and into April.

But if it stalls out, the goose that laid the Golden egg could end up being a cooked goose instead.

Let us hope Congress is able to reach a deal.


Sent from my iPhone using TSP Talk Forums
 
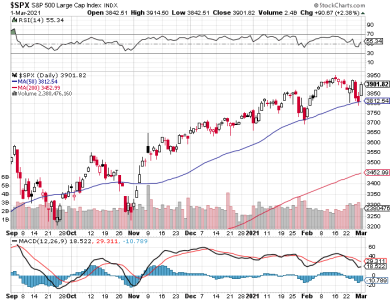
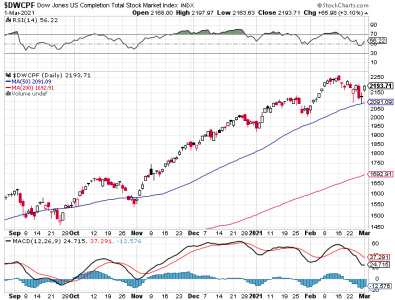
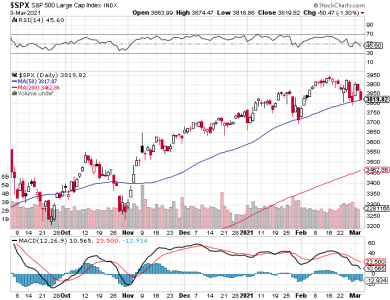
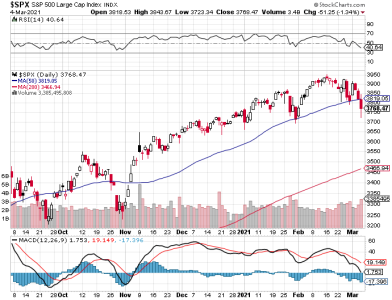
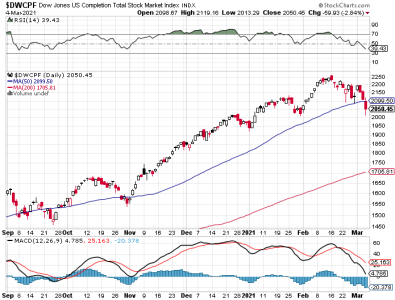
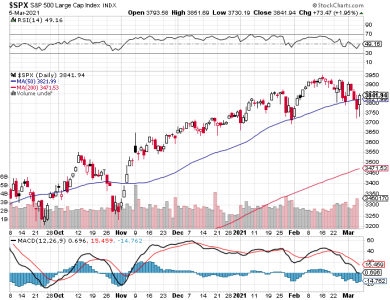
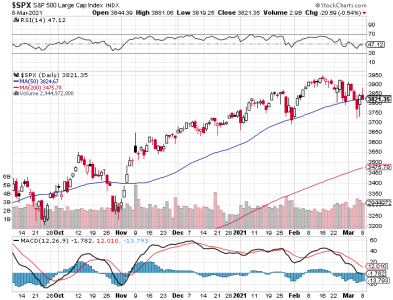
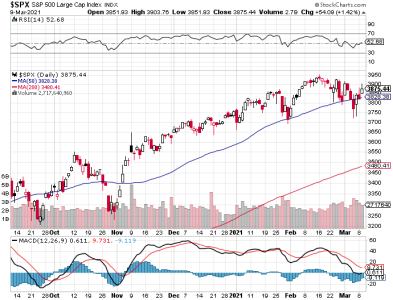
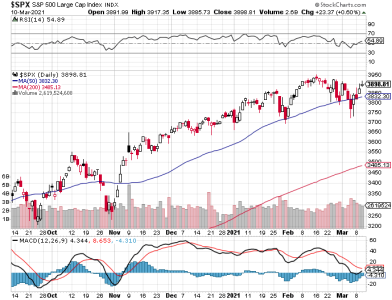
And just like that price is back to resistance, so the volatility remains.

SPX.png
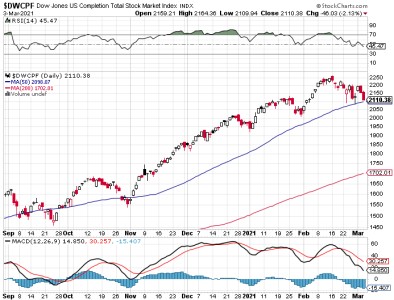
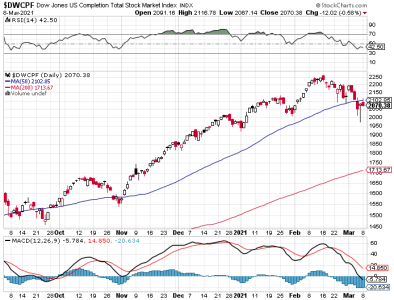
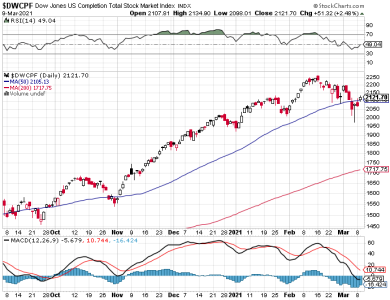
DWCPF.png

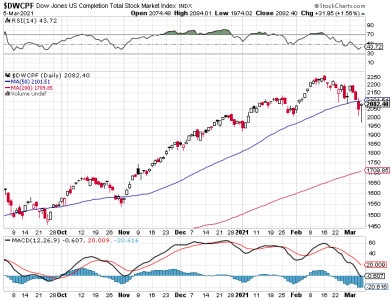
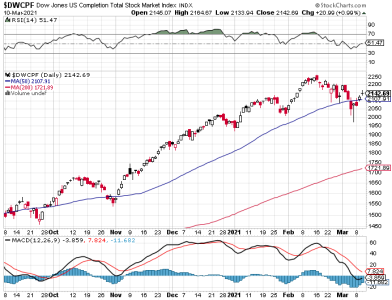
Momentum may be starting to turn. Price certainly bounced hard, but volume was only so-so.

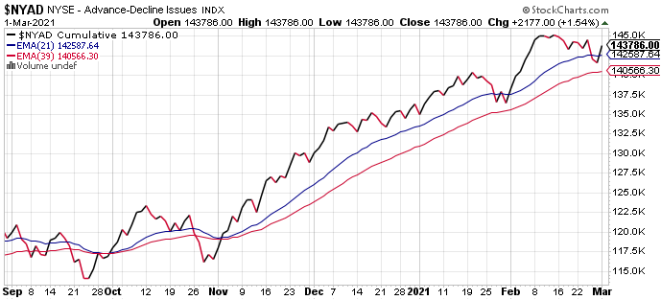
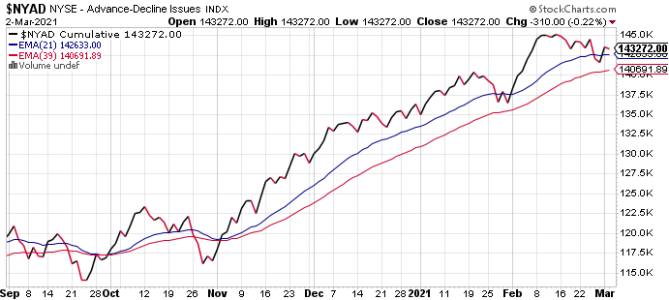
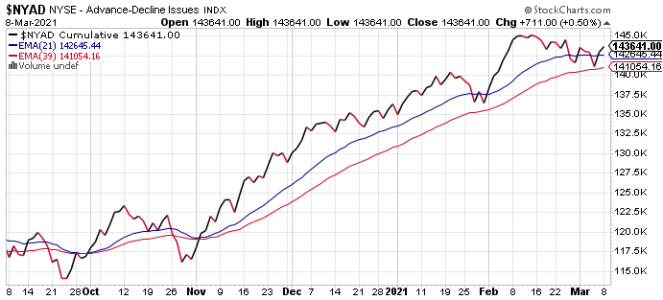
NYAD.png

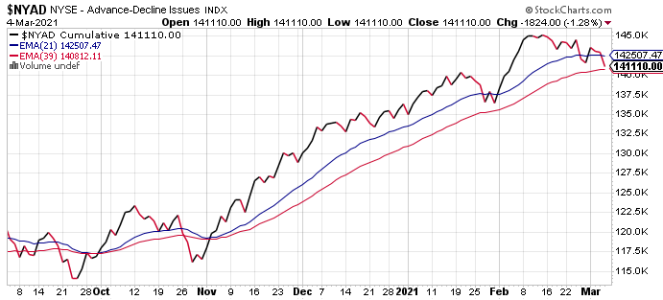
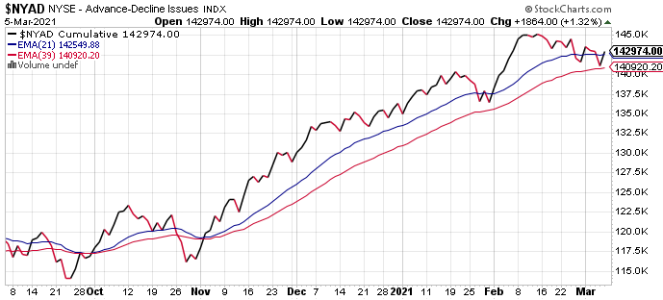
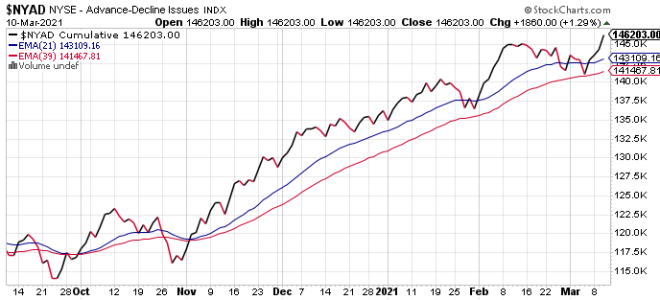
Cumulative breadth bounced back into positive territory. While it may be technically bullish again, it is still in a sideways pattern, so like the stock indexes, it has yet to break out again.

So, we still do not have confirmation of where this market wants to go in the short term. It is still a bull market and the pattern has been fresh highs sooner or later, so maybe that pattern will continue. In the meantime, I remain neutral.
 
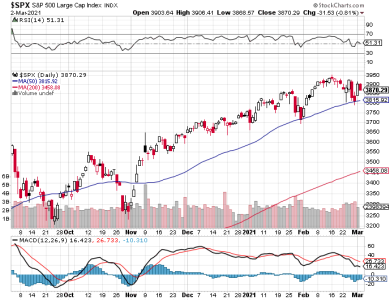
The back and forth action (and volatility) continued today. Price diving into the close certainly doesn't make me bullish for Wednesday.

SPX.png
DWCPF.png

Not much to say about the charts. Price is in a range now between rising support and overhead resistance. I tend to think the action favors the bulls beyond the short term; mainly because it is a bull market and the bears have not been able to do more than moderate short-term damage.

NYAD.png

It's much the same with breadth. It's technically bullish, but moving sideways.

The late day swoon into the close has me thinking we may see another test of the 50 dma soon, though not necessarily. The selling has been more persistent than we've seen in some time, but the bulls have countered much of it to a relative standstill. I'm guessing we will see more of the same tomorrow. I remain neutral.
 
The bears made it 2 in a row on Wednesday as price fell back once again.

SPX.png
DWCPF.png

Support at the 50 dma continues to hold. This is more or less the 3 test of support in this area. Momentum is falling. Volume was on the average side.

NYAD.png

Cumulative breadth, while negative today, wasn't overly negative. The signal did not move lower by much, which is interesting. It's a neutral signal at this point. The 21 EMA is now flat.

Which way will price eventually break? Well, you should generally go with the trend, which means the break is likely to be up.

NAAIM reports tomorrow. I remain neutral.
 
NAAIM is now bearish in the short term. Neutral beyond the next few days unless something changes. I say this because they aren't heavily beared up. But they did get defensive now for the 2nd week in a row. They are now putting on short positions.
 
Has that proverbial 'switch' been flipped?

In February of last year, the selling was more intense. Volume has not been all that robust so far and the bulls have countered much of the selling, but they appear to be losing ground. Right now, the bears appear to have some measure of an advantage, but will the bulls reverse today's selling? There seems to be an attempt right now to bottom the market, but for how long and how much? I can't say a switch has been flipped. However, the NAAIM reading would certainly appear to support more downside pressure in the days ahead. Maybe the switch gets flipped then? Maybe.

I am now short term bearish (from neutral).
 
The bears broke through support today and price closed well under the 50 dma on both charts.

SPX.png
DWCPF.png

We can also see that price closed off the lows of the day. That may not mean much in the context of a bearish NAAIM reading. Momentum accelerated to the downside. Volume was up. I was asked if a switch has been flipped. I was not ready to embrace that notion the way I did over a year ago, but yields are now rising and so is inflation. Those can be switches all by themselves.

NYAD.png

Cumulative breadth fell again and is in a slow downtrend. It hasn't gotten serious, but if the sellers jam the exits it could fall much quicker.

NAAIM came in bearish today; at least in the short term (a week). They are shorting more than they were so I don't think the downside is over.

I am now bearish along with the smart money. The bulls may mount another run to the upside, but momentum now favors the bears. I suspect the bottom is not in and could be several percentage points further down.
 
Friday's market action saw a big intraday reversal that saw price erase all or most of Thursday's losses. The week ended mixed with the S&P posting a decent gain of 0.85%, but the DWCPF falling for a loss of 2.12%.

SPX.png
DWCPF.png

The reversal on Friday shows long tails on the both charts, which may mark a low. Price on the S&P closed back over its 50 dma, while the DWCPF fell a bit short and remains under that key average. Volume was elevated, which may be a tell. Momentum stalled and may be ready to reverse. It's too soon to say in this market, however. It is becoming more deceptive of its intention.

NYAD.png

Cumulative breadth got back over its 21 day EMA, but I'm calling it neutral rather than bullish.

The latest TSP Talk sentiment survey came in neutral for the 2nd week in a row. That isn't far from the NAAIM reading on Thursday, which I called bearish, but not overly so. Getting overly bearish has for years been a prescription for pain in a market bent on rising the majority of the time.

So, the Friday reversal looks promising for the bulls. I was bearish heading into Friday and the reversal has me wondering if the worst is over. I am certainly not ready to get bullish in this market, so I am moving back to a neutral stance until we see whether Friday's action put in a bottom or not.
 
It looked like the bulls were going to have a good day today as the morning session saw nice gains in volatile action. But as noon approached the gains appeared limited. The DWCPF peaked early, while the S&P had more than one peak. Both indexes succumbed to selling pressure in the afternoon session.

SPX.png
DWCPF.png

Price closed for a loss on both charts. Interestingly, price closed pretty much on support at the 50 dma. The DWCPF managed to rise above its 50 dma early in the trading session, but was rejected and closed back under that key average, which now appears to be resistance for that index. Volume was elevated. Momentum fell.

NYAD.png

Cumulative breadth actually remained elevated, but still in a sideways pattern.

So, it's still a mystery of sorts where this market is headed. The DWCPF is struggling more than the S&P, but not by a lot. Volatility remains elevated along with volume. It's still a neutral picture, which also reflects my sentiment.
 
The bulls managed to reverse yesterday's loss, but they didn't make any statements.

SPX.png
DWCPF.png

Price on the DWCPF managed to close above its 50 dma, but not by a lot. It's a bit misleading to look at that chart and then realize that the DWCPF tacked on gains of about 2.5%. That certainly shows us how far from the top it remains. Price on the S&P bounced off its 50 dma (after closing right on it yesterday). The market did fade at the end of the day, but it was more pronounced on the DOW than either the DWCPF or the S&P. Volume has been steadily falling the past few trading days, but still remains a bit above average (imo). Momentum is trying to turn again.

NYAD.png

Cumulative breadth, while certainly not off to the races, has been eking out gains, but has yet to break out of its range.

So, the market remains in no-mans land for the moment. The bulls appear to have the advantage (long term trend and price above the 50 dma), but that could change quickly. Volatility is settling out too and that may help the bullish case.

I still can't get bullish, however. I remain neutral.
 
The market gapped higher at the open today and bulls fought to maintain the gains in a choppy trading session.

SPX.png
DWCPF.png

Overhead resistance remains an obstacle on both charts, but there are some promising signs for the bulls. Momentum has turned up after a lengthy decline. Volume has been slowly diminishing, which also speaks to the lessening of volatility. Price still has to cut through resistance and post fresh gains, but at least there are signs that the market is moving in that direction.

NYAD.png

I find it very noteworthy that cumulative breadth hit a fresh all-time high today. Is this a early warning to the bears? We'll see.

NAAIM reports tomorrow. It will be interesting to see if they remain cautious. I remain neutral, but I may not be far off from going bullish. NAAIM may (or may not) convince me when we get the latest reading.
 
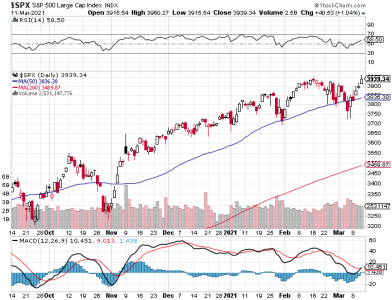
Yesterday, I said that there were promising signs that the market was beginning to gather some bullish momentum (in so many words). I cautioned that resistance was still overhead, but there were indicators that were becoming more favorable to the bulls.
SPX.png
DWCPF.png

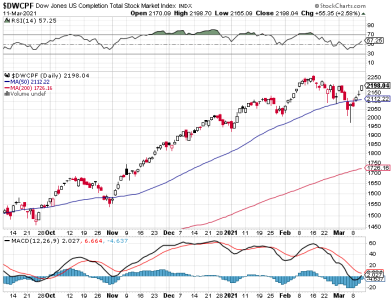
Price rose on both charts today. The S&P 500 closed at an all-time high, but also closed well off its high of the day. Price on the DWCPF also had a good, but is still well off its all-time high. Momentum continues to rise on both charts. Volume is about normal now.
NYAD.png

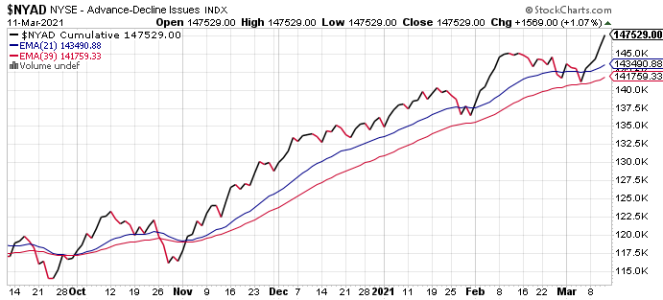
Breadth is looking flat-out bullish once again. It's rising quickly.

All of this is looking pretty good for the bulls, but the smart money (NAAIM) got more defensive and is now leaning bearish. The preliminary TSP Talk Sentiment survey was very bulled, but the official reading has not been released as yet. Both readings are obviously at odds. Recently, I sided with NAAIM when both surveys were opposite another and TSP won.

I have to say that while I normally do not bet against NAAIM, I also know that they don't always get it right (just most of the time). Now, keep in mind that the TSP survey may come in over-the-top bullish and that may be a problem.

So, it's decision time. There are reasons to buy this market right now, but I'd not be complacent about it.

I am going from neutral to modestly bullish.
 
Back
Top