coolhand's Account Talk

Isn't it interesting that a market that supposedly has zero sideline money keeps finding a way to power higher? And that the smart money has been aligned with this? NAAIM is not a contrarian indicator. I've said this several times. No, like all indicators it isn't perfect, but the last time I checked on Ebay there were no crystal balls for sale (functional). NAAIM tends to be right much more often than not. Especially on timelines longer than a week.

Also, the central bank is not limited to the amount of fiat creation ever since Nixon took the dollar off the gold standard. That means very few of us around today have participated in a market that was at least somewhat sound up until that time. That change was enacted in August 1971. FDR also took us off the standard for a time back in June of 1933. A bank that can print to infinity does not run out of money unless they desire such.

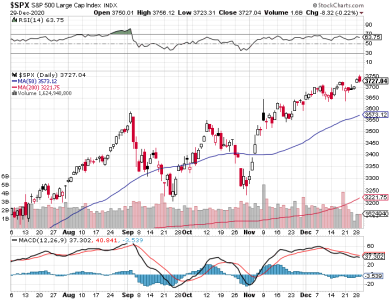
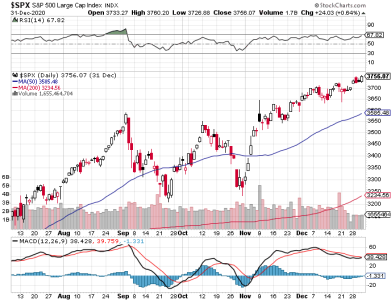
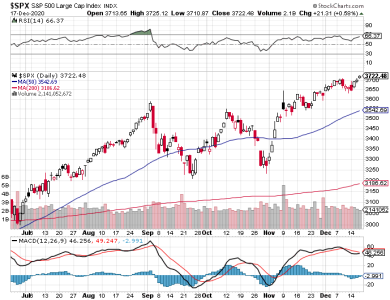
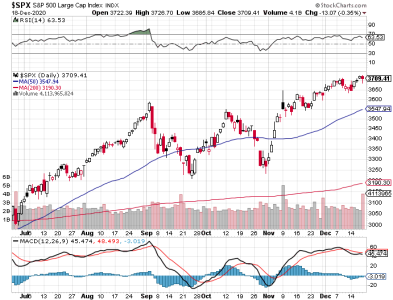
I was asked yesterday if the S&P would make a new high by next week and I said that it was highly likely if NAAIM remained bullish that it would do so perhaps even sooner. And just 24 hours later we have a new high on that index.
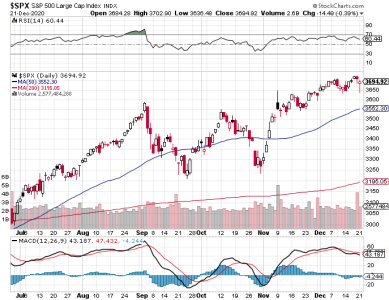
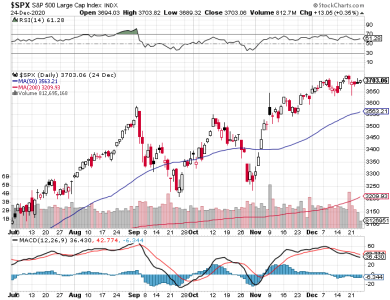
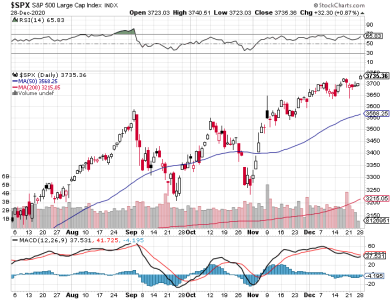
SPX.png
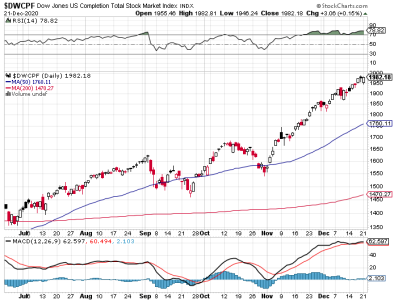
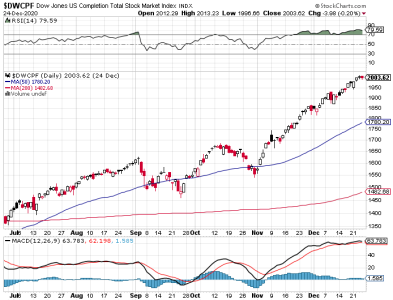
DWCPF.png

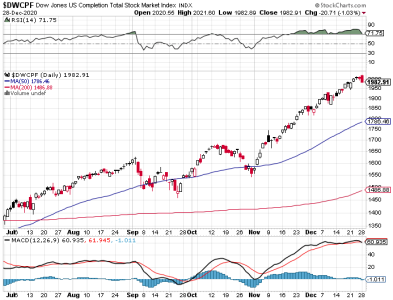
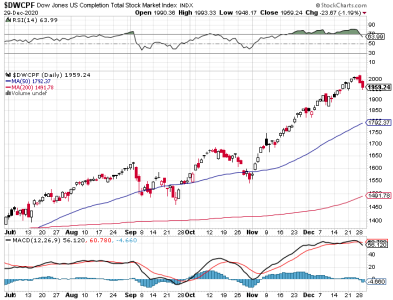
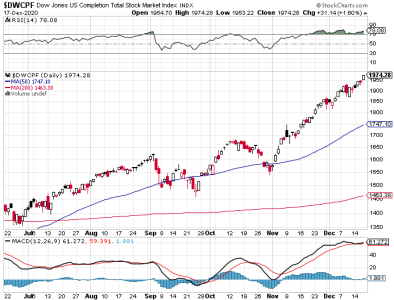
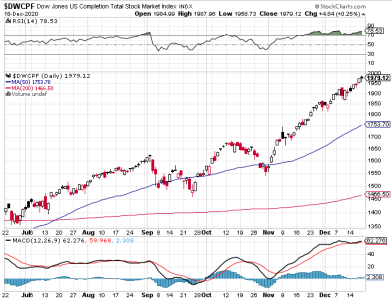
Aside from being extended, these charts are bullish. I said more than a month ago that this market had a good chance of getting silly to the upside. Was I wrong?
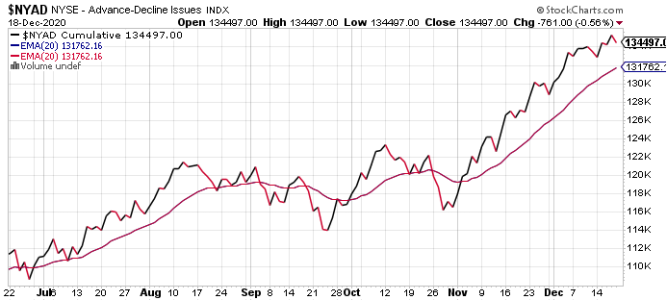
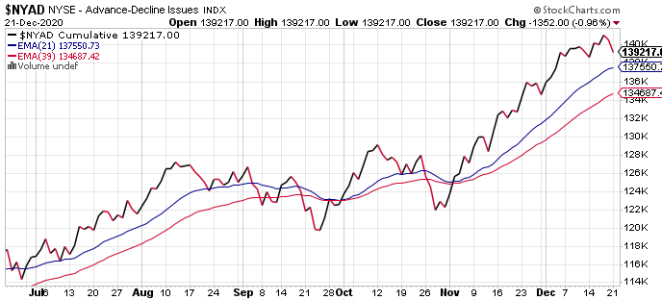
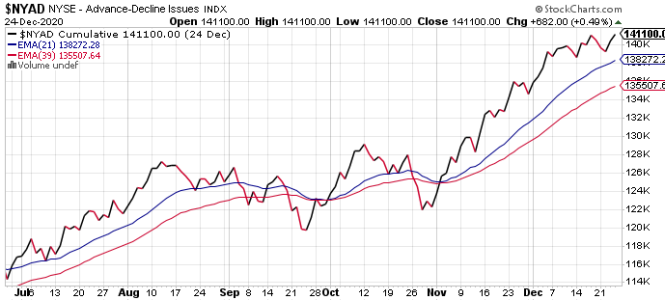
NYAD.png

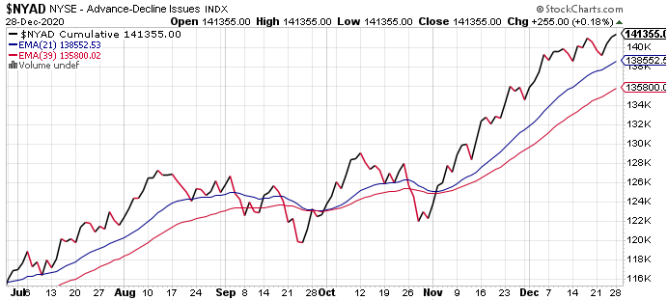
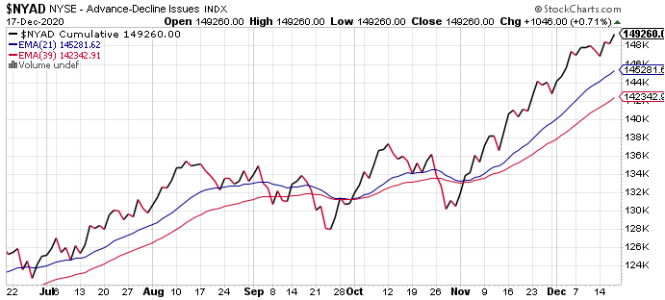
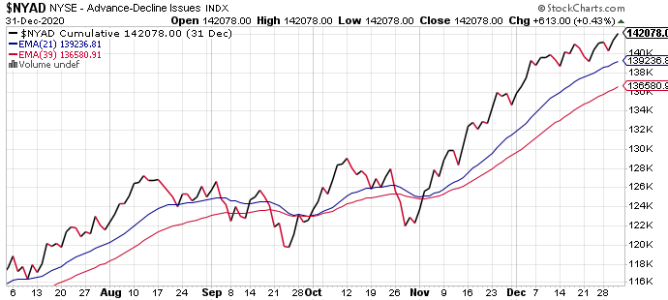
Here's another silly chart getting even sillier.

NAAIM is not my only indicator. It's just one that I trust more than most. And they are bulled up again.

I remain bullish.
 
Isn't it interesting that a market that supposedly has zero sideline money keeps finding a way to power higher? And that the smart money has been aligned with this? NAAIM is not a contrarian indicator. I've said this several times. No, like all indicators it isn't perfect, but the last time I checked on Ebay there were no crystal balls for sale (functional). NAAIM tends to be right much more often than not. Especially on timelines longer than a week.

Also, the central bank is not limited to the amount of fiat creation ever since Nixon took the dollar off the gold standard. That means very few of us around today have participated in a market that was at least somewhat sound up until that time. That change was enacted in August 1971. FDR also took us off the standard for a time back in June of 1933. A bank that can print to infinity does not run out of money unless they desire such.

I was asked yesterday if the S&P would make a new high by next week and I said that it was highly likely if NAAIM remained bullish that it would do so perhaps even sooner. And just 24 hours later we have a new high on that index.

View attachment 48005
View attachment 48004

Aside from being extended, these charts are bullish. I said more than a month ago that this market had a good chance of getting silly to the upside. Was I wrong?

View attachment 48006

Here's another silly chart getting even sillier.

NAAIM is not my only indicator. It's just one that I trust more than most. And they are bulled up again.

I remain bullish.
Appreciate your daily posts very much coolhand! Thank you! Happy holidays!

Sent from my SM-G955U using Tapatalk
 
Isn't it interesting that a market that supposedly has zero sideline money keeps finding a way to power higher? And that the smart money has been aligned with this? NAAIM is not a contrarian indicator. I've said this several times. No, like all indicators it isn't perfect, but the last time I checked on Ebay there were no crystal balls for sale (functional). NAAIM tends to be right much more often than not. Especially on timelines longer than a week.

Also, the central bank is not limited to the amount of fiat creation ever since Nixon took the dollar off the gold standard. That means very few of us around today have participated in a market that was at least somewhat sound up until that time. That change was enacted in August 1971. FDR also took us off the standard for a time back in June of 1933. A bank that can print to infinity does not run out of money unless they desire such.

I was asked yesterday if the S&P would make a new high by next week and I said that it was highly likely if NAAIM remained bullish that it would do so perhaps even sooner. And just 24 hours later we have a new high on that index.

View attachment 48005
View attachment 48004

Aside from being extended, these charts are bullish. I said more than a month ago that this market had a good chance of getting silly to the upside. Was I wrong?

View attachment 48006

Here's another silly chart getting even sillier.

NAAIM is not my only indicator. It's just one that I trust more than most. And they are bulled up again.

I remain bullish.
What other overbought indicators do most investors use that’s effective? I am still learning, thank you.
 
What other overbought indicators do most investors use that’s effective? I am still learning, thank you.

I'm not sure I fully understand what you are asking. Overbought is a condition that can be determined in many ways. Bollinger Bands are good. RSI (relative strength indicator), which I use on my charts is also popular. There are others. If you haven't been to stockcharts yet, here is a link to their education area.

https://school.stockcharts.com/doku.php

You can explore many topics related to technical analysis here. It can be overwhelming. The reality is that you don't need a ton of indicators. Many pros use only a handful, but analysis often goes beyond the technical indicators themselves. It also helps to get familiar with sentiment. I also read the Creature From Jekyll Island, which explains how the central banking system really operates. That book is not light reading and it isn't pleasant (after you get about halfway into it). What it does do, is give you perspective that can't be learned in most education programs. There's "how we are told things work", and then there's "how things really work." That's what this book helps the reader understand.
 
I think you recently said the next step after sillier is insane. I think we are there but it may take a little while for them to roundup the crazies and restore order to the asylum, so I am going to run around crazy with them until that happens. Good luck to all.

Aside from being extended, these charts are bullish. I said more than a month ago that this market had a good chance of getting silly to the upside. Was I wrong?

NAAIM is not my only indicator. It's just one that I trust more than most. And they are bulled up again.

I remain bullish.
 
Coolhand, I look forward to your daily posts as the day gets light here in the dark morning of Alaska...what do you do with a quadruple witching day and index balancing if anything? or is it too short of timeframe?Also do you do anything with the Bollinger bands on various indexes and stochastics senn in Ira Epsteins videos that nnut posts? thanks
 
Coolhand, I look forward to your daily posts as the day gets light here in the dark morning of Alaska...what do you do with a quadruple witching day and index balancing if anything? or is it too short of timeframe?Also do you do anything with the Bollinger bands on various indexes and stochastics senn in Ira Epsteins videos that nnut posts? thanks

There are many indicators that I no longer use. I used to use Bollinger Bands, but not anymore. There isn't anything wrong with them, but they are somewhat subjective like many indicators because a stretched market is stretched by many technical measures. As many of us realize, the market doesn't always conform to our expectations. Remember that I warned a few weeks ago about the DWCPF being overbought, but not to get bearish on this because it wasn't a particularly visible index and the S&P (a very visible index) was well away from being overbought itself. So I used observations from outside the DWCPF to make a judgement call on how to handle that index's (DWCPF) overbought RSI. We now see that this index has been overbought for just about a month.

Quadruple witching days simply mean that volatility is possible. Or a big move in either direction is possible. It's not a normal trading day. For us in TSP, it's not something we can generally use in any meaningful way unless there are other indicators supporting a given scenario.

I know I am always mentioning NAAIM, but we need to stop and think what smart money really means. It means a number of things; not just smart traders. When you follow a group like NAAIM we need to recognize that their collective positioning is based on many different kinds of technical analysis as well as inside information. These are proven performers or they wouldn't be in their money management positions. I don't think many less experienced (or even more experienced) traders realize how much of an advantage you can have by giving a group like NAAIM more than just token respect. I learned about this group from a Wall Street Pro who understood this very thing. Let the smart money do some of the heavy technical lifting.
 
Last edited:
The S&P 500 and DWCPF both had great weeks last week, but the DWCPF far exceeded the gains of the S&P. Friday's action was another mixed bag with the S&P pulling back moderately and the DWCPF posting a modest gain.

We now enter a new week with bullish seasonality and bullish smart money.

SPX.png
DWCPF.png

Nothing new to talk about with these charts. The S&P is trending higher, but at a slower pace than the DWCPF.

NYAD.png

Cumulative breadth remains bullish after a modest pullback on Friday.

TSP Talk sentiment came in very heavily bulled up. We are now more aligned with the NAAIM sentiment and have seasonality in our favor. I'm sure it makes some of you nervous just the same (if you're long).

I remain bullish.
 
Just a few days ago I said "Someone wants this market higher and NAAIM knew it."

Today is one of those days that makes it fairly obvious that this is indeed the case. I won't be surprised if we close positive, but let's see how it goes.
 
The bears made an attempt to take the market down today, but it was quickly countered by the bulls. Price bottomed after the 1st hour and recovered to close mixed on the day.

SPX.png
DWCPF.png

There isn't anything particularly notable on the charts today. Volume was actually average given the holiday week. Normally, I'd expect less volume. Momentum is still negative on the S&P, but price remains not far from the peak.

NYAD.png

Breadth was not impressive, but the chart is still bullish.

I remain bullish.
I am going to be away from my computer the rest of this week, so I won't be posting for a few days. Have a safe and joyful Christmas!
 
The holiday shortened week last week was mixed with the S&P closing out the week with a modest loss, but the DWCPF ending the week with a gain of over 1%.

SPX.png
DWCPF.png

Still no changes overall to the charts. Both remain bullish, but as has been the case for some time now, the DWCPF continues to lead the S&P.

NYAD.png

Cumulative breadth remains bullish.

NAAIM came in bullish again, but not as bullish as previous weeks. Still, the difference is not meaningful. TSP Talk came in bullish as well, but not as much as last week.

Futures are rising this evening. The indicators tell me to remain bullish. Seasonality still favors the bulls.
 
Once again, the market closed mixed on the trading day. Mixed closes seem to be getting almost routine.

But this time, instead of the DWCPF leading the S&P, it was the other way around. The S&P closed almost 1% higher, while the DWCPF closed about 1% lower.

SPX.png
DWCPF.png

Price on the S&P closed at another all-time high. Price on the DWCPF gave up come recent gains.

NYAD.png

Cumulative breadth ticked a bit higher and remains bullish.

Well, is market character about to change? We are winding down the year (and quarter) so it's possible that portfolios are shifting.

Be that as it may, it isn't bearish at face value. Overall, the indicators remain up and I remain bullish.
 
The last trading week of the year is seeing what appears to be profit taking and tax shifting as we wind down 2020.

SPX.png
DWCPF.png

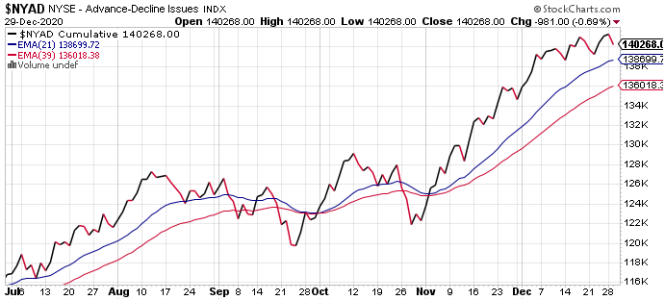
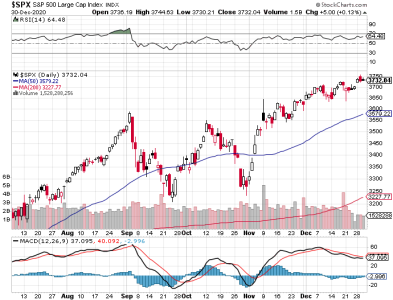
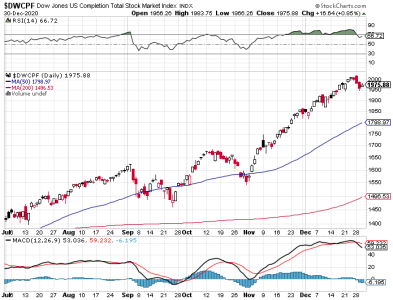
Both the S&P and DWCPF were lower today. Notably, the S&P was hitting fresh all-time highs early in the trading session, but could not hold those gains. The DWCPF went lower quicker than the S&P. It was more like a bear ambush within minutes of the open. Still, the technical damage is limited to this point. The S&P doesn't have any technical damage to speak of, but the DWCPF shows momentum going negative, which is obviously bearish. However, RSI has finally fallen out of overbought territory after spending more than 5 weeks in that area. The question is, how much more selling might we see? I suspect we might get another couple of days worth and then things may change next week, but I'll know more when we get a fresh NAAIM reading.

NYAD.png

Cumulative breadth took a hit, but is still technically bullish.

Despite the selling pressure, there is nothing particularly abnormal as far as market action goes. Especially as we wind the down the year and quarter. It's also not a surprise given how far the indexes have gone; especially the DWCPF.

It is too soon to get bearish on the action as it may be short term. NAAIM will tell us more about risk in another couple of days. For now, I remain bullish.
 
The market bounced back on Wednesday with both the S&P and DWCPF closing with gains.

SPX.png
DWCPF.png

It's nothing to write home about, but at least it breaks the string of losses on the DWCPF. Volume remains low, which is understandable at this time of the year.

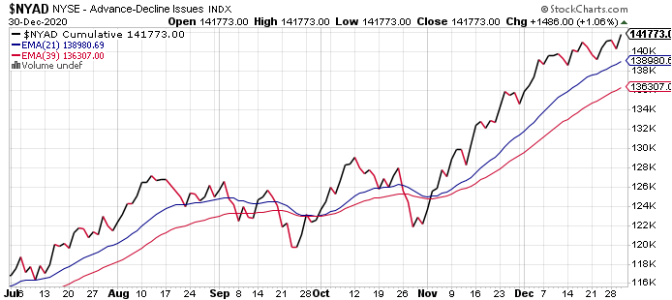
NYAD.png

Breadth recovered nicely and is sporting a fresh all-time high.

We get a fresh NAAIM reading tomorrow. As always that reading will help frame expectations heading into next week.

I remain bullish.
 
For the 2nd week in a row, NAAIM has come in a bit less bullish. The reading is still bullish overall, however. So, they are tempering bullish expectations, but not by a ton. It could be profit taking and then waiting to see how the new year shapes up in January. It could be tax positioning too. It could be both or something else. But the bottom line is that the signal is still bullish, just less so.
 
What NAAIM number (or range) is the breaking point from bullish to bearish? Other than the March/April 2020 timeframe, the NAAIM has not been below 50 in the past two years. After 5 weeks above 100, I see the drop to 89 and then 82 as a somewhat significant shift in position, no?
 
What NAAIM number (or range) is the breaking point from bullish to bearish? Other than the March/April 2020 timeframe, the NAAIM has not been below 50 in the past two years. After 5 weeks above 100, I see the drop to 89 and then 82 as a somewhat significant shift in position, no?


CH can probably expound on it...but I view NAAIM as a sentiment, put into statistical form, of risk managers. Here is a chart showing the past 2 years NAAIM. https://www.naaim.org/programs/naaim-exposure-index/

and here is a link to a page explaining NAAIM that I read up on a few years ago (shortly after I knew NAAIM existed). https://seekingalpha.com/article/3993108-sentiment-bullish-institutions-versus-bearish-individuals
 
Last edited:
What NAAIM number (or range) is the breaking point from bullish to bearish? Other than the March/April 2020 timeframe, the NAAIM has not been below 50 in the past two years. After 5 weeks above 100, I see the drop to 89 and then 82 as a somewhat significant shift in position, no?

It's important to understand that when observing the NAAIM info that the site does not explain exactly what the numbers mean (how high they can go, or how low, etc.). From experience, I see a reading of 60 as neutral (give or take). Anything above that number gets progressively more bullish and lower gets more bearish. Using this guideline has worked well for me.
 
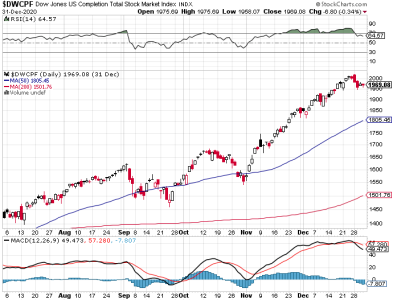
Last week saw somewhat of a reversal of fortune between the S&P and the DWCPF. For the week, the S&P was up more than 1%, while the DWCPF was down more than 1%. What do we make of that? I can't read much into it given that last week was the last trading week of year and the quarter. Now we start a new year and a new quarter.

Friday's action was modestly negative for both indexes, but the yearly gains were impressive; especially for the DWCPF, which was up more than 31%.

SPX.png
DWCPF.png

Price on the S&P closed out the year at a fresh all-time high, while the price on the DWCPF is off of its all-time high, but that by all that much. Both charts remain bullish, but the S&P has an improved technical aspect. I can't read too much into that either so I'll have to wait to see how market character shapes up as we move through January.

NYAD.png

Cumulative breadth remains bullish as we head into the new year.

NAAIM is bullish (moderately) for the new week. TSP Talk came in neutral.

As January goes, so goes the year is an often quoted axiom among traders. I remain bullish as we head into the new trading year.
 
Back
Top