coolhand's Account Talk

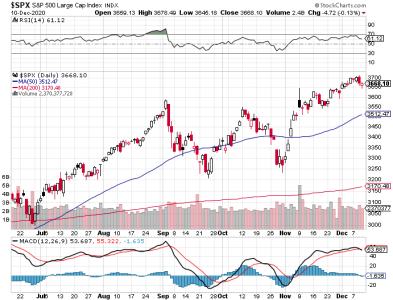
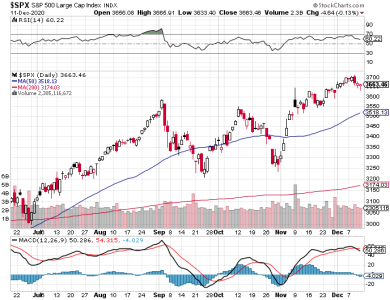
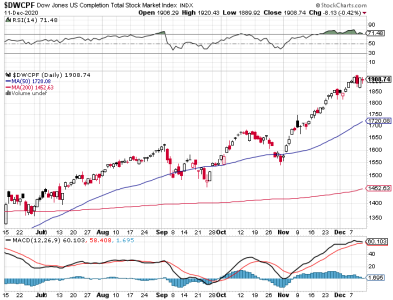
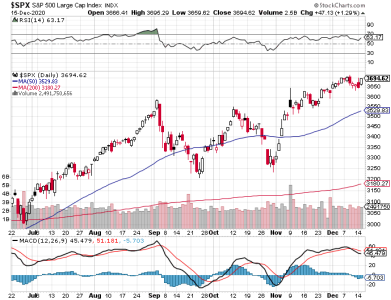
The market finally saw some selling today, which was needed to consolidate gains and work off the overbought nature of some parts of the market.
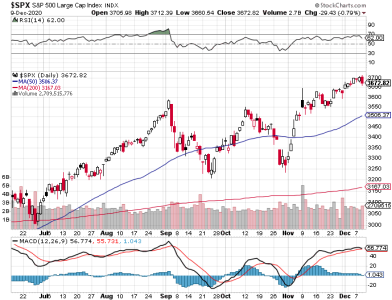
S&P 500.png
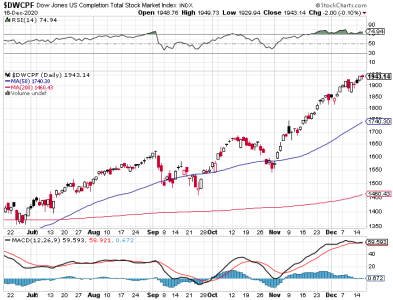
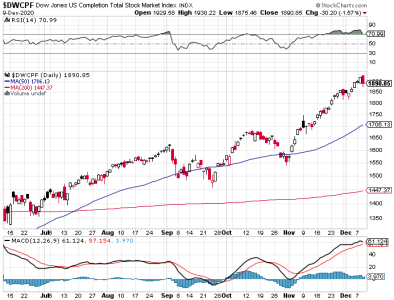
DWCPF.png

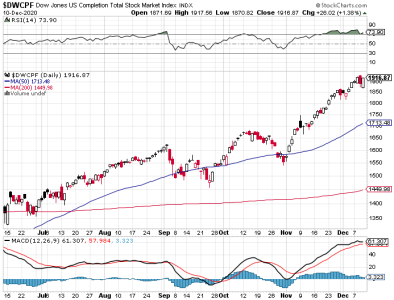
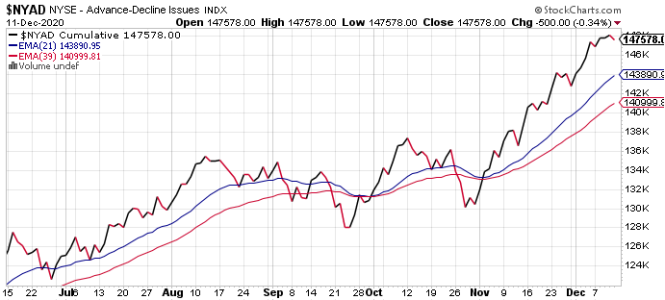
No technical damage yet, and we can see that RSI is still overbought on the DWCPF, but any more selling will likely take the DWCPF out of overbought territory. Momentum turned down, but remains bullish for now.
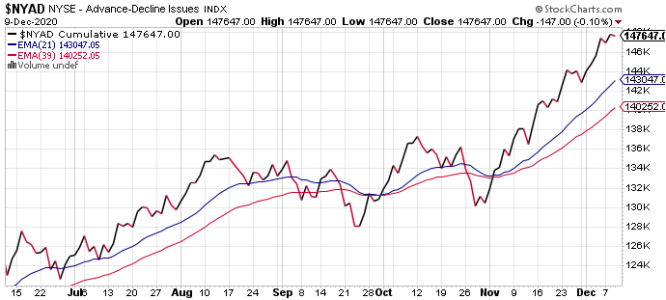
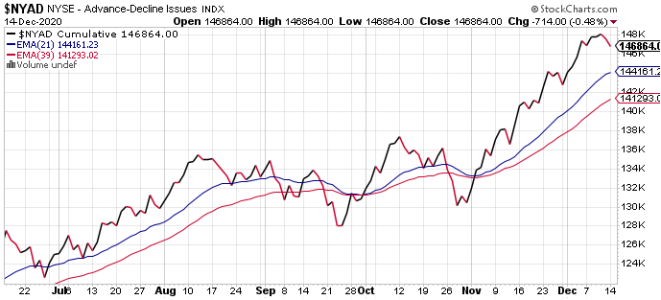
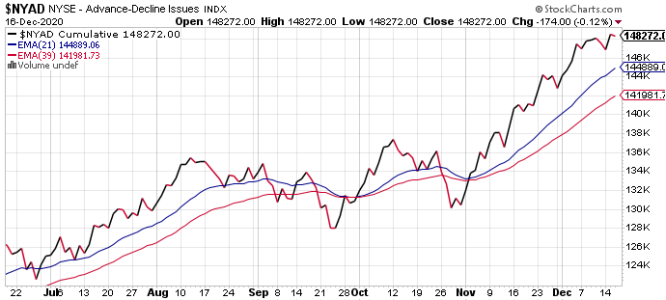
NYAD.png

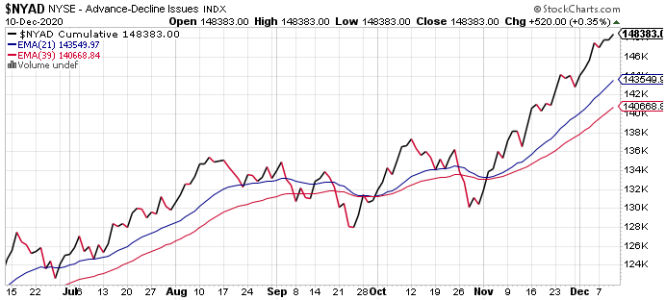
Cumulative breadth dipped, but only a bit. It still remains very bullish.

We get a fresh NAAIM reading tomorrow. I remain bullish.
 
NAAIM came in unchanged. That means they remained very bullish. I expect that once the current consolidation period is over the market will likely move to new highs.
 
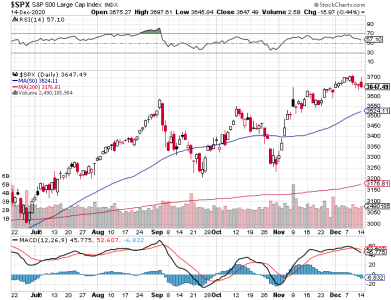
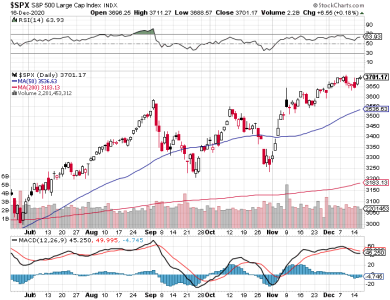
Thursday's trading saw small caps snap back from Wednesday losses to post solid gains. They didn't quite erase all of the losses, but they did get most of it back. The S&P 500 struggled all day and ended the session near the neutral line.

S&P 500.png
DWCPF.png

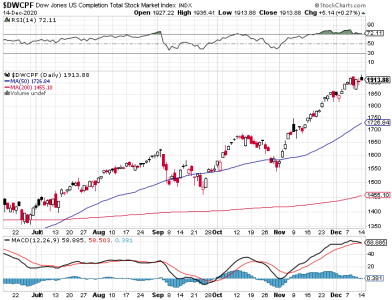
Both charts remain bullish. Upside momentum has fallen off, but price remains not far off its peak.

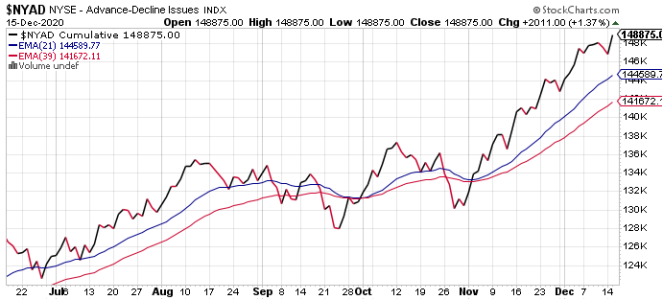
NYAD.png

Cumulative breadth continues to impress and remains bullish.

NAAIM came in solidly bullish for the 5th week in a row. Remember, this is smart money. When they are leaning hard in a given direction you don't want to go the other way (generally). I find this group of money managers to be very consistent overall in their weekly positioning (high accuracy).

So, now that NAAIM has given us a fresh (bullish) reading, I can confidently remain bullish.
 
The market closed mixed on the week last week, with the S fund up moderately and the C fund down moderately. What is notable is that the bears did not take advantage of the somewhat flat trading environment.

S&P 500.png
DWCPF.png

Friday saw the S&P and DWCPF close on a down note, but the charts remain bullish. Momentum has actually gone negative on the S&P, while flat on the DWCPF.

NYAD.png

Cumulative breadth dipped Friday, but no one can deny the bullish nature of this chart.

The TSP Talk sentiment came in bullish once more, but not overly so. NAAIM remained bulled up for 5 weeks straight.

I see nothing of significance in the readings to suggest the bull party is rolling over. I remain bullish.
 
The market started out hot at the open, but peaked after an hour and began to slowly give back its gains all the way into the close. But it was still a mixed close with the DWCPF closing positive, while the S&P had a negative close. If this is what selling pressure looks like, the bulls will take it.

S&P 500.png
DWCPF.png

No serious damage to the charts, but the S&P is the decidedly weaker index. And it isn't in bad shape to this point at all. Momentum has turned down on both charts.

NYAD.png

Cumulative breadth was weak again, but remains bulish.

So, it appears we're seeing a rough patch in the market that's been controlled (so far). With a bullish NAAIM reading from late last week, I don't expect to see much downside damage. In fact, risk does still remain to the upside.

I remain bullish.
 
What comes after silly? Insane? :smile:

I've been saying for a few weeks now that this market could get silly to the upside and that even the bulls may be shaking their heads at some point. I saw this coming, though I don't make predictions. I just share my expectations based on what I'm looking at. My perspective is shaped by more than just the elements you read in my commentary.

So, just when many were thinking market exhaustion, boom!; we get another push to the upside.

SPX.png
DWCPF.png

Price on the DWCPF hit and closed at another all-time high today. And momentum is flat. But price is what matters most. Notice how long now that RSI has been buried in overbought territory. The S&P rallied as well, but did not hit a new high. However, it's not far from it. Is momentum starting to turn back up? What if it does? How many points might that be good for? I'm just musing. As long as the DWCPF continues to fly, the S&P, while lagging, will likely follow.

NYAD.png

Cumulative breadth gave us another all-time high as well. Probably one of the most impressive ramps I've seen on this chart.

I still see no reason to get bearish. Someone wants this market higher and NAAIM knew it.

I remain bullish.
 
Another mixed close, but price didn't move far from the neutral line on either the S&P or the DWCPF.

SPX.png
DWCPF.png

No change to the charts. They remain bullish, though the S&P needs to push past its high from last week.

NYAD.png

Cumulative breadth dipped modestly, but remains bullish.

Not much else to add this evening. NAAIM reports tomorrow.

I remain bullish.
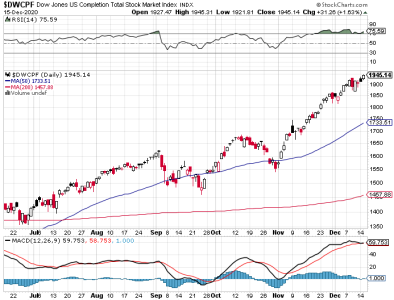
 
Will sp500 make break out by next week? Rhetorical question.

It's poised to break out to the upside once again. Given that the DWCPF keeps hitting fresh all-time highs, I strongly suspect that the S&P 500 will continue to follow. Let's see where NAAIM stands tomorrow. If they remain bulled up, we are likely to see the S&P hit a fresh high by next week or sooner.
 
I agree and with the addition of Tesla we are poised for a breakout, we are embedded on a weekly basis in spy, we are embedding on the daily basis; all signals go for a breakout.
 
Watch the Bollinger band on a DAILY basis for CLOSING; retrospectively before the rug was pulled out we broke above the Bollinger band on a daily basis a selloff occurred soon thereafter it is the canary in the coal mine. Actually, if you look back before the COVID selloff, we closed above it. Most recently, look back at September 02 and October 12, 2020 you will see where it broke above and closed above the Bollinger Band on those dates and you can see the subsequent selloff. Does it work every time, no, but it is a strong indicator to watch for to protect capital.
 
Watch the Bollinger band on a DAILY basis for CLOSING; retrospectively before the rug was pulled out we broke above the Bollinger band on a daily basis a selloff occurred soon thereafter it is the canary in the coal mine. Actually, if you look back before the COVID selloff, we closed above it. Most recently, look back at September 02 and October 12, 2020 you will see where it broke above and closed above the Bollinger Band on those dates and you can see the subsequent selloff. Does it work every time, no, but it is a strong indicator to watch for to protect capital.

Very good insight, thank you.
 
We are witnessing a global financial shift, the likes of which has not been seen before. I am wary of using too many indicators that are based on historical "norms". I know how to use many of them, but I've seen too many "back-tested" systems fail over the past few years to remain comfortable with them. That is a general comment and not directed to any system in particular. However, the Seven Sentinels system that I posted on for quite some time in the past are one of those systems that worked very well in its day, but then became more of a liability later on. I've learned from Wall Street pros, many of whom did not recognize how much HFT and algorithms were steadily reshaping the markets. The market is more than 70% computerized now. Much of it is now controlled by AI. It's a shifting landscape over time.

There are geopolitical reasons for what we are seeing too, but I can't go into that because it will ruffle feathers.
 
With respect to my last post, I should also add that this is another reason I prefer to follow NAAIM, because they appear to understand this landscape fairly well.
 
And the NAAIM came in bullish again so they are seeing the same things, I think.

NAAIM was below 25 for five weeks in March - April and turned out to be the buying opportunity everyone missed.

It's been over 100 for the past five weeks which means there is zero money on the sidelines to cushion the next inevitable drop.
 
Back
Top