coolhand's Account Talk

I would like to start out today's commentary by quoting something I said yesterday as follows:

"...there is a lot happening in the financial system and I doubt many money managers are comfortable right now regardless of their sentiment. It just isn't business as usual."

Why am I pointing this out?

I suspect most or at least many of you saw what happened in the oil sector today. A historic plunge to negative prices occurred. That is a first. I can't help but think a fuse of some sort has now been lit.

Is this why NAAIM isn't embracing the rally? I won't speculate on the fallout because I suspect that the expected ramifications of such an occurrence may not manifest the way many money professionals may think.

For now, let's just say that this event could make the rest of this week very interesting in financial markets.
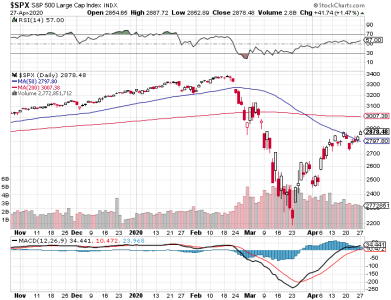
S&P 500.png
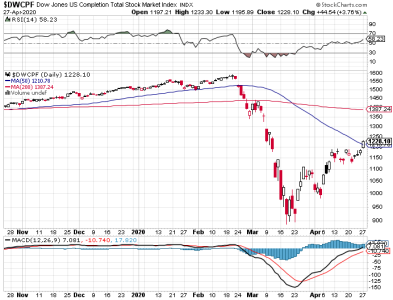
DWCPF.png

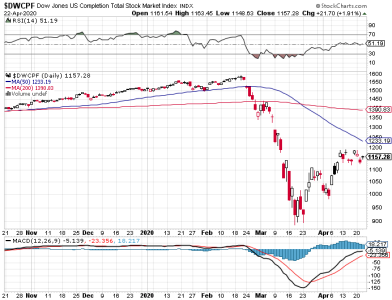
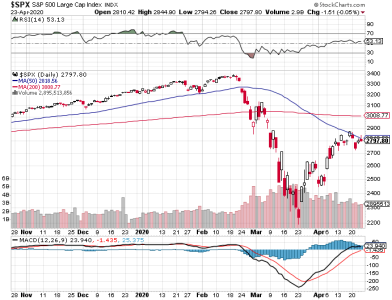
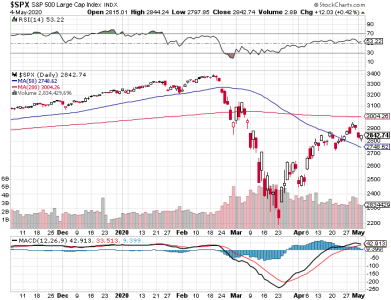
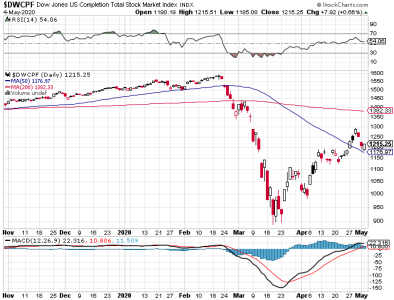
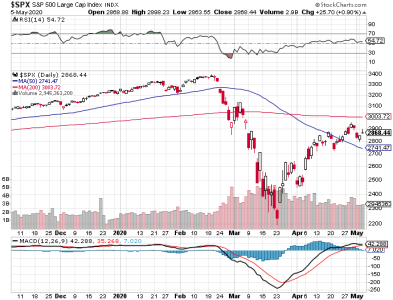
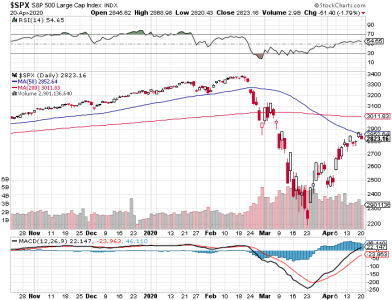
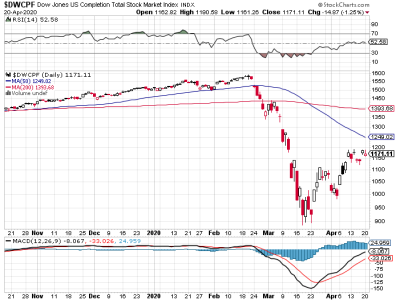
Looking at the charts, you'd never know something major occurred as price, which did go negative today, merely gave back a portion of last week's gains, and that isn't unexpected or unusual.
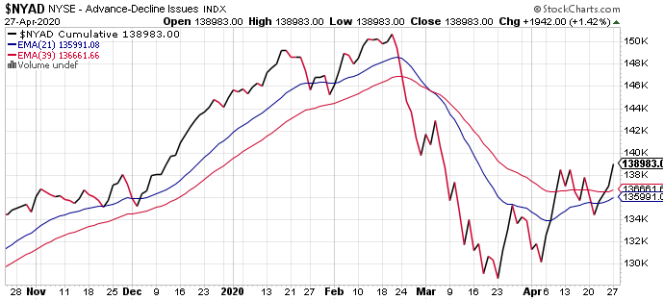
NYAD.png

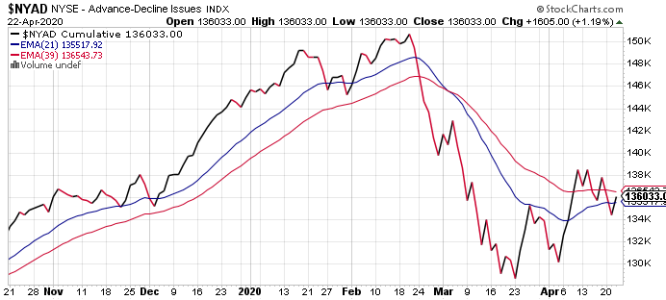
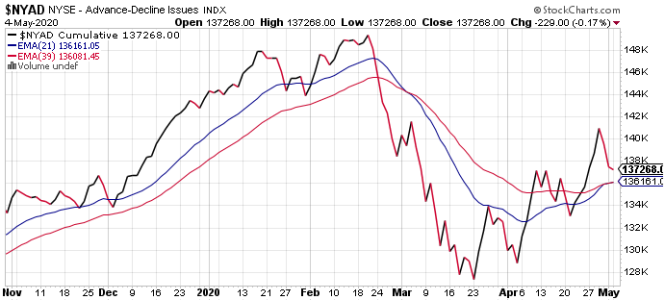
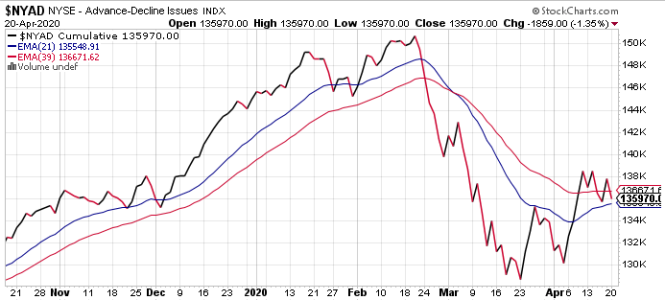
Breadth continues to flip back and forth and is now negative once more. Perhaps we can look at this reading as neutral given the action.

Futures are positive as I write this, but who knows how the market opens tomorrow. It would not surprise me if the market rallies. It is perverse enough to do something like that.

I remain modestly bullish.
 
Yes, this market is crazy. Futures are now lower as the sell-off in the oil sector appears poised to extend losses. Can the bulls mount a response? Can they maintain the up-trend? NAAIM's bearishness does call this into question, but as I said in previous posts, they aren't shorting this market in earnest. I'm sure that reluctance is rooted in uncertainty.
 
The selling continued today as did pressure on the oil market. But this selling still has a "controlled" feeling to it. I don't get the impression based on the action that the bears can keep this going.

S&P 500.png
DWCPF.png

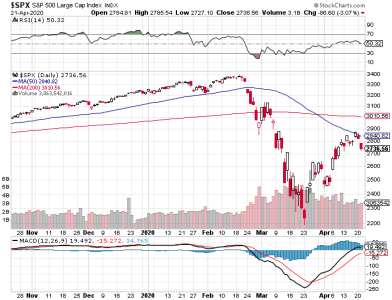
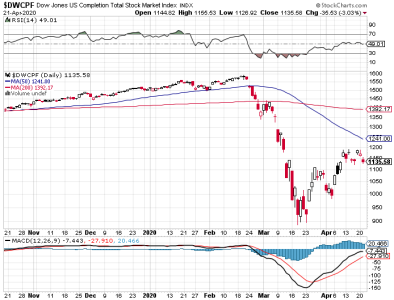
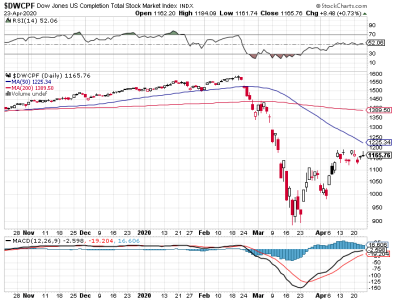
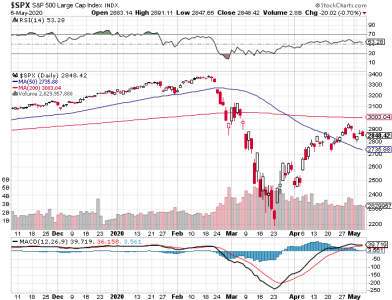
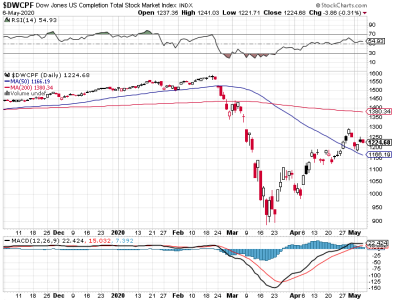
So far, price has been rejected (resistance) at the 50 dma on the S&P 500. But we may have another bull flag started, so I would expect another test at some point. Having said that, momentum is rolling over, so the bulls need to step in soon. The DWCPF is in a short term trading range with price now testing the lower part of that range.

NYAD.png

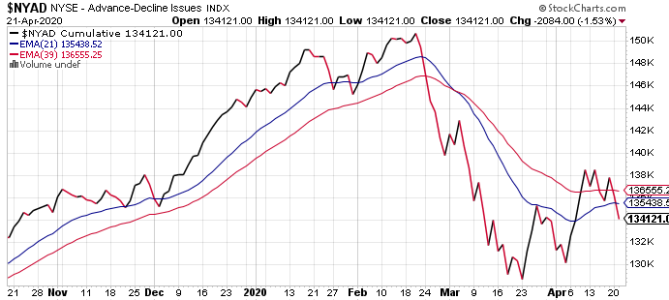
Breadth is now definitively bearish.

I am going back to a neutral stance. I would not be surprised by a run to the upside again, but I also can't rule out more weakness.
 
The bulls bounced the market today. It seems we remain in somewhat of a trading range right now.

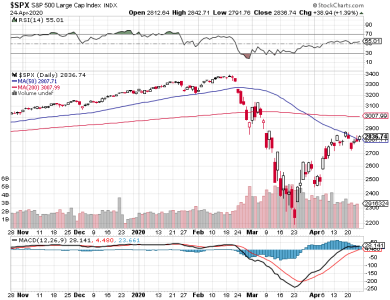
S&P 500.png
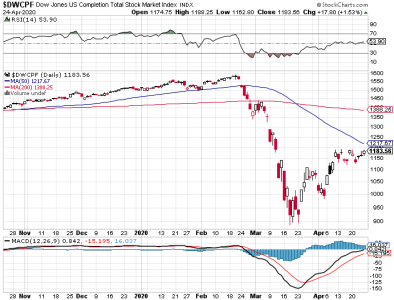
DWCPF.png

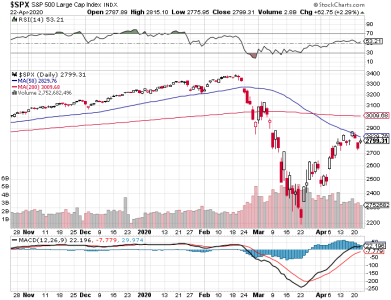
Price on the S&P didn't quite test the falling 50 dma, which is still an area of resistance. The DWCPF is moving sideways. Momentum has stalled.

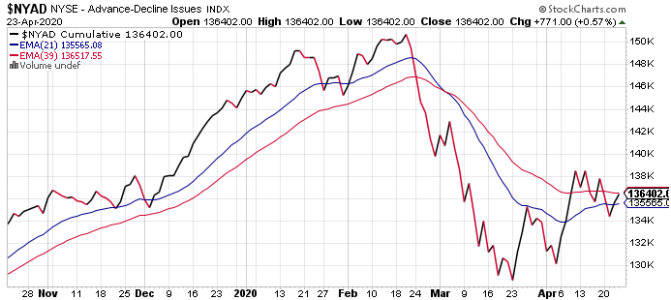
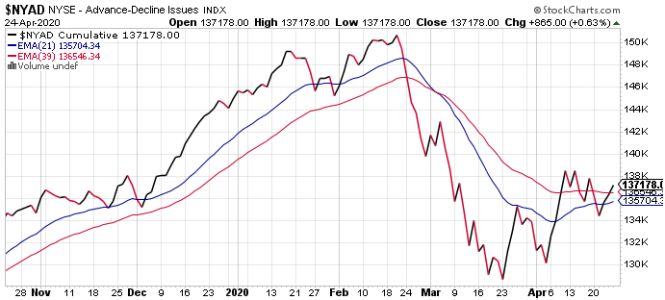
NYAD.png

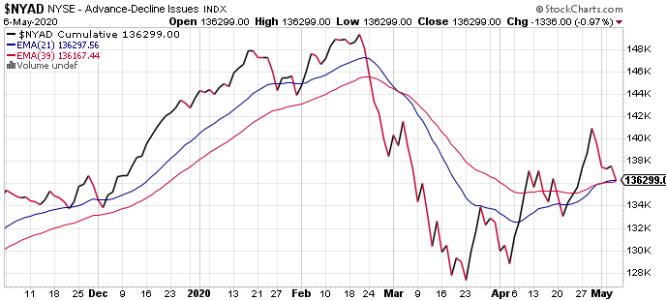
Breadth is now neutral, having pushed back through the 21 day EMA.

NAAIM reports tomorrow. I suspect they will not change much. The uncertainty about this market remains in place, though we are still technically in an uptrend. Still plenty of upside key resistance areas to slice through.

I remain neutral.
 
The market was largely flat on somewhat volatile trading today.

S&P 500.png
DWCPF.png

We can see that price on the S&P 500 is testing the falling 50 dma again and closed just under it. The DWCPF may test it simply when the average falls down to the top of the trading channel if it does not break out first. Momentum is rather flat.

NYAD.png

Breadth rose, but remains neutral.

The main data point for today is somewhat good news for the bulls. NAAIM had a fairly good rise in bullish positions. They are not bullish overall, but I would say they went from collectively bearish to neutral now. The bulls just may get another up-leg in the days ahead on this reading. It may not be a big one, but it would certainly keep the uptrend intact.
 
The market closed lower overall last week. I consider the weakness to be part of the climb higher. We need consolidation here and there to keep it going (historically).

S&P 500.png
DWCPF.png

Price on the S&P 500 closed above its 50 dma. There is plenty of resistance to get to the next big hurdle, which is the 200 dma, but first we need to see price remain above the 50. The DWCPF closed almost neutral for the week. Momentum remains flat to modestly positive.

NYAD.png

Breadth flipped bullish again, but it's still moving sideways overall.

I said on Thursday that NAAIM went from bearish to a neutral reading. No slam dunks on the upside with this reading, but it's a good sign for the bulls just the same. TSP also went from bearish to neutral.

I am neutral to modestly bullish. There does seem to be a floor under this market even as price is struggling to go higher (in the overall market).
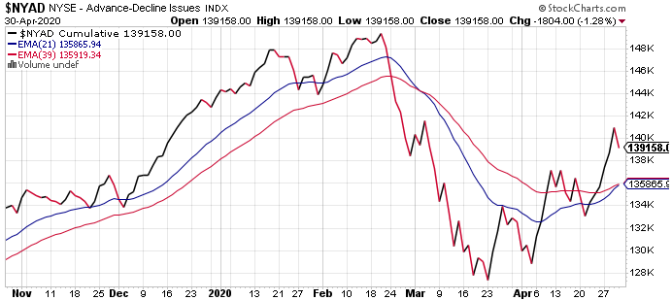
 
It didn't take long since the neutral NAAIM reading for the market to break higher. That was the most likely outcome, though the timing is not easy to discern.

S&P 500.png
DWCPF.png

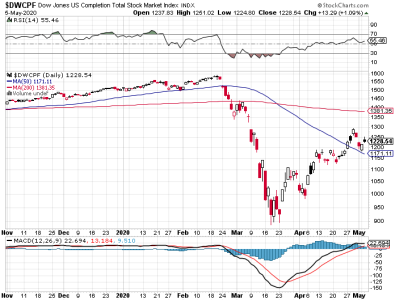
The next up-leg may have started. We can see that price moved further away from the 50 dma on the S&P 500, while price on the DWCPF closed above that level for the first time in about 2 months. Momentum is beginning to turn back up.

NYAD.png

Breadth is bullish and should continue to move higher as long as price is the doing the same.

I remain neutral to modestly bullish.
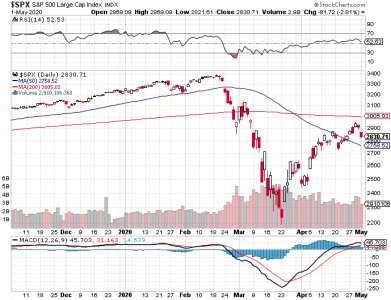
 
Just a quick update this evening. The market closed mixed on the day. No changes to my sentiment, which is neutral to modestly bullish.
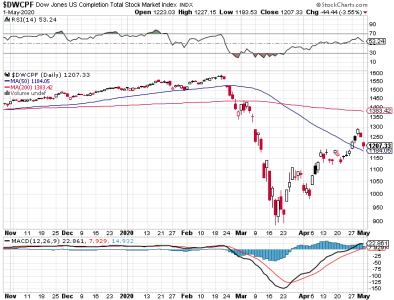
 
The 3rd up-leg continued today with price closing with solid gains.

S&P 500.png
DWCPF.png

We can see that price is now making a run toward the 200 dma on both charts. Momentum is rising and volume was robust.

NYAD.png

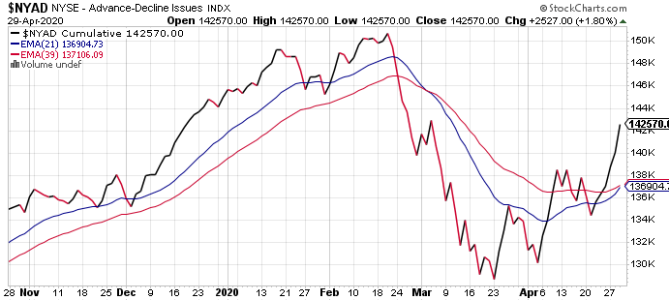
Breadth is looking very good and remains solidly bullish.

It will be interesting to see what the next NAAIM reading will be, which is tomorrow. I remain neutral to modestly bullish.
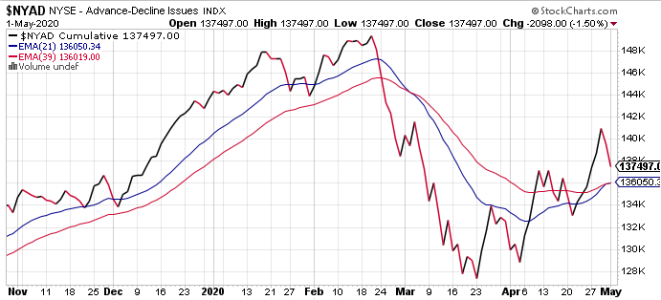
 
After putting some gains together earlier in the week, the market pulled back a bit today, which does nothing to hurt the uptrend.

S&P 500.png
DWCPF.png

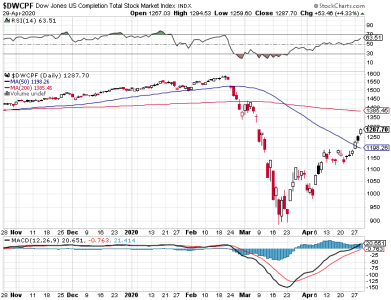
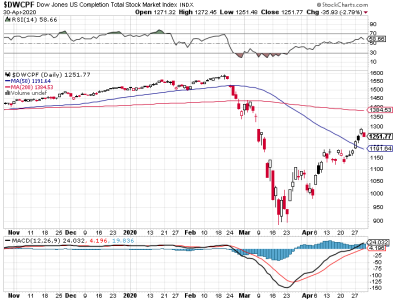
Both charts still look good as price continues to whittle away at yearly losses. The 200 dma is really not far off and is almost certain to get tested.

NYAD.png

Breadth remains bullish.
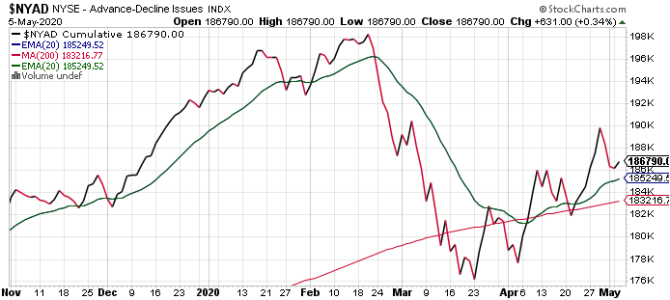
The big news of the day is that NAAIM got bullish. Maybe not over-the-top bullish, but there was a large increase in bullish positions. That's a green light for the bulls in my book.
I am now bullish.
 
Last week was mixed for the averages. The S&P was down modestly, while the DWCPF tacked on more than a 2% gain, which is impressive given the selling at the end of the week.

S&P 500.png
DWCPF.png

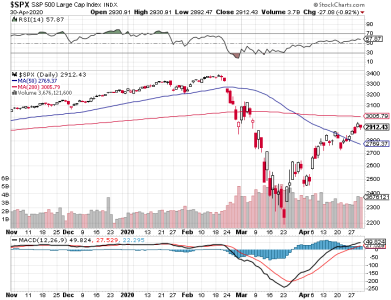
Another bull flag in the making? I think that's likely, but we'll need to see if the 50 dma holds as support. Momentum has gone largely flat.

NYAD.png

Breadth remains bullish, but it is under attack.

Last Thursday, NAAIM showed a significant increase in bullish positions among these smart money managers. I view this reading as bullish. TSP Talk came in neutral.
The end-of-month selling comes as we head into the historically weaker part of the year. There are plenty of negative headlines to stoke bearish sentiment too. So, why is NAAIM getting more bulled up? This is not a precision sentiment reading, but it tends to be accurate much more often than not.

Let's see how the new week starts. I've seen headlines that more selling is likely, but that's not the market talking. I remain bullish for now.
 
The market opened weak in morning trade, rose shortly after and leveled off until the early afternoon when the bulls pushed price into positive territory and closed out the day in the green. Sound familiar? Once again, a floor seems to be under this market.

S&P 500.png
DWCPF.png

So far, the 50 dma is holding. The reversal suggests the market may be ready to move higher again.

NYAD.png

Breadth remains bullish, but has not turned back up yet.

Remember, NAAIM flipped bullish last week, so that's another reason to look for rising prices. I remain bullish.
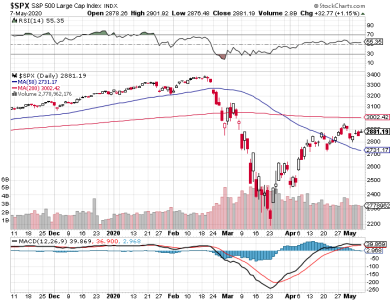
 
The bulls managed to continue the upside move that began on Monday, though a good portion of the gains were erased in late day trading. That doesn't mean all that much in and of itself. What we are likely seeing is what we've seen previously, which is an overall move to the upside over a period of days.

S&P 500.png
DWCPF.png

On this particular upside swing, we need to see price hit a higher high. A higher high would coincide with a test of the 200 dma. I think it's a reasonable expectation right now. I'd like to see momentum turn back up, which it should if we get that test.

NYAD.png

Breadth ticked up a bit and remains bullish.
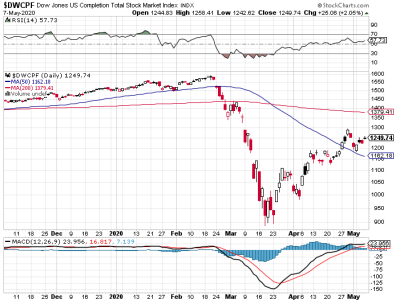
My sentiment is still bullish, just like NAAIM.
 
The market had a choppy day today, spending time above and below the neutral line. At the close, prices were moderately lower.

S&P 500.png
DWCPF.png

The charts still look good as far as the up-trend goes, but resistance is likely going to continue serving as a headwind. Momentum is flat.

NYAD.png

Breadth dipped again and is now neutral. I don't see this as a concern given the charts remain in a stable up-trend.

NAAIM reports tomorrow. I remain bullish.
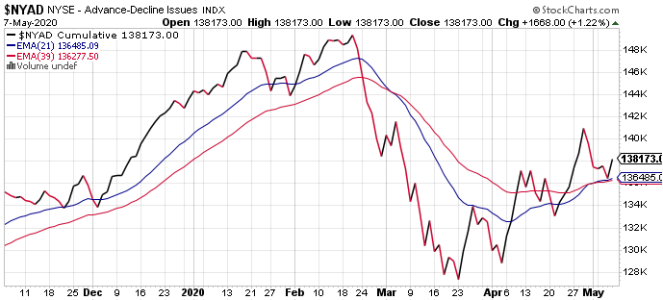
 
The bulls bounced the market today, but the sellers came in later in the trading day and erased some of the gains.

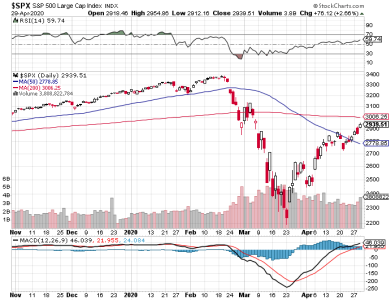
S&P 500.png
DWCPF.png

The charts still good from a bullish perspective.

NYAD.png

Breadth ticked higher and is back to a bullish stance, but not by a lot.

NAAIM saw a decrease in bullishness, but the bearishness also saw a small decrease. In essence, it looks like a few bulls and a few bears went neutral. This does not affect the overall bullish disposition of the market, but does indicate more choppy action ahead that slowly resolves higher. I don't think the market is ready for any launches to the upside, but there still appears to be a floor under it as well.

I remain bullish overall.
 
CH,

Can you briefly summarize, if it’s not too much trouble, what the data in the columns on the NAAIM mean? I’ve looked all over to find an explanation but have come up dry. TIA.
 
CH,

Can you briefly summarize, if it’s not too much trouble, what the data in the columns on the NAAIM mean? I’ve looked all over to find an explanation but have come up dry. TIA.

I am not intimately familiar with it myself, but you're right, there isn't any explanations. But I've listened to a Wall Street professional for many years who used that data in his market analysis and became comfortable with the NAAIM reading enough to use it for my own purposes. I look at the readings from a general perspective. I think the numbers represent how leveraged (overall) the managers are (50%, 100% 200%, etc). And a reading is derived on the site for the overall sentiment. It is not clear to me exactly what the columns represent, but it could be that the columns represent groups of money managers. How they are assigned to the columns I do not know.

It is important to remember that when dealing with sentiment there is room for flexibility. So we can look at the overall number (Mean/Average) as a soft representation of the overall sentiment of the managers themselves. The higher the number, the more bullish they are. Midway is neutral. A lower reading gets into bearish sentiment. You will also notice the columns increase and decrease as the Mean/Average is calculated.

As nice as it would be to have a better understanding of how this entity uses and manages this info, we don't really need it to understand the overall sentiment picture.
 
CH,

Thanks and I totally agree with your last statement “ As nice as it would be to have a better understanding of how this entity uses and manages this info, we don't really need it to understand the overall sentiment picture.”
Cheers!
 
Back
Top