coolhand's Account Talk

I'm looking forward to CH's next, completely nonpolitical, post about the market. I sense a bear trap door ahead, with year to date lows, and then some. In fact, I think the yearly high has been put in, and pain b4 gain.

Sent from my SM-J320P using Tapatalk
 
It's your money, folks. People need to get a reasonable idea of how this game is being played if you want to have a decent chance of avoiding maximum pain. I am not going to spoon feed this. You need to do this on your own. This is a good source to learn some measure of how things work at the top of the food chain. There are others. Seek the truth and keep an open mind. If interested in what I'm talking about, you can read more about it here... https://www.sgtreport.com/
 
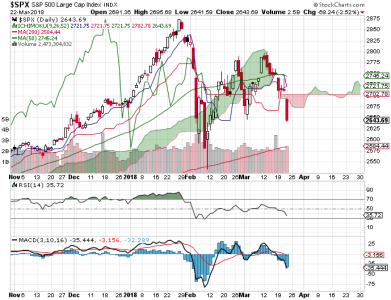
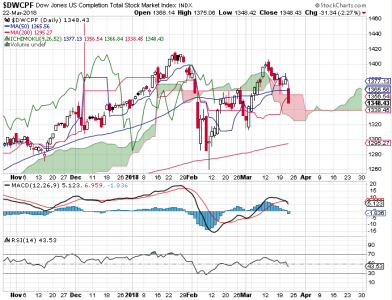
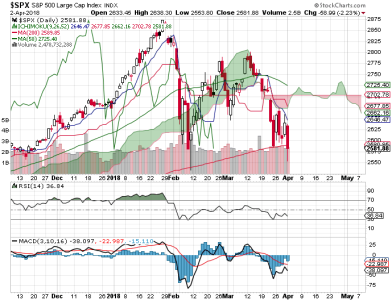
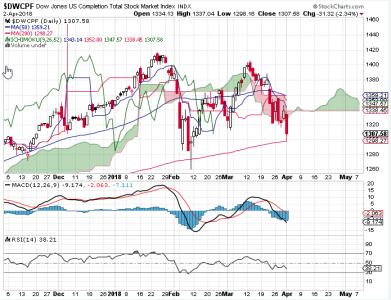
Okay, here's the technical picture. The market has turned ugly (obviously). From a technical perspective, I did not expect this much selling. That's why you've seen me post some links to help you frame the real underlying angst of the market. If you think the insiders and big money simply use charts to navigate these waters, you'd be wrong. They know how things work and they know when risk is rising and falling. Charts can tell us a lot most of the time, but they get tricky when things are different. Global CBs are under pressure as never before and so we are almost certainly going to see a battle of perhaps epic proportion for control of the global economy to include the monetary system. I am just trying to help you develop a basic foundation of what could play out over the coming weeks and months ahead. These things cannot be timed very easily, if at all. In environments like this, you might consider keeping some degree of powder dry depending on your risk tolerance.

S&P 500.png
DWCPF.png

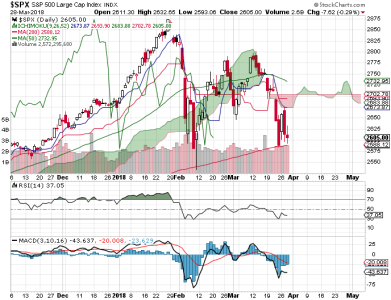
Price on the S&P 500 broke support and appears headed for a test of the 200 dma. I would not assume it will hold if it gets there; although it may. A break of support could also happen before a turn back up. That is what I would expect in a bull market, which is where we still are. But, while it is still a bull market, a lot of damage could be done before a bear market is declared if things continue to bias to the South. So betting on a bullish outcome does carry risk. Now, I am not suggesting we are heading into a bear market. I am just trying to frame risk. And the risk appears to be rising.

Let's look at some other risk measures currently in play. NAAIM is still bullish overall, though some modest shorts are in evidence. The options are neutral to bearish for Friday. My intermediate term system has flipped negative. Breadth is negative and falling hard.

So, I am looking for more selling for a possible retest of the lows. NAAIM would seem to suggest that the market is not ready to fall apart. Perhaps not for weeks or months yet. Again, you can't time the risk element that's in play.

I have raised cash myself in order to not have a ton of stock exposure right now. If you have cash on the sidelines, you may want to consider redeploying some if we test the lows, but volatility could make that very difficult. Especially for TSP.
 
Last edited:
If any of you walk in Christ or want to get closer to him, I have a special link I'd like to send you that deals with prophecy and ties a lot of things together. It's a positive message from someone who lives not far from me. If you are just curious, I invite you to learn about this message and explore who this individual is. He is actively engaged in giving people spiritual support on a daily basis.

PM me if you want this link. I will respond to all requests later this evening (I have a day job).
 
CH,

With the US giving up it's World Leadership and China making it's play do you think the US dollar will lose it's dominance to the Chinese Yuan (renminbi)?
 
Certainly a risk, I think one reason for tariffs; we're re-establishing US world leadership after 8 years adrift.
 
https://www.goodreads.com/book/show/11515298-currency-wars

As James Rickards argues in Currency Wars, this is more than just a concern for economists and investors. The United States is facing serious threats to its national security, from clandestine gold purchases by China to the hidden agendas of sovereign wealth funds. Greater than any single threat is the very real danger of the collapse of the dollar itself.

Baffling to many observers is the rank failure of economists to foresee or prevent the economic catastrophes of recent years. Not only have their theories failed to prevent calamity, they are making the currency wars worse. The U. S. Federal Reserve has engaged in the greatest gamble in the history of finance, a sustained effort to stimulate the economy by printing money on a trillion-dollar scale. Its solutions present hidden new dangers while resolving none of the current dilemmas.

While the outcome of the new currency war is not yet certain, some version of the worst-case scenario is almost inevitable if U.S. and world economic leaders fail to learn from the mistakes of their predecessors. Rickards untangles the web of failed paradigms, wishful thinking, and arrogance driving current public policy and points the way toward a more informed and effective course of action.
 
CH,

With the US giving up it's World Leadership and China making it's play do you think the US dollar will lose it's dominance to the Chinese Yuan (renminbi)?

I don't think I'd frame the way you did. But in any event, I don't want to speculate on something like this. Check out the X-22 financial report (daily). They do a pretty good job of connecting dots.
 
As I mentioned in my last technical post, a lot of technical indicators were looking bearish. I said that NAAIM was still bullish overall and that this might indicate that a serious decline may not be in the cards...yet. However, the options looked bearish for Friday and I was expecting a test of the previous lows. Friday seemed to be holding together for a bulk of the day, but by mid-afternoon the sellers took control and pounded the market all the way into the close. That is not a bullish sign. Weekly losses across all 3 TSP stock funds were high, with the S&P 500 leading way with a loss of almost 6%.
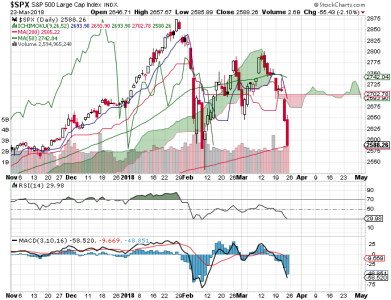
S&P 500.png
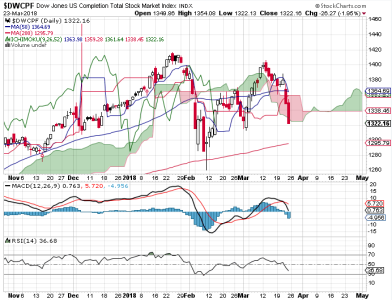
DWCPF.png

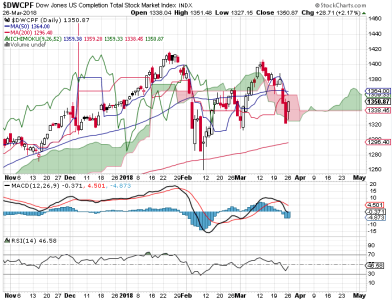
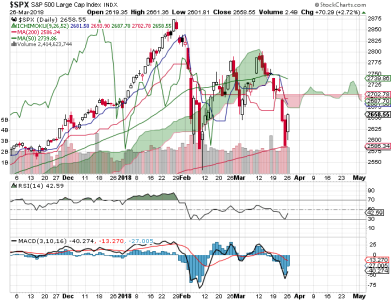
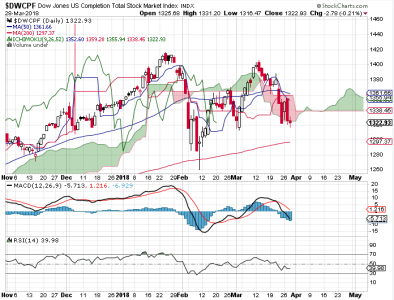
Price on the S&P 500 closed very near the 200 dma. It did not quite eclipse the February low, but it's close. This is where things are going to get interesting. It may still get broken, but it's entirely possible it will result in a bottom and then a turn back up. If it breaks it and closes significantly lower sometime next week, that will start to call into question whether we are still in a bull market. The DWCPF is bearish too, but not as much as the S&P 500. It has not tested its 200 dma. If it does, the S&P 500 will almost certainly continue its plunge as well.

Breadth is falling hard and that's a big problem for the bulls. The options look neutral to bearish for Monday. My intermediate term system is negative. Generally, I'd be looking for a low any time now. And maybe we'll get one. But let's look at a longer term chart first.
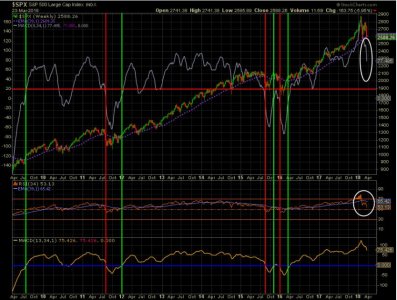
S&P 500 LT.jpg

Here is a weekly chart of the S&P 500 going back to 2010. Note how much steeper price rose since the Presidential election. Also note how much MACD rose (greyish line); especially since late last Summer. It had been very high. Note that it is now falling like a rock over the past few weeks. Now, look at RSI (red line). It was buried to the upside for a while and is now struggling. Nowhere else on this chart do you see RSI above 70. It's also been moving under the 39 day EMA for a while now and looks poised to hit zero and maybe get into negative territory. RSI has not been negative in about 2 years. I can't be sure. But it sure looks like a magnet is trying to pull it down.

I've been largely bullish for some time, and until last week I could afford to be bullish. Now, not so much. While the longer term chart is looking dicey, the market may continue to be volatile, with price rallying and falling as the bulls and bears battle it out. Heck, we could bottom and make new highs from here, but don't get complacent if it does. This market is coming down sooner or later, it's just a question of when.
 
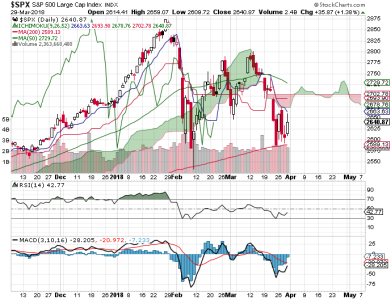
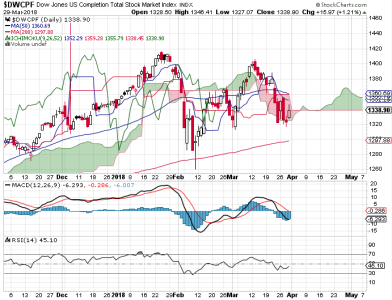
The 200 dma on the S&P 500 held as stocks gapped to the upside and closed with big gains to start of the week.

DWCPF.png
S&P 500.png

So, we got the bounce. Now what? I would normally expect an extended move in the opposite direction after a week like last week and especially now that the S&P 500 tagged support. And while it may begin to bias to the upside again, I note that the Arms index is very low, which suggests a counter move in the very short term. That means we could move lower on Tuesday. If it does, it can still be interpreted as bullish as the volatility can mean that a bottom is forming.

The options are neutral for Tuesday.

For Tuesday, I'm thinking the market may probe lower again, but a bottom (for now) may be in. Longer term (maybe intermediate term), the market is prone to more selling.
 
As the Arms Index warned, the market reversed Monday's gains on Tuesday. Wednesday then chopped up and down. That's consistent with bottoming action.

S&P 500.png
DWCPF.png

We can see that price on the S&P 500 is trying retest the 200 dma, but it has fallen short the past 3 days. That's okay, whether it gets retested or not, the market appears to be firming up.

A lot of technical indicators remains negative, breadth included. That's what you would expect to see before a reversal higher. The options are neutral for Thursday.

My expectation is for an eventual turn back up. I reentered TNA today at a better price since selling it last week. There is still plenty of risk, but from a technical perspective, this is a good set-up for a multi-day rally. It may still be a few days off, but then again it could come sooner.
 
The market had a nice bounce on Friday, though it gave back some of its gains in late afternoon trading.

S&P 500.png
DWCPF.png

As you know, I am looking for a multi-day turn higher over the days ahead. Friday's rally may be the beginning (it was the last day of the quarter, which might be bullish as quarterly reports begin). I note that both charts show price above their respective 200 dma's, but also below their 50 dma's.

The options ended Friday neutral, but NAAIM got bearish. Historically, that was good for a short-term contrarian play (up in this case), but that has not been working so well for a little while, so this could be an issue for the bulls next week. However, NAAIM's bearishness is not universally reflected by all of its managers, so I can't read too much into it.

I note that my intermediate term system may be starting to turn up as some of the signals are leveling out or starting to rise. Breadth has turned back up, but remains negative. One more up day could flip it positive, however.

So, we'll see how it goes. I am long TNA and C, S and I funds.
 
I was afraid that the bearish spike in NAAIM might be an issue for the bulls this week and the market wasted no time confirming my fear.

S&P 500.png
DWCPF.png

The DWCPF tested its 200 dma today, but did so successfully. The S&P 500, however, closed under its 200 dma, but did not break its February low.

A retest of the lows was not out of the question, but it wasn't the higher odds outcome. What this is going to do is really bring out the bears. That's bullish. Very bullish. I would be surprised if the market didn't launch into a multi-day rally very soon.

A lot of stuff turned back down today. I do note that the options are now bullish heading into Tuesday. It's difficult riding this thing when you're long, but the technical picture looks good for a sizable rally at this point.

If we don't get it soon, the game may have changed.
 
Back
Top