coolhand's Account Talk

Hello tc5. I didn't see this post until today. Let me get back to you later today on PDI.

Hi CH-
I was watching this disaster as it was dropping on Monday and bailed out completely as soon as it broke $6.00, then plowed everything into PDI which I had been watching for a while. This fund seems to be a bit more sound with a decent monthly dividend. Will take a while to recover what I lost on FAX, but I already feel better !! Do you have any perspective on PDI ??

Thanks again for your insight, all of your posts are truly enjoyable.
tc5
 
PDI.png

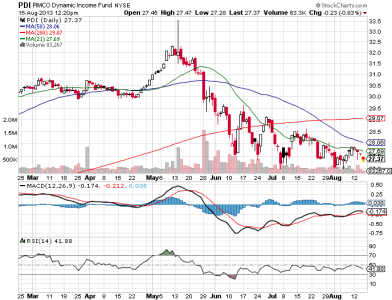
Looking at the chart, PDI has been hammered like most other interest rate sensitive issues ever since the Fed began talking about tapering back in May. It's trading in a somewhat narrow range, which isn't surprising given the yield on the 10 Year Note is still rising. I see that it is highly concentrated in mortgage-backed securities and it's also highly leveraged, which makes it an aggressive play. So if interest rates continue to rise, this fund will likely fall in price. That's not a given as we don't know for sure what interest rates will do in the months ahead. But at this moment, the 10 Year yield is hitting fresh multi-year highs.

The fund is leveraged 47.8% compared to an average among CEFs of about 20%. So the high leverage coupled with rising rates could be a problem in the short term. It does throw off a nice yield thanks to that leverage.

Since I view CEFs with a long term perspective and I happen to like monthly dividends a lot, I would not mind adding it to my portfolio, although I'd wait to see where interest rates are headed just in case I can get a better buy-in price. That's why I'm not yet pulling the trigger on IGR, which is a global REIT fund. It's hitting fresh multi-week lows today.


Hi CH-
I was watching this disaster as it was dropping on Monday and bailed out completely as soon as it broke $6.00, then plowed everything into PDI which I had been watching for a while. This fund seems to be a bit more sound with a decent monthly dividend. Will take a while to recover what I lost on FAX, but I already feel better !! Do you have any perspective on PDI ??

Thanks again for your insight, all of your posts are truly enjoyable.
tc5
 
There are a number of stocks finally hitting my buy threshold too. I wish I had the resources to buy them all. IGR is one that I'd be more patient with as interest rates appear to be slowly rising. If "they" are serious about holding rates down, I'd think we'd see a reversal in the bond market at some point. But what they say and what they do can be very different things.

IGR is VEEEEERRYYYY tempting...
 
I know I've been scarce in my account thread the past month, but I've been very busy in my full time job as well as spending a significant amount of time keeping up with my new market analysis service in the off time. Beginning in January I'll be going to a part time schedule at work, which will give me a lot more flexibility in being active on TSP Talk.

I do have two stocks that look like potential short term plays. I stress short term.

CLX.png

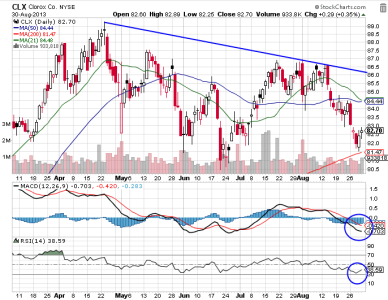
Clorox Co. may be putting in a short term bottom. Last Thursday, the 200 day moving average acted as a support. MACD has not turned back up yet, but RSI is hinting at moving higher. I think the 50 day moving average would be a reasonable target should the technicals continue to improve. The downward trend line shows another resistance area in the $86 area.

ETR.png

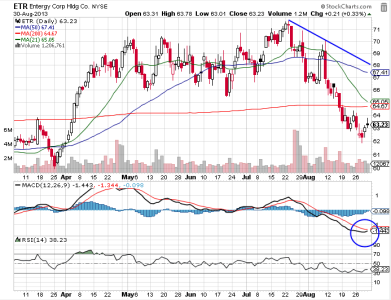
Entergy also looks like it may have put in a short term bottom. Price has been below the 200 day moving average for the past couple of weeks, but MACD is beginning to turn up and may have a positive signal line cross soon. This is a stock I showed you back in late April and expected it to run at that time. And it did run. But that was when liquidity levels were high. Right now they are not. While the 200 day moving average will act as resistance, if it can past that level it could tag the 50 day moving average before possibly heading back down.

Again, with liquidity levels down and seasonality weak upside opportunities are more challenging and require closer attention to market action. My confidence level under these conditions is not nearly as high as when underlying market support was strong.
 
I have been researching another technical analysis tool lately called Ichimoku charting, which is a popular and comprehensive Japanese trend and momentum tool. I am quickly becoming a fan of this style of technical analysis although I will also continue to use the ones I've been using all along. If you are interested in what this system is all about, you can research it here.

9-9-2013 8-31-38 AM.png

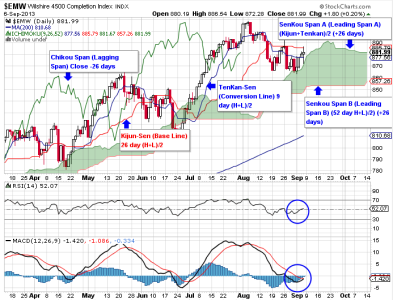
I have labeled the main signal lines in this chart of the Wilshire 4500 for reference as well as a brief description of each. Looking at this chart I can see that the longer term trend remains up as price remains above the Leading Span A line. That line represents support and so far it has been holding. There is more support below along the Leading Span B line. The trend is plotted out 26 days in advance, so it provides a notional idea of where future support and resistance will be. Now, the conversion crossed the Base Line a couple of weeks ago and that's a bearish momentum cross, but as long as price remains above the Leading Span A line, the trend will remain up.

I note that MACD appears to be turning higher and RSI had a positive center line cross, so this chart looks bullish to me overall.

9-9-2013 8-46-14 AM.png

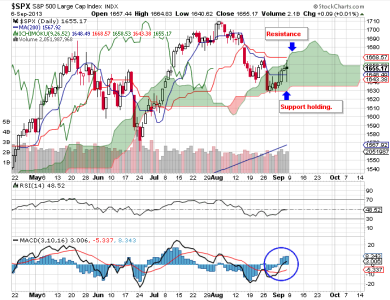
The S&P 500 fell below support (Leading Span A) almost 2 weeks ago, which is bearish, but so far support is holding at the Leading Span B line. If price can get back above the Leading Span A line, that would be a bullish crossover. For now though, this chart is moderately bearish. But MACD did have a positive signal line cross last week and RSI gaining strength. We'll see how it plays out, but I am looking higher this week. That would be consistent with the projected tracking of the Leading Span A line.
 
You are far better at explaining the meaning of the lines than I was, back when I tried. Good job, CH.
 
You are far better at explaining the meaning of the lines than I was, back when I tried. Good job, CH.

It's not a difficult system once you get familiar with the lay-out, but it sure looks confusing for someone looking at it the first time.
 
Thanks for the Ichimoku primer, CH. Looks very interesting. I'd love to do more research on this as well. Great job explaining the basics.
 
Thanks for the Ichimoku primer, CH. Looks very interesting. I'd love to do more research on this as well. Great job explaining the basics.

Once you know what you are looking at, it becomes a quick study to understand the trend and momentum reflected in a given chart. I didn't mention the Kumo (clouds) in my post, but they provide additional insight. For instance, the thickness of the Kumo shows the level of historical volatility, as well as the strength of support or resistance. A thicker Kumo shows a greater the level of historical volatility and support or resistance, and vice-versa. It offers a lot of information in one package.
 
that Ichiro Suzuki method is very intriguing...looking back in hindsight over the chart it appears obvious when to buy and sell...how can you recognize this in the moment to pinpoint an entry and exit point...i would think the time to buy equities is now and then sell when the MACD is high again...can't be that simple though
 
that Ichiro Suzuki method is very intriguing...looking back in hindsight over the chart it appears obvious when to buy and sell...how can you recognize this in the moment to pinpoint an entry and exit point...i would think the time to buy equities is now and then sell when the MACD is high again...can't be that simple though

In "theory" that's the way it's suppose to work. And while this is an effective tool, it helps to have other indicators to give additional weight to anticipated market action. I use sentiment, auto-tracker signals, liquidity, intermediate term system, etc. to help stack the cards more in my favor.
 
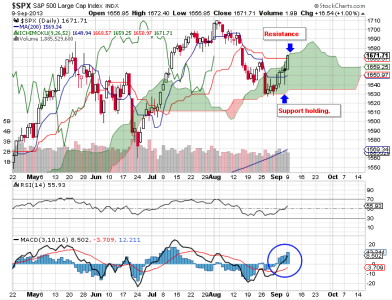
After yesterday's big rally, here's where the charts stand now.

SPX.png

Price of SPX is sitting right at resistance (Leading Span A). MACD is positive and pointing higher as is RSI. If price can close above that resistance line, it would be bullish.

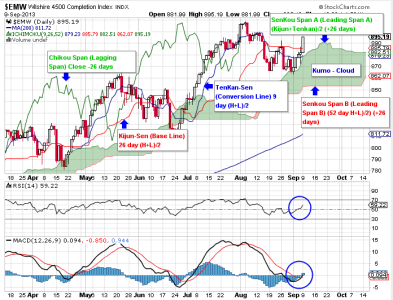
EMW.png

The Wilshire 4500 by contrast is and was bullish all along. Price has remained above the Kumo (cloud), which is a bullish trend indication. MACD had a positive bullish cross yesterday is now in positive territory. RSI is getting stronger. There is a good chance we'll be hitting fresh all-time highs based on this chart. In fact, I think this is the chart to be watching more closely than the S&P 500.

AGG.png

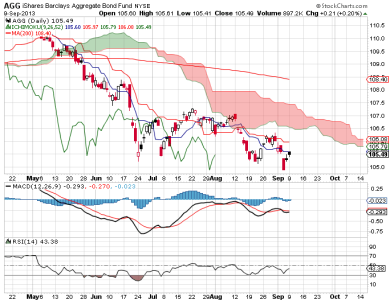
Bonds (AGG), are a different story. Price has remained well below the cloud for weeks. That's bearish. MACD and RSI are also bearish.
 
Thank you for the charts and Ichimoku school, Coolhand. You do an excellent job of keeping our interests up and teaching us new things. :cool:
 
Thank you for the charts and Ichimoku school, Coolhand. You do an excellent job of keeping our interests up and teaching us new things. :cool:
Thanks Cactus. Part of my objective is to help folks learn how to make better decisions. The learning process never stops when it comes to the stock market. And hopefully our success increases as our knowledge level rises. It's not just what tools one uses, but how one interprets the big picture, which I like to call "context".
 
[QUOTE}Cactus.....Thank you for the charts and Ichimoku school, Coolhand. You do an excellent job of keeping our interests up and teaching us new things. :cool:[/QUOTE]
I concur. CH, you are building a great case for your soon to come Premium Service, you sly devil... I think I'm hooked !!
 
There are a lot of short term plays that I am seeing across many charts this morning. Now keep in mind that liquidity is currently rising, and as long as that remains the case many stocks are going to be lifted higher. Seasonality remains a concern and I am taking that into consideration with my projections here. Again, these are short term projections. Everything is subject to change as the market plays out.

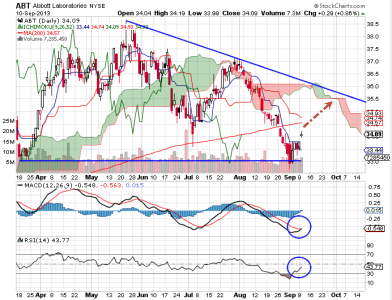
ABT.png

I mentioned ABT in my weekly analysis earlier in the week and thought that it might find short term support in the $33 area. So far, it has. MACD looks to be having a positive signal line cross, while RSI is gaining strength. The longer term trend is still down for this stock, but I am projecting price will at least reach resistance in the $35.5 area (arrow).

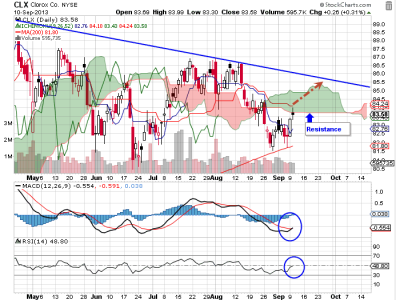
CLX.png

I mentioned CLX over a week ago as a short term play and currently price is indeed appreciating. Price is currently bumping up against initial resistance against the Kumo (cloud), but I am anticipating it will continue to rise to the downward trend line in the $85.5 area. MACD looks to be having a positive signal line cross and RSI is rising.

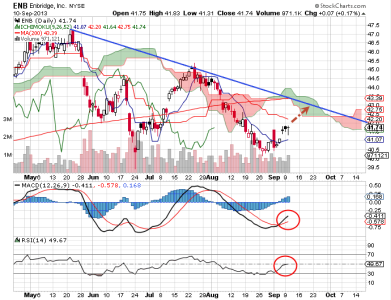
ENB.png

I've been talking about this ENB of late too. I said I was anticipating it would find short term support in the $40.5 area and so far it has. I am anticipating price will rise to the $42.75 area and perhaps above $43. MACD had a positive signal line cross recently and RSI looks to be gaining strength.

EXC.png

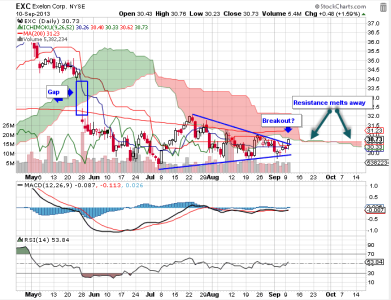
I had said that EXC was forming a symmetrical triangle and that it could break either way. It's still a bit early to be sure, but it may have broken out to the upside yesterday. I note that price is currently just under the Kumo (cloud), which is resistance, but that resistance will dissipate in another week. So if price can get above the $30.80 area, it could run to about $34 to fill that gap. MACD is flat however, as is RSI, but if they turn up I think there is some money to be made on this stock. Keep in mind what I said earlier about seasonality. October is only three weeks away and the current market rally may fade by the end of this month assuming liquidity remains supportive until then. Liquidity is key my current short term projections.

IBM.png

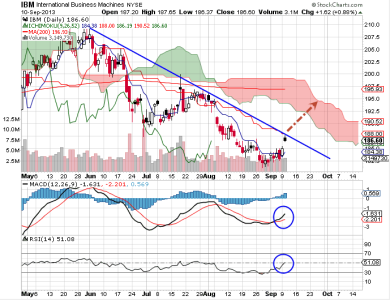
Price of IBM is bumping up against downward trend line resistance, but I suspect liquidity will propel it past that level and towards the Kumo. I am anticipating that price will reach $192.5 and possibly go as far as $195 in the short term. MACD had a positive signal line cross and RSI is turning up.
 
As I thought might happen, weakness is fleeting when underlying market support is kicked into high gear. I don't know how long it will last, but as long as it remains elevated I plan to enjoy the ride. One thing of note though, it's not lifting all boats the way it did earlier in the year.
 
Back
Top