coolhand's Account Talk

Quick update from yesterday's posted charts:

ABT.png

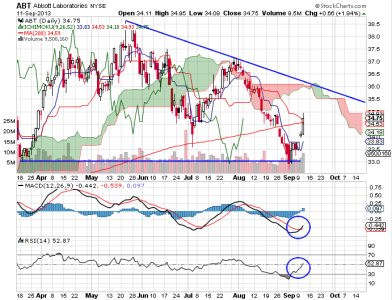
Price for ABT had a nice move higher on volume yesterday. Momentum and RSI continue to look good. I'm still anticipating price will reach $35.5 for this move.

CLX.png

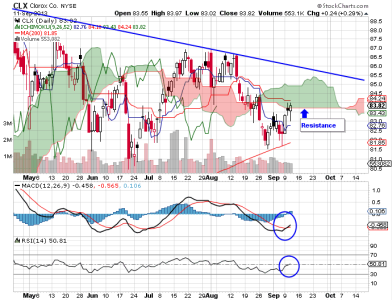
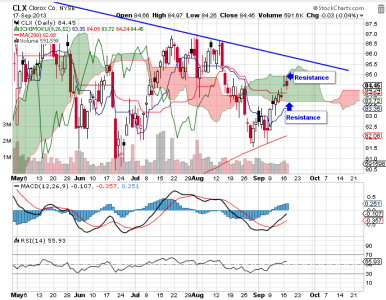
Price for Clorox moved a bit higher yesterday and it still looks poised to push higher. But it is now entering an area of resistance (the cloud). As long as the indicators remain supportive, I am still anticipating price will reach the $85.50 area.

ENB.png

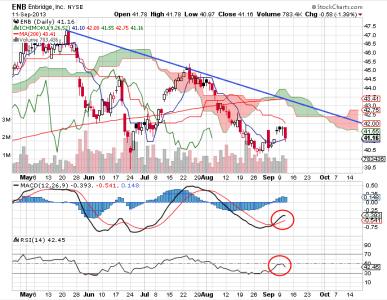
Price for ENB fell back go its 9 day moving average yesterday and RSI turned down a bit. Momentum stalled. It may turn back up yet, but if it drops below its 9 day moving average that would not be a good sign for the short term.

EXC.png

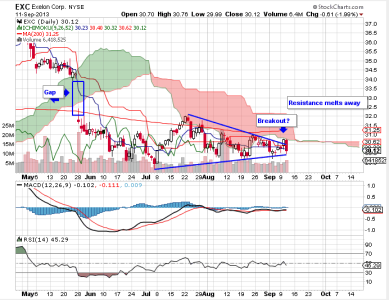
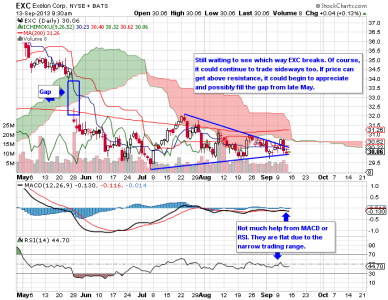
Price of EXC fell back into the triangle area, which is okay, but it is still not know which way the breakout will occur. Price poked through the triangle yesterday, but that appears to be a false initial break. MACD and RSI remain flat. This is still just a watch.

IBM.png

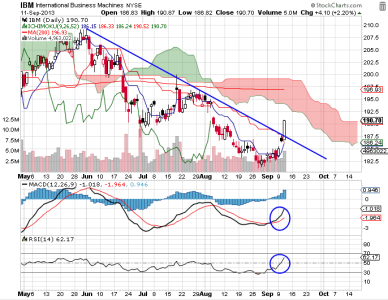
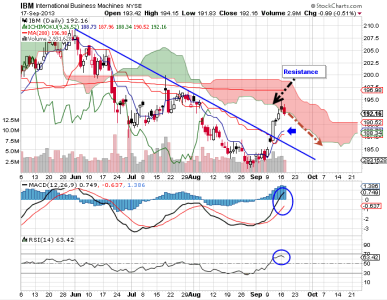
IBM had a decisive move higher yesterday, blasting through the downward trend line and the base line. More resistance is overhead, but this is a bullish move. MACD and RSI are looking higher.
 
EXC.png


IBM.png

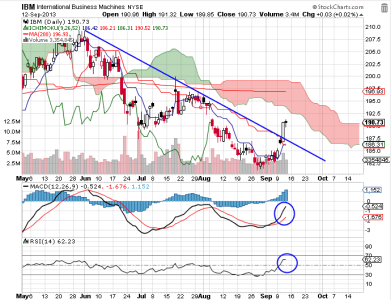
Price of IBM is approaching that lower resistance level (cloud). Momentum remains strong, but perhaps a bit extended. RSI remains strong, but may be slowing down. The cloud suggest price will peak soon and head lower again. Perhaps, but that is why we have breakouts. I left the technical down trend line drawn in the chart to show that price already broke out to the upside from that perspective. And with underlying support for the market at strong levels currently, there is a good chance for price to continue rising. But don't forget about the weak seasonality. At some point it may become a factor again. That's why I am looking at these plays as short term plays.

MCD.png

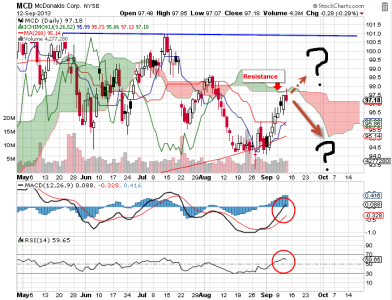
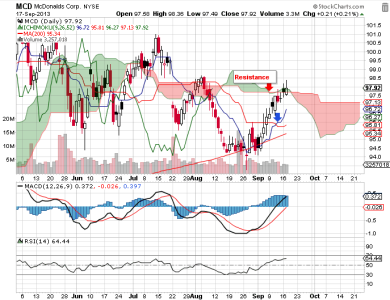
MCD is now reaching resistance. There isn't much resistance for price to punch through, but if it doesn't get above resistance, the Leading Span B line suggests price will fall.
 
CLX.png

After finding support along its 200 day moving average, CLX has pushed through the first area of resistance (Leading Span B), crossed the Standard Line (weak bullish cross) and has bounced off the Leading Span A Line (resistance) the past two trading days. MACD still shows upside momentum and RSI is positive, but price could turn back down soon if it can't break through resistance. Technically, CLK is in an intermediate term downtrend and seasonality is weak, so I'd be inclined to sell for a short term gain.

IBM.png

Price of IBM is now skirting along resistance at the Leading Span A line. The Turning line did cross the Standard line, which was mildly bullish and momentum is positive, RSI is hinting that it may turn down. IBM remains in an intermediate term downtrend and with seasonality being weak, I'd be looking to sell IBM for a short term gain here.

MCD.png

Price of MCD is hitting resistance in a thin area of the cloud. If it can close above it, that would be bullish, but I'd have to see the lagging line close above the cloud as well in order to confirm the break out. Momentum remains positive and RSI is still showing strength so this one may be worth sitting on to see if it can break out, but I'd not be overly patient given seasonality.

UL.png

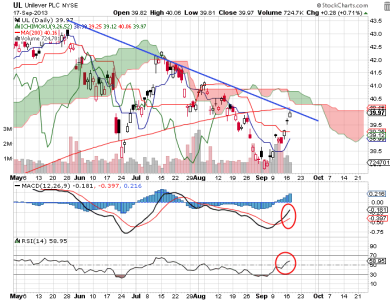
Price of UL is not hitting technical resistance just below the cloud. Momentum is still positive and pointing higher as is RSI, but it's approaching both its 200 day moving average and resistance at the cloud. Like the other three stocks above, UL is still in an intermediate term downtrend in a weak seasonal period, so I'd not be too patient in taking profits, although I see no sign that price is turning just yet.
 
At yesterday's close, our auto-tracker is now showing a total stock allocation of 40.2%. We are still dropping our exposure. Statistically, when that exposure level drops below 40% the market tends to go higher. We are probably close enough to be wary of a big move to the upside. Underlying market support has not gone away either.
 
Now that the taper-talk is out of the way, just about every stock and fund that I track is green across the board. Seems all boats are now being lifted again.
 
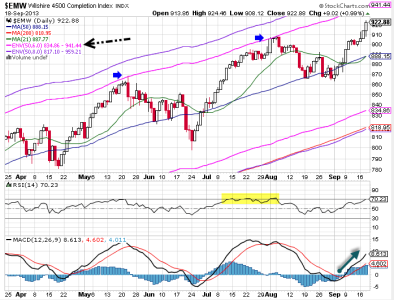
So now that the Fed is not going to taper anytime soon, how much more upside might we see? Given underlying market support is very strong, I am keeping my eye on the below chart. You've seen it before.

EMW.png

Rule of thumb: If price reaches 6% above the 50 dma, a correction can happen. If it reaches 8%, the odds favor a snap back to at least the 50 dma.

The 6% mark is currently 941.44 for the Wilshire 4500 (black arrow). You can see that when price reached this level previously, a decline was near (blue arrows).

As of yesterday, RSI is in an overbought condition, but I think it will remain in this area for a period of time (as long as liquidity remains at higher levels). We can see how this overbought condition can last for weeks (yellow highlighted area on RSI). Momentum has not reached its previous high levels from the last two up legs. So I am anticipating more upside with a potential target above 944 and possibly above 950 in the intermediate term. Now seasonality does remain weak, but that is not an issue under current market conditions. It may become one down the road, but as of right now it's not. Keep in mind we are now nearing the end of the quarter, which is likely to see money managers who have been missing this upside action begin pouring funds into the market over the next few trading days (window dressing). Things can change if sentiment gets bullish fast, but so far that remains to be seen.
 
Coolhand ... Thanks for the analysis. I'm enjoying reading your posts here and in the Premium area.

I didn't feel comfortable trading the Fed yesterday and decided to sit in G. What do you think about chasing the current action in C and S ... or would it be wiser to wait for a pullback ... assuming one comes!
 
Friend, you'll be 2 feet deep in snow before any pull back developes - the bull wants you to stay in G where there is the comfort of warmth.
 
Hi CH, do you consider what is going on politically when entering or exiting market? Or do base that strictly on technical indicators?

Generally, I do not take politics into consideration, although it could be part of an overall risk management strategy because some political events can influence market behavior to some degree. But I'd not give a lot of weight to it. Sentiment and technical indicators are largely what I use.
 
Thanks! I have been thinking about that.. Probably should not have gotten out on Tuesday... Even if QEHad started and market dropped. I was trying to prevent my error in June as I thought to get out before Fed talk and then when market fell, I jumped out.... Ouch! So now here I am with the exact opposite scenario, lost out as Fed news had opposite effect, and now need to find a re-entry point. Bollingers still look like there is more upside, I am considering a re-entry if it looks like a drop will occur tomorrow or Monday. I' m working to refine my strategy a bit more to use more EMAs and ignore most of the political stuff.
 
SPXI.png

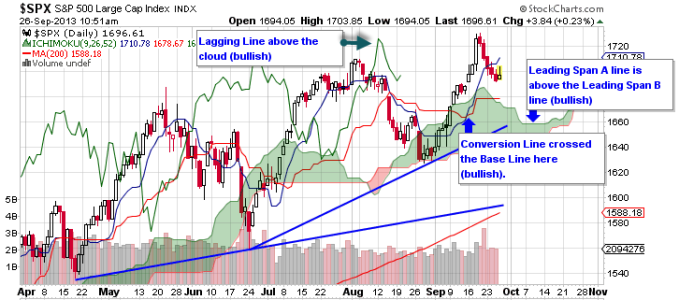
I keep seeing a bearish tone among traders during the current period of weakness that the market is experiencing, but looking at the chart of the S&P, pretty much all indicators are still bullish. And the Wilshire is even more bullish than the S&P.

I think part of the reason for the current weakness may have to do with political factors now playing out in D.C. But certainly some consolidation was needed after the previous up leg too. Interest rates are steadily dropping as well, which is bullish at least on some level.

Our auto-tracker continues to see folks dropping stock exposure too, which is bullish. It will be interesting to see how sentiment comes in.
 
Back
Top