-
The Forum works well on MOBILE devices without an app: Just go to: https://forum.tsptalk.com
-
Please read our AutoTracker policy on the IFT deadline and remaining active. Thanks!
-
$ - Premium Service Content (Info) | AutoTracker Monthly Winners | Is Gmail et al, Blocking Our emails?
Find us on: Facebook & X | Posting Copyrighted Material
-
Join the TSP Talk AutoTracker: How to Get Started | Login | Main AutoTracker Page
You are using an out of date browser. It may not display this or other websites correctly.
You should upgrade or use an alternative browser.
You should upgrade or use an alternative browser.
coolhand's Account Talk
- Thread starter coolhand
- Start date
coolhand
TSP Legend
- Reaction score
- 530
Thank you for posting CH... I like your new "cloud type" graphs with extra baselines, etc.,
I was looking for another set of indicators to go with what I was currently using. I thought maybe there was something out there that provided more information or at least context when looking at a chart and the Ichimoku indicators did that very well. There are numerous signals that can be derived from that system. I find it helps me visualize entry and exit points better.
coolhand
TSP Legend
- Reaction score
- 530
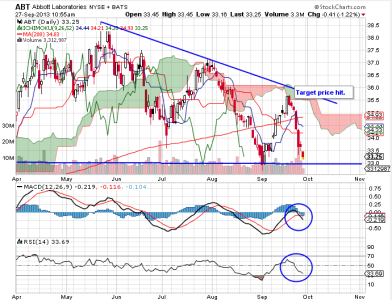
After hitting a target price right at the Leading Span B line, ABT has retraced most of its previous gains and is nearing support again in the $33 area. The technical indicators (MACD and RSI) are still pointing lower and we remain in the weak seasonal period, so support may or may not hold this time around. Price is already attractive for a longer term buy and hold play on this one, but I'd watch the technicals to try and optimize an entry.
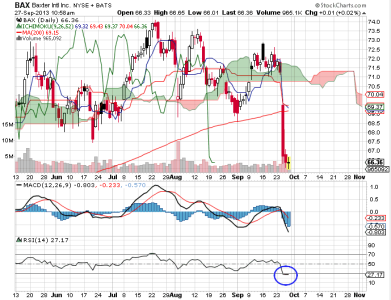
Baxter International got hammered earlier this week and is now priced lower than it's been in over 6 months. RSI is showing an oversold condition, but price has really not turned back up yet. This is another good stock that's beginning to get undervalued.
coolhand
TSP Legend
- Reaction score
- 530
One of the stocks that I own (BP) jumped in price this morning after a U.S. court halted some settlements related to claims over the oil spill in the Gulf of Mexico in 2010. BP said in a statement that the ruling "affirms what BP has been saying since the beginning: claimants should not be paid for fictitious or wholly non-existent losses."
If and when BP gets past the bulk of the oil spill fall-out, I expect price to pop much higher. That is likely still some time out (probably 2 or more years) but they pay a nice dividend while I'm waiting.
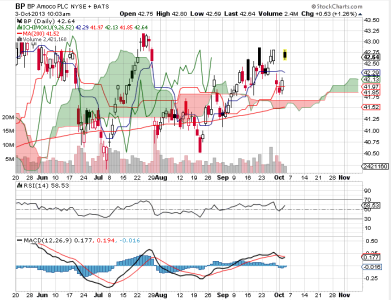
The chart is generally bullish, but there is no clear intermediate term trend as price has been range-bound for months.
If and when BP gets past the bulk of the oil spill fall-out, I expect price to pop much higher. That is likely still some time out (probably 2 or more years) but they pay a nice dividend while I'm waiting.

The chart is generally bullish, but there is no clear intermediate term trend as price has been range-bound for months.
coolhand
TSP Legend
- Reaction score
- 530
Baxter International is one of the stocks in my model portfolio and it's been beaten down of late.
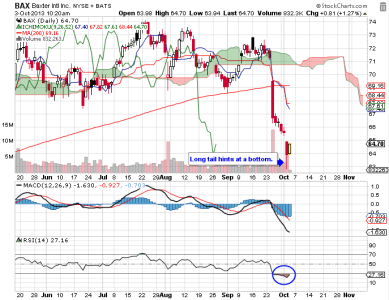
The chart is still bearish overall, but yesterday's candlestick had a long tail that hints that at least a short term bottom may be in. RSI is still in an oversold condition and but momentum is sill very negative. Seasonality is still an issue too, as we've yet to have a large correction, but a lot of stocks are not participating in the overall uptrend of this market. So there are some longer term buy and hold stocks like this one that are looking more attractive.

The chart is still bearish overall, but yesterday's candlestick had a long tail that hints that at least a short term bottom may be in. RSI is still in an oversold condition and but momentum is sill very negative. Seasonality is still an issue too, as we've yet to have a large correction, but a lot of stocks are not participating in the overall uptrend of this market. So there are some longer term buy and hold stocks like this one that are looking more attractive.
coolhand
TSP Legend
- Reaction score
- 530
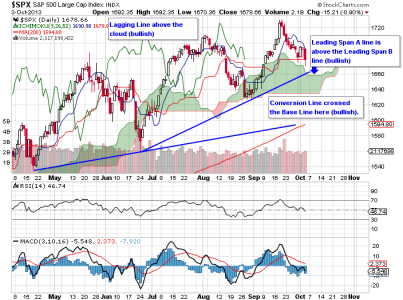
Did today's action get your attention? Feeling more bearish or do you want to buy the dip? The chart of the S&P is still bullish overall. I said in my last analysis that I anticipated more downside to come and that the Leading Span A line was a likely area to test support (in the 1660 area). We aren't there yet, but it's getting close. Notice that trend line support in the same area. This market has been putting in higher lows all year. Is this another one?
While the chart is technically bullish in some ways, RSI is now negative and MACD is negative as well. My intermediate term system is still positive, but not by much. Bonds are holding their own. It isn't like fear is forcing money into those instruments the way it did many months ago. VIX is higher than it's been since late June. And seasonality is still negative.
Sentiment? AAII is neutral. But our own survey is very bullish if current numbers hold close to where they are currently (65% bears). The auto-tracker is back over 40% stocks, but not by much, so there is some measure of dip buying on.
And then there's the political battle over the shutdown with the debt ceiling debate (fight) on the horizon. Politics may indeed become an issue for the market. And you can't trade it.
Normally, with the sentiment and technical picture readings I have right now, I'd be bullish for next week. And that may be the right call. But the political unknowns make me disinclined to make any big bets on how that is going to play out.
coolhand
TSP Legend
- Reaction score
- 530
Just wanted to point out that there is every possibility that any deal reached in Congress, be it short term or otherwise, could be a "sell the news" event. The logic that the market will rally on such an announcement is very appealing. But what if it doesn't? Do we have a rumor being bought right now?
Just saying.
Just saying.
Bquat
TSP Talk Royalty
- Reaction score
- 716
Yes this is a possibility. I agree it may be mostly buy the rumor but it's the talk of tapering the taper for a year, also.Just wanted to point out that there is every possibility that any deal reached in Congress, be it short term or otherwise, could be a "sell the news" event. The logic that the market will rally on such an announcement is very appealing. But what if it doesn't? Do we have a rumor being bought right now?
Just saying.
coolhand
TSP Legend
- Reaction score
- 530
Yes this is a possibility. I agree it may be mostly buy the rumor but it's the talk of tapering the taper for a year, also.
There are so many cross-currents right now. Grab some popcorn. Things could get wild.
JTH
TSP Legend
- Reaction score
- 1,158
Just wanted to point out that there is every possibility that any deal reached in Congress, be it short term or otherwise, could be a "sell the news" event. The logic that the market will rally on such an announcement is very appealing. But what if it doesn't? Do we have a rumor being bought right now?
Just saying.
I agree, I think the rumor is being bought right now, if a deal isn't reached over the weekend it's bad, if a deal does get reached it's just as bad...
coolhand
TSP Legend
- Reaction score
- 530
Just like that...Poof!...it's gone.
Today's rally coaxed some of the folks in the Top 50 that were sitting in the G fund to jump back into the market. Total stock allocations jumped from 74% back to 90%. So the tentative buy signal for next week is out of play again. But other surveys got more bearish, so sentiment is more supportive today than it was the past few trading days, but still not uniformly so.
Watch out for the news driven volatility. I'm really not particularly trusting of this market right now, but will retain a 40% stock exposure at this point and look for the next opportunity to redeploy some capital.
coolhand
TSP Legend
- Reaction score
- 530
View attachment 25281
After finding support along its 200 day moving average, CLX has pushed through the first area of resistance (Leading Span B), crossed the Standard Line (weak bullish cross) and has bounced off the Leading Span A Line (resistance) the past two trading days. MACD still shows upside momentum and RSI is positive, but price could turn back down soon if it can't break through resistance. Technically, CLK is in an intermediate term downtrend and seasonality is weak, so I'd be inclined to sell for a short term gain.
I don't get a lot of time to post during the day (I still have a day job), but when I get a chance and want to share something I try to do at least a quick post.
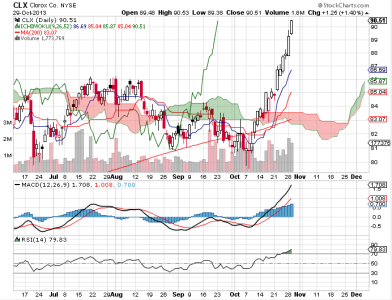
Back in September I showed a chart of CLX and while I don't currently have it as one of my model portfolio stocks, I track it nonetheless. It's a good long term buy and hold stock. As I mentioned in September's post, price had to get above the cloud (resistance) if it was to attempt to break out of its downtrend. It took a few more weeks, but look at the move it's made of late. That's what I like about large, solid, dividend companies. They don't generally fall apart. Patience is often rewarded in this market sector.
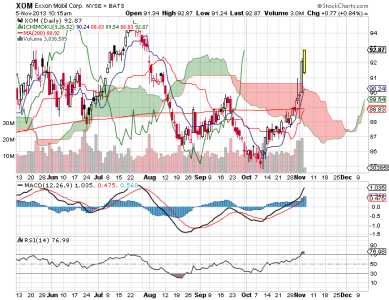
As you may know, I bought IBM last week and it's making a move higher currently. BP, another stock I own, is breaking out. If you had bought Nestle a while back, you'd be in the money too. ABT, UL, and Coke are moving up too. Yesterday, I bought EXC, which I have been pointing out in my premium service was at multi-year lows. It appears to be trying to breakout now too. Here's some updated charts:
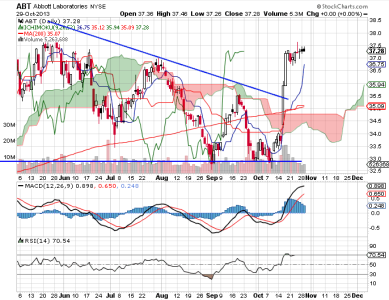
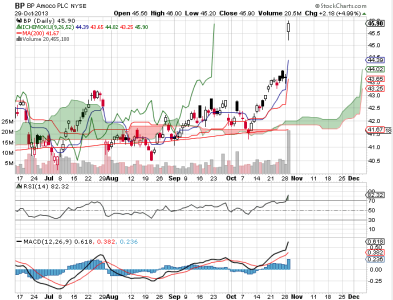
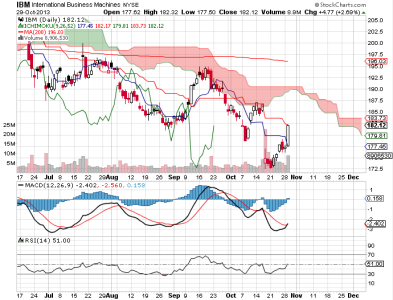
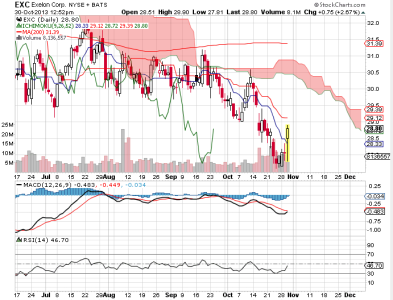
I know many of you are focused on leveraged instruments, but there are other, less stressful opportunities. I would recommend allocating some of your portfolio to another strategy such as dividend investing. It's another way to diversify your risk. By the way, I bought some EXC yesterday.
Last edited:
MrJohnRoss
Market Veteran
- Reaction score
- 58
"I know many of you are focused on leveraged instruments, but there are other, less stressful opportunities. I would recommend allocating some of your portfolio to another strategy such as dividend investing. It's another way to diversify your risk."
I agree Jim. In fact, I think it should be a MAJORITY of your portfolio. Leveraged investments should only be a small portion (10% or less) of your overall portfolio.
I agree Jim. In fact, I think it should be a MAJORITY of your portfolio. Leveraged investments should only be a small portion (10% or less) of your overall portfolio.
coolhand
TSP Legend
- Reaction score
- 530
"I know many of you are focused on leveraged instruments, but there are other, less stressful opportunities. I would recommend allocating some of your portfolio to another strategy such as dividend investing. It's another way to diversify your risk."
I agree Jim. In fact, I think it should be a MAJORITY of your portfolio. Leveraged investments should only be a small portion (10% or less) of your overall portfolio.
I concur. I think I've only played a leveraged fund once or twice this year. And not big bets. I have much more success with individual stocks.
bmneveu
TSP Pro
- Reaction score
- 91
View attachment 25695
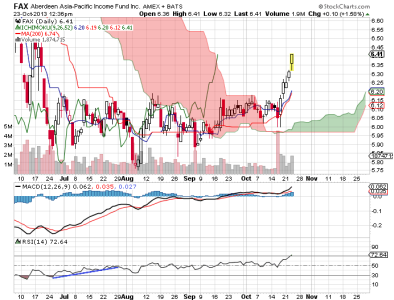
After tracking sideways in the low $6s for several months, it looks like FAX is coming back to life. The chart looks bullish again for the longer term (weeks to months).
The bull flag has formed and looks like a nice buying opportunity here.
coolhand
TSP Legend
- Reaction score
- 530
I'm not seeing a lot of short term trades that I like, but here's two charts that may be good short term plays.
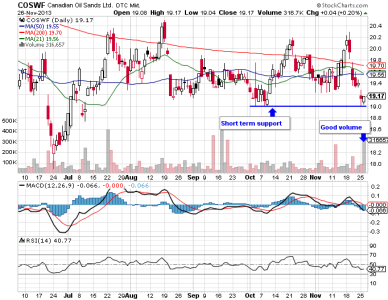
COSWF had good volume today and price seems to finding support around $19. MACD and RSI have not yet turned, but the stock could turn up quickly before the indicators do. Assuming of course, that it turns at all. I'd look for resistance around the 200 day moving average. Not a big play, but I thought I'd mention it.
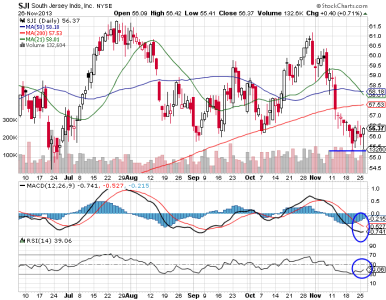
SJI looks like a better short term play than COSWF. Price appears to finding support around $55.50. Note the long tail on today's white candlestick. That's bullish. MACD looks like it may be beginning to turn back up, while RSI is already picking up, although it is still negative overall. I think I'd target the $59 area on this one.
I'd not be overly patient with either stock.

COSWF had good volume today and price seems to finding support around $19. MACD and RSI have not yet turned, but the stock could turn up quickly before the indicators do. Assuming of course, that it turns at all. I'd look for resistance around the 200 day moving average. Not a big play, but I thought I'd mention it.

SJI looks like a better short term play than COSWF. Price appears to finding support around $55.50. Note the long tail on today's white candlestick. That's bullish. MACD looks like it may be beginning to turn back up, while RSI is already picking up, although it is still negative overall. I think I'd target the $59 area on this one.
I'd not be overly patient with either stock.
Similar threads
- Replies
- 0
- Views
- 152
- Replies
- 0
- Views
- 168
- Replies
- 0
- Views
- 118
- Replies
- 0
- Views
- 129
- Replies
- 0
- Views
- 82

