-
The Forum works well on MOBILE devices without an app: Just go to: https://forum.tsptalk.com
-
Please read our AutoTracker policy on the IFT deadline and remaining active. Thanks!
-
$ - Premium Service Content (Info) | AutoTracker Monthly Winners | Is Gmail et al, Blocking Our emails?
Find us on: Facebook & X | Posting Copyrighted Material
-
Join the TSP Talk AutoTracker: How to Get Started | Login | Main AutoTracker Page
You are using an out of date browser. It may not display this or other websites correctly.
You should upgrade or use an alternative browser.
You should upgrade or use an alternative browser.
coolhand's Account Talk
- Thread starter coolhand
- Start date
coolhand
TSP Legend
- Reaction score
- 530
Good morning coolhand! Your inbox is full so I am posting this here.
In your IFT alert you have [TABLE="width: 100%"]
[TR]
[TD="width: 98"]12/23/2013
[/TD]
[TD="width: 189, align: left"]30% G, 35% C, 35% S, 10% I
[/TD]
[/TR]
[/TABLE]
This adds up to 110%. I see on the Autotracker that you meant for it to be 25% S though. Following you in this move and thank you for your commentary. I don't know what I'm going to read once your service is not in free trial anymore haha.
Take care and Merry Christmas,
Jared
Jared,
Thanks for pointing out my full inbox. I didn't realize how long it had been since I cleaned it up.
I hope you have a Merry Christmas and Happy New Year!
Jim
coolhand
TSP Legend
- Reaction score
- 530
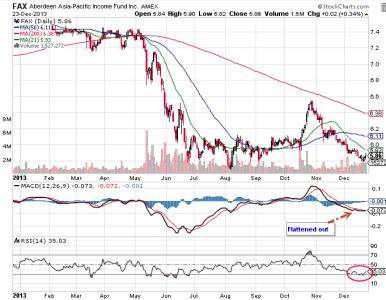
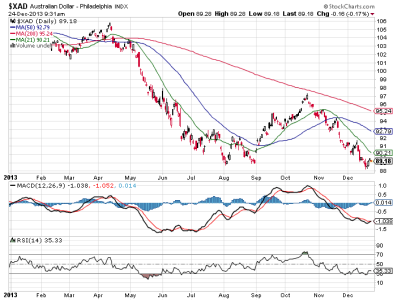
Update on FAX. I bought another chunk of FAX yesterday (doubled my shares). Take a look at the two charts below. The first is FAX, the other is the Australian Dollar.


It's a bit early to read too much into these charts just yet, but FAX may be exiting an oversold condition and turning higher.
I would pay particular attention to the AUD, because that has a significant impact on the price of FAX. MACD may be about to have a positive signal line cross. If it does, and the Australian Dollar begins to appreciate again, FAX should rise with it.
AUD is near 2 year lows now and I don't expect it to fall much further than it already had earlier in the year. If it tests support at all. I'm am looking for a test of the 200 day moving average in the weeks ahead. That should help FAX get back to about $6.40. or so.
That's the technical picture I see currently. FAX is paying a monthly yield of about 7.2% at current price.
Last edited:
coolhand
TSP Legend
- Reaction score
- 530
As a follow up on FAX, the link below is a short article taken from "The Sydney Morning Herald". They are saying that the world’s biggest money manager BlackRock sees the Australia dollar falling another 10 per cent due to disappointing economic growth forces. The Aussie Central Bank is cutting its benchmark rate to as low as 2%. The news outlet also cites mining investment as part of the reason for the decline in their currency.
Aussie dollar headed for US80¢ with RBA to cut rates again, says BlackRock
I am in the fund for the longer term myself. At some point, the global economy will start to recover at a more brisk pace and as that happens rates will start to rise again along with some currencies. Mining should pick back up again too. Even if it takes more than a couple of years, the fund is currently paying about a 7.25% monthly dividend and that would largely offset much of the downside in capital. Then, when it turns the other way, capital appreciation should launch the fund higher. Of course, the exposure to the Aussie Dollar is only part of what this fund invests in as it is also exposed to the Asian debt market. Another variable is management. It is considered pretty competent and they could make some adjustments to the fund as well. Whether or not they do is an unknown.
It's all speculation to some extent as timelines and expectations are not easily predicted.
coolhand
TSP Legend
- Reaction score
- 530
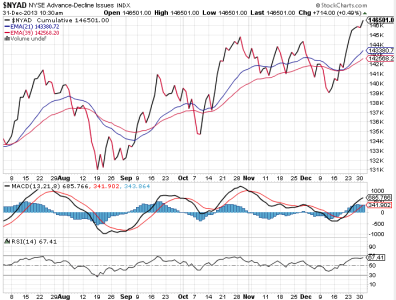
As we wind down this year's trading today, I wanted to point out that liquidity remains at very high levels. It may sound like I am beating a dead horse, but those printing presses trump a lot of stuff, including overly bullish sentiment. The below chart is one that I watch every day. It does not directly measure liquidity, but it does a good job of giving you a sense of what those levels are doing. It won't work forever. Only as long as this market relies on liquidity for its cues to direction. And right now that chart appears to suggest we are going into the New Year loaded for bear. The first trading day of any month has a good chance of seeing a gap higher. So given where liquidity is right now, I'd not be surprised if we open 2014 to the upside.


MrJohnRoss
Market Veteran
- Reaction score
- 58
I agree. $75 Billion a month (or whatever the real number is) is still a TON of money entering the markets.
DreamboatAnnie
TSP Legend
- Reaction score
- 847
Thanks for the info Coolhand! I was about to call in a bailout... but I am going to wait after seeing that chart. I was looking at the high bullish sentiment and Price up so high along the upper BBs and thinking its coming down. But then again the BBs are still expanding.... so thinking to hold off a few more days. Thanks for this new tool.... love it!As we wind down this year's trading today, I wanted to point out that liquidity remains at very high levels. It may sound like I am beating a dead horse, but those printing presses trump a lot of stuff, including overly bullish sentiment. The below chart is one that I watch every day. It does not directly measure liquidity, but it does a good job of giving you a sense of what those levels are doing. It won't work forever. Only as long as this market relies on liquidity for its cues to direction. And right now that chart appears to suggest we are going into the New Year loaded for bear. The first trading day of any month has a good chance of seeing a gap higher. So given where liquidity is right now, I'd not be surprised if we open 2014 to the upside.
View attachment 26478
Boghie
Market Veteran
- Reaction score
- 363
CoolHand,
I don't think a reduction in the growth of liquidity will cause even a burp. I believe the FED could reduce their buying by $5-$10 Billion a month and not affect things. We don't need it. And, besides, there is an enormous amount of pent up liquidity sitting on the banks balance sheets just waiting to be borrowed. I think the draw down of QE is a very good thing for the economy - even as it is a very bad thing for Federal Gubmint 'financing'.
Now, when we start approaching $0 in QE and the FED yammers about increasing interest rates things could change rapidly. We shall see...
But for now, why the He!! do I have any assets in the 'G Fund'. Yowser...
burrocrat
TSP Talk Royalty
- Reaction score
- 162
I agree. $75 Billion a month (or whatever the real number is) is still a TON of money entering the markets.
actually, it's 82,500 tons of money entering the market every month. 1 dollar bill is 1 gram and 454 bills is a pound so 1 million dollar bills is about 2,200 pounds and 75 billion dollar bills equals about 82,500 tons. of money. per month.
fortunately, the human brain has trouble wrapping around big numbers like that and they can move it around in a digital flash via ones and zeros on a keyboard or else there would be a shortage of trucks to haul it between 33 liberty street and goldman sachs, jp morgan, et al.
JTH
TSP Legend
- Reaction score
- 1,158
I know we had some folks in the forum pick up CISCO off the gap-down, I imagine this trade is starting to work for them...
View attachment 26482
View attachment 26482
coolhand
TSP Legend
- Reaction score
- 530
I know we had some folks in the forum pick up CISCO off the gap-down, I imagine this trade is starting to work for them...
View attachment 26482
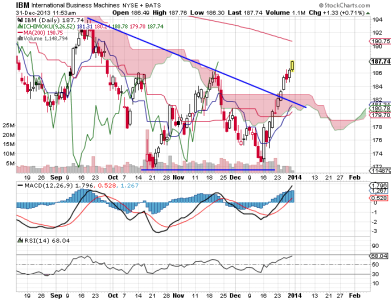
This one and IBM! Among others.

MrJohnRoss
Market Veteran
- Reaction score
- 58
Look at that trajectory!
MrJohnRoss
Market Veteran
- Reaction score
- 58
Jim,
Thanks for all your exceptional charts and analysis over the past year. Wishing you much success and happiness in 2014.
JR
Thanks for all your exceptional charts and analysis over the past year. Wishing you much success and happiness in 2014.
JR
coolhand
TSP Legend
- Reaction score
- 530
Jim,
Thanks for all your exceptional charts and analysis over the past year. Wishing you much success and happiness in 2014.
JR
Thanks John. I always enjoy your charts and analysis too. Wishing you and everyone else out there a happy, prosperous, and healthy New Year!
coolhand
TSP Legend
- Reaction score
- 530
"IF" this happens, all bets are off. Take it with a grain of salt, but it is plausible.
10% Savings Confiscation? - Traders-Talk.com
10% Savings Confiscation? - Traders-Talk.com
"IF" this happens, all bets are off. Take it with a grain of salt, but it is plausible.
10% Savings Confiscation? - Traders-Talk.com
Pretty far-fetched...nay, fantastical! To think the Euros could get their act together in unison to pull this type of stunt beggars belief. They can't agree on anything, much less anything approaching the grandiosity of what Armstrong pitched to generate clicks to his site. Rubbish, I say!
coolhand
TSP Legend
- Reaction score
- 530
Pretty far-fetched...nay, fantastical! To think the Euros could get their act together in unison to pull this type of stunt beggars belief. They can't agree on anything, much less anything approaching the grandiosity of what Armstrong pitched to generate clicks to his site. Rubbish, I say!
I hope so. The author is known for controversial points of view.
Similar threads
- Replies
- 0
- Views
- 152
- Replies
- 0
- Views
- 169
- Replies
- 0
- Views
- 118
- Replies
- 0
- Views
- 129
- Replies
- 0
- Views
- 83
