coolhand's Account Talk

OK, why does our script and database say he has 5042 posts? Technical difficulties! I'll take a look. Congrats anyway. :)
 
Perhaps some animal spirits kicking in coming out of the bond market - this may just be the beginning. Someone is pulling the trigger.
 
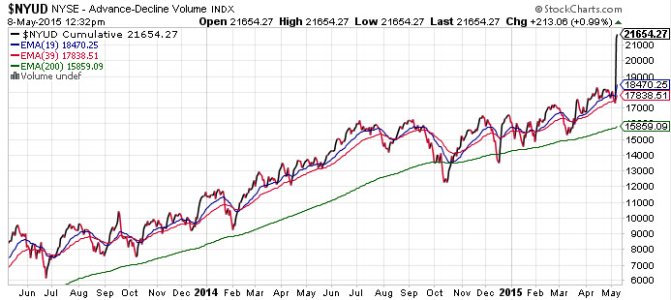
NYUD is a method of keeping track of volume by subtracting down volume from up volume; in this case it's on the NYSE. The net result is a number that is either above the zero line (more up volume than down volume) or below the zero line (more down volume than up volume). In the first 60-90 minutes of the trading day, the majority of days it sets the tone for what volume is going to do for the remainder of the session and is extremely reluctant to change. Once the direction has been established for the day, there is often a huge volume burst in the final few minutes of trading which 'finalizes' that trend for the day. Let's see how it ends today. At the moment, the S&P 500 is about 1 point from closing at a fresh all-time high.

Also, I do not think the apparent spike in NYUD is accurate today. It's likely got some corrupt data. It should get corrected sometime after the close.
 
NYUD.png

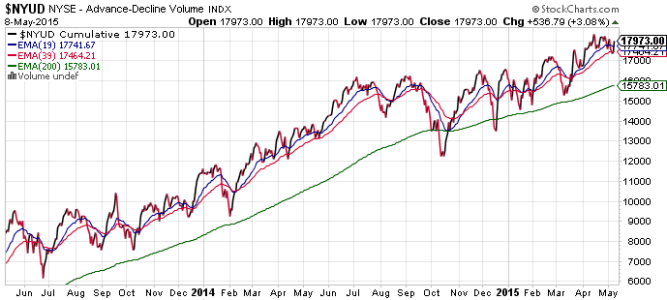
They finally corrected NYUD. My take on Friday's rally is that it appears to be setting the stage for another attempt to take out the all-time on the S&P 500. A close well above 2120 is required. The next couple of trading days should be interesting.
 
View attachment 33681

They finally corrected NYUD. My take on Friday's rally is that it appears to be setting the stage for another attempt to take out the all-time on the S&P 500. A close well above 2120 is required. The next couple of trading days should be interesting.

Coolhand,

Thanks for clarifying yesterday's post, because this is an excellent indicator.
 
Thanks for the post! I forgot all about NYUD. I used to look at it every morning when we had daily trades....now if only I can figure out how to use it with 2 trades a month!
 
NYUD is a method of keeping track of volume by subtracting down volume from up volume; in this case it's on the NYSE. The net result is a number that is either above the zero line (more up volume than down volume) or below the zero line (more down volume than up volume). In the first 60-90 minutes of the trading day, the majority of days it sets the tone for what volume is going to do for the remainder of the session and is extremely reluctant to change. Once the direction has been established for the day, there is often a huge volume burst in the final few minutes of trading which 'finalizes' that trend for the day. Let's see how it ends today. At the moment, the S&P 500 is about 1 point from closing at a fresh all-time high.

Also, I do not think the apparent spike in NYUD is accurate today. It's likely got some corrupt data. It should get corrected sometime after the close.
Was re-reading some of your posts and this one is very interesting. Thank you!

it looks like NYUD Advance Decline Volume chart (on NYSE pricing you showed earlier) means volume is advancing upward more than it is decreasing. So, if this chart is upward in morning does this mean the volume also tends to end the way that day (because of the late day advance that tends to happen)?? But as for price, high volume just means big moves ...not price direction. Right? But it sounds like this is telltale on price direction. If so this would be awesome to study each morning if wanting To buy or sell.
 
Last edited:
Thanks for the post! I forgot all about NYUD. I used to look at it every morning when we had daily trades....now if only I can figure out how to use it with 2 trades a month!

Mcqlives,

As a reference point, I will appreciate if you can explain how you used NYUD for daily trades, what helpful signs you were looking for, and how effective indicator did you find it for your daily trades? Tia.
 
Back
Top