coolhand's Account Talk

They started paying quarterly dividends last August. Apple Inc. (AAPL) Dividend History - dividata.com

Hopefully they can be consistent with the payouts and even increase the dividends over time.

And ironically, initial bounce aside, the stock has been pretty stinky ever since. I do agree that it is starting to look attractive now and I'm very tempted to add it to my buy and hold account...thinking good income/nest building material.
 
And ironically, initial bounce aside, the stock has been pretty stinky ever since. I do agree that it is starting to look attractive now and I'm very tempted to add it to my buy and hold account...thinking good income/nest building material.

That's exactly my message. I don't like to "trade" my IRAs, I like to "manage" them by buying good companies that pay out dividends. So I look for undervalued stocks (according to Morningstar), read the analysis, and gauge "reasonable" entry points for long term appreciation. Obviously there's still risk involved with any purchase, but by concentrating on proven performers I expect to mitigate risk.
 
7-2-2013 18-09-12 PM.png

I posted this chart four trading days ago and price has advanced four straight days since. MACD is about to have a signal line cross and RSI just did manage to go positive today. It's approaching resistance, but I think it should at least tag the 50 day moving average in the short term.
 
Thanks for the words of support everyone. :)

If I didn't have this day job thing I could be more active, but I'm working on fixing that situation. :D

Please offer any feedback over the months ahead as I'm always looking for ways to improve.
 
I've been pretty busy at work and darn tired by the time I get home, so I've not had a lot of time to do much posting of late. So here's a quick post.

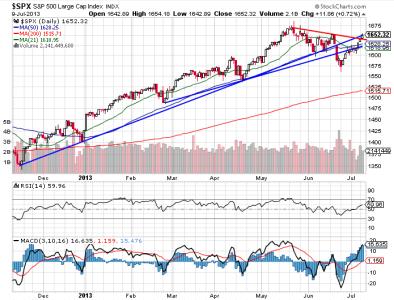
7-9-2013 18-11-09 PM.png

The S&P 500 has had an impressive run since reversing off the 38% Fib retracement two weeks ago. It has yet to close at another all-time high (the Wilshire 4500 closed at a new high today), but it's been climbing through resistance like a hot knife through butter. But there are several gaps in this latest run and those "will" get filled. Probably sooner rather than later. But then, I'm stating the obvious and the obvious can be used as bait to draw in the unsuspecting. The trend has been turned and what I find somewhat interesting is that this rally has not had anywhere near the liquidity injections that were seen for months on end earlier in the year. Just an observation.

I did a quick check of the auto-tracker and found that both the Top 50 and the Total Tracker are showing modest profit taking as total stock exposure is falling (again, modestly). However, as of yesterday the Total Tracker is now down to a total stock allocation of 41.31% and that's not bearish. Statistically, if gets below 40% the odds of more upside increase, but it's low enough now that I'd expect the downside to be limited at the very least. Dips should probably get bought provided sentiment doesn't get bulled up too quickly. Note that this is a very short term perspective, as we are still in a seasonally weak time of year. I'd not be surprised if we test the lows again at some point.
 
Thanks for the update Coolhand. Been following you for about a month now, both here and on the premium service. I've really learned alot. Love the charts and the commentary. Keep up the great work!:)
 
Quick update. Liquidity is rising this week. It's not massive, but it's rising none-the-less. This is a very tricky market. I'm still 100% G fund, but that's largely because I was out of IFTs when the rally started and my intermediate term system remains on sell as of yesterday (barely, but still a sell). Having just 2 IFTs forces me to be very careful how I use them this early in the month because I'd be very surprised if we don't get some "real" selling pressure before the month is done. That's too far out for me to gauge right now, but I will also say that my intermediate term system is prone to whipsaws in fast moving action like this. Just when it flips to buy is when things may turn again. Not to mention we're at the top of the Bollinger bands as well.
 
Quick update. Liquidity is rising this week. It's not massive, but it's rising none-the-less. This is a very tricky market. I'm still 100% G fund, but that's largely because I was out of IFTs when the rally started and my intermediate term system remains on sell as of yesterday (barely, but still a sell). Having just 2 IFTs forces me to be very careful how I use them this early in the month because I'd be very surprised if we don't get some "real" selling pressure before the month is done. That's too far out for me to gauge right now, but I will also say that my intermediate term system is prone to whipsaws in fast moving action like this. Just when it flips to buy is when things may turn again. Not to mention we're at the top of the Bollinger bands as well.

Question from a relative novice Coolhand: how do you determine liquidity levels? I've seen articles about high levels of liquidity, but don't understand how this is measured. Can you point me to a good reference?:)
 
Question from a relative novice Coolhand: how do you determine liquidity levels? I've seen articles about high levels of liquidity, but don't understand how this is measured. Can you point me to a good reference?:)

I keep apprised of liquidity through Marty Chenard's stocktiming.com service. He gets his information from personal sources, so I doubt it's available to most folks. Of course, the main stream media and Fed Chair have been talking about QE and bond purchases for some time so on surface we know it's happening. But actually seeing it in a chart is something that's not readily available except through services like Marty's. You can find limited information on liquidity through the Central Bank web sites too, where they post what's called Permanent Open Market Operations (POMO). I really don't think it's the full picture, but it's something.
 
Here's a couple of stocks that I wanted to update.

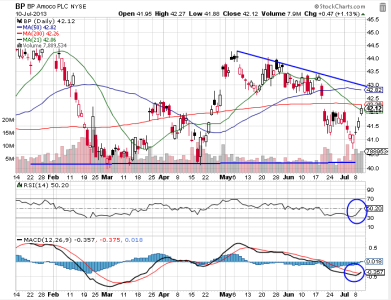
BP.png

I mentioned in my last weekly report that BP was was approaching support and that a buying opportunity may be close. MACD and RSI had not yet turned, but they have now. RSI crossed the centerline yesterday, while MACD appears to be near a signal line crossover. The stock gapped up yesterday and is now just a bit above the 21 day moving average, but still below the 50 and 200. I'm looking for price to reach at least the 50 dma in the short term, but the ex-dividend date is approaching in about a month and that could help propel it past resistance to the $44 area.

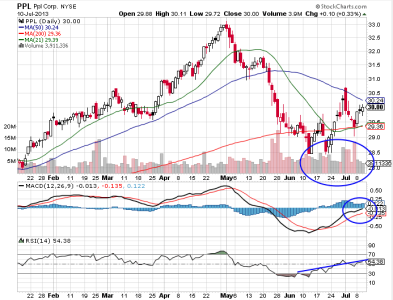
PPL.png

At yesterday's close, PPL was right at my "buy below" limit. I'm seeing accumulation in the volume bars and RSI and MACD are both trending higher.
 
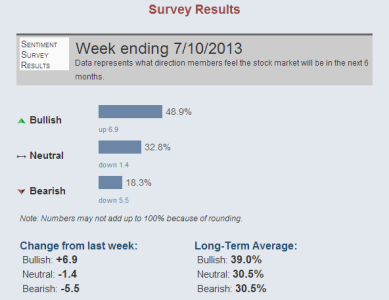
One of the things I mentioned the other day was that this rally could run into problems if sentiment gets too bulled up. We'll, it appears it's getting too bulled up.

AAII Sentiment.png

By itself, the high bullishness shown in the AAII weekly survey is a sell. It appears the market once again believes the Fed has our back. Perhaps so, but in the short term I think sentiment may introduce some volatility into this market. We're certainly due for some profit taking.
 
AAPL.png

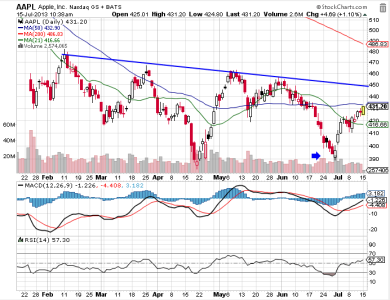
I recommended buying AAPL not long ago (below) when price dipped under $400. Since then, it's appreciated more than 8%. It's bumping up against the 50 day moving average now, but that hasn't stopped it from moving higher previously. Trend line resistance should come in the $450 area. RSI is showing strength and MACD is showing positive momentum and looks to be getting near triggering a positive center line cross. Still looks bullish.

coolhand said:
View attachment 24281

You're probably all familiar with Apple. It's back below $400/share and has the potential to make a double bottom. MACD remains negative and pointing lower, while RSI is very negative and oversold. When those signals finally turn it would be a good place to take a position. One caveat is that the intermediate term is still down and that may continue to put downside pressure on price. But to a longer term investor, that may not matter. Apple pays a quarterly dividend of about 3%.

 
I'm not buying today's dip. We're due for some downside and seasonality is negative. However, as of yesterday there was still significant underlying support (liquidity) coming into this market. I tend to think the downside should be limited, but there were too many bulls in some sentiment surveys so I'm anticipating we'll get a bit more downside than some expect to shake those weak hands.
 
EMW.png

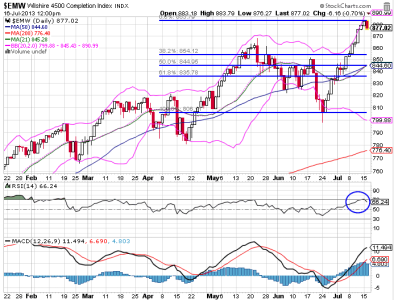
Quick chart to offer some targets. Looking at the Wilshire 4500, I've added some Fib retracement lines to gauge how far a pullback "may" go. I'm thinking 38% may be the deepest we'll see in the short term, but it might not go that low. There may be some support in the 860 area. But heck, the dip buyers may pile in this afternoon and we end the day green anyway. But I have to have a plan just in case.
 
For anyone who is holding shares of AAPL, some analysts are now lowering their 2014 earnings forecast for the company by about 12%. That will more than likely limit its upside potential (price) over the next year or so. That's a pretty big number, 12%. I'm going to remove it from my list of potential purchases as a result of this development. This isn't to say AAPL won't do well moving forward, but risk versus reward just got elevated.
 
View attachment 24526

Quick chart to offer some targets. Looking at the Wilshire 4500, I've added some Fib retracement lines to gauge how far a pullback "may" go. I'm thinking 38% may be the deepest we'll see in the short term, but it might not go that low. There may be some support in the 860 area. But heck, the dip buyers may pile in this afternoon and we end the day green anyway. But I have to have a plan just in case.


Would you buy back in at the 860 level?
 
Would you buy back in at the 860 level?

It's only a technical target right now. But there are other factors to consider as the market plays out day to day before I decide a given technical target is reasonable or not. I know that today Ben Bernanke is speaking later this morning in a semi-annual testimony on monetary policy before the House Financial Services Committee. If anyone can introduce volatility into the market, he can, depending on what he says and how he says it. I still don't think any pullback will be deep at the moment, but we're in the weak part of the 6 month market cycle and there are still some gaps on the S&P at much lower levels that have yet to get filled. Liquidity remains a force, which is certainly providing some measure of support for this market. I also note that sentiment remains on the bullish side overall across several surveys, which is obviously bearish. It's a mixed picture, but as I already stated I think the market finds its feet on any sell off relatively quickly. I'm guessing the "real" selling pressure comes a little further down the road.

More to the point of your question now that I've prefaced it with some commentary; while the 860 level is not an automatic trigger point, I think it would be a reasonable entry level to get at least some market exposure if one is underexposed. The intermediate term is now positive and I have to think there's still more upside to be had. But I personally would not go "all in" at that level. I may put 50% of my G fund holdings into C and S if we get to 860 or lower. That's a personal choice based on my own risk tolerance.
 
Back
Top