coolhand's Account Talk

Good analysis, CH. I agree with your assessments.

One question: Where do you find data to monitor "liquidity levels"?

I have found over the years that very few "professionals" try to navigate their way through the markets without some measure of outside assistance. And like many of them, I too retain premium service support in managing my own portfolio. I do a lot of the heavy lifting myself, but some things are just best paid for.

Marty Chenard at Stocktiming.com has a way of determining liquidity levels. I think I know at least partially how he does it, but I'm not sure of all the moving parts. I recommend his service for those who are at least intermediate level traders. His service would likely overwhelm most novices. One has to understand how to assimilate that kind of data into total market context. And that's easier said than done for many. Folks tend to get lost in various time frames if they don't, and then they'll get frustrated if things aren't working out for them.
 
View attachment 24241

I showed you previously how the May 22nd high turned out to be the turning point in this market by using 6% and 8% envelopes around the 50 dma. This can also work in reverse. The lower envelope shows that 1520 is now 6% below the 50 dma. That could be another target area for a reversal. I actually think it is a more logical target for the intermediate term. But I doubt we get there right away and that 6% level could continue to move lower in the days ahead should the action get choppy, but retain its downward bias.
I forgot to mention one other thing about this chart. Notice that price tagged the lower 6% envelope back in November. That marked the low.
 
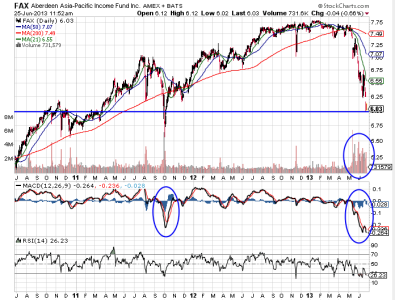
FAX.png

Bonds. This sector has been hit harder in some areas than the stock market. Looking at FAX (and many others look similar) we can see price has fallen a long way in a short period of time. The blue line shows where price is at the moment. Aside from the short term sell off in late 2012, we can see that price has retraced its gains all the way back to March of 2011. It's really over done in the short term. And I note that the sell off in 2012 retraced those losses fairly quickly. That's partly why I'm sitting tight on this fund (as well as some others). It presents a huge buying opportunity for those with the resources to snap them up. These types of opportunities don't come around all that often and this fund in particular has a stellar long term record. I have to accept some measure of currency fluctuations when I invest in an instrument such as this, and as I said, the selling seems to be quite over done at this point. I do note that there was volume behind this move and that MACD is not turning yet. RSI is oversold, but is also not turning. I also note that this funds Net Asset Value is much higher than its current price, and that suggests to me that it won't stay at this level for a long period of time. Unfortunately, the Fed's statements last week have shaken the market, along with speculation of a new Fed chair. How long that keeps the market on uncertain footing is unknown, but if confidence is restored, this fund and many other stocks and bonds will probably rally hard and retrace some measure of current losses. But I have to allow some time for that and we could in fact go lower yet in the weeks ahead.
 
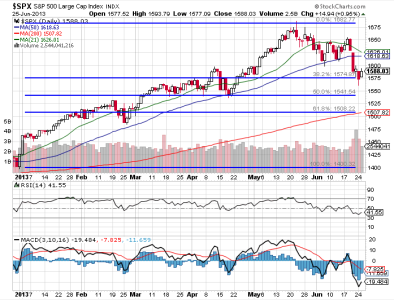
SPX.png

Nothing has changed my previous view after today's trading session. Our sentiment survey was on a buy for this week and I had a Top 50 buy signal as well. Both signals supported a rally this week and now we got it. There may be more too, but it's too early to break out the horns. It does appear we bounced off the 38.2% Fib level and the market did manage to hold onto most of its gains. That's a plus. But bonds were mixed as AGG advanced somewhat modestly, while the yield on the 10 Year Note ticked a bit higher. Underlying support for this market is gone, however, and that means this market will have to find a way to advance on its own. That may be asking a lot. I'm going to be very patient with this market given the negative seasonality too.
 
Your insight and technical analysis on FAX is appreciated CH although scary at the same time. I am holding tight but have to admit I have gotten weak !! If I could I'd consider adding here and average down but I don't think the yield of FAX is worth committing any more $. Thank you.
 
Your insight and technical analysis on FAX is appreciated CH although scary at the same time. I am holding tight but have to admit I have gotten weak !! If I could I'd consider adding here and average down but I don't think the yield of FAX is worth committing any more $. Thank you.

It's the uncertainty of the Fed that's the biggest problem. And we're in a negative seasonal period too. Any fund or stock that I buy in my IRAs I expect to hold for the longer term. Let's say at least one year. So I try to buy quality stocks and bonds that appeal to discerning investors. I focus on yield too, as that's another element that tends to attract buyers. I don't purchase anything unless I think it's undervalued and ready to appreciate soon. That's how I try to control risk. The current situation with the Fed has generated quite a shake up in the bond market, however. For longer term investors, that's generally not a problem as time is usually on their side. Diversification helps a lot too. While I'm taking a beating in FAX and ESD right now, some of the stocks I'm still holding, such as KO, BP, SO and PPL, are either near my original buy point, or still in the green (in spite of recent weakness). So if the market throws me a curve ball, like the one we've got now, I don't get shellacked as bad as those who bought closer to the highs.

Also, underlying support for this market is gone at the moment and in fact it's now in contraction. And that's going to make stock picking right now much more challenging. So I'm not posting much in the way of stock picks at the moment, in spite of many of them really offering good value right now. I think they'll be even better buying opportunities over the next few weeks. So when the market is ready to roll back over to an intermediate term up swing, it'll be time to add to the portfolio once again.

As far as short term trading goes with my picks, they often work out under the right circumstances. Again, because I try to buy them when they're undervalued and likely to turn back up. And for most of this year liquidity was still in high gear, which was another factor in my favor. I had numerous short term winners as a result. We'll see more opportunities like that again, but it may take a bit of time yet.

Oh, back to FAX again. I did note that in spite of today's rally in many global markets, bonds continued to struggle. That sure doesn't seem encouraging in the short term.
 
Last edited:
So far this week, the action has been in line with our sentiment survey and the Top 50 buy signal. We're getting that oversold bounce, which validates those two signals to a large extent.

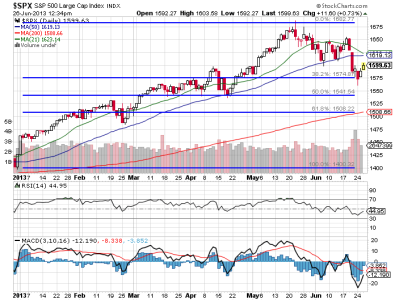
SPX.png

Price on the S&P is still below the 50 dma and I'm not liking its chances of getting back to that level at this time. Momentum (MACD) is moving higher, but is still negative as is RSI.

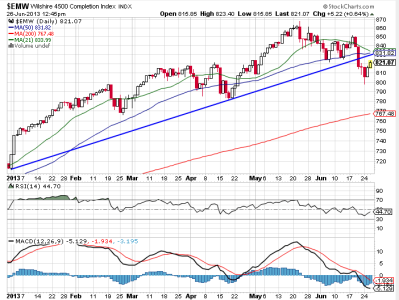
EMW.png

The Wilshire 4500 (S fund) is painting a very similar picture, except momentum has not turned back up yet. Both MACD and RSI remain negative here too. Price is also below the 50 dma and that lower trend line is now resistance. The buyers may bring it on this afternoon, but I'm thinking this two day rally isn't going last much longer. Especially with the punch bowl at least temporarily taken away.

I do see that bonds are higher, but the yield on the 10 Year Note is only modestly lower at this time.
 
Starting next week, we should have a new service ready for you. Some of you may know our forum member Coolhand, who has been posting and writing blogs in the forum for us for nearly 9 years. He will be starting a free weekly report in the premium service area, which will be available to everyone who has a created a free premium login. Free is the key word, but you will have to login to view the reports.

At some point in the future, and we are targeting January 2014 as the start date, "Coolhand's Market Analysis" will become a full service daily subscription based premium service.

Congrats CH !!

I look forward to reading your reports for the next 6 months :D
 
It looks like our weekly sentiment survey and the Top 50 buy signal are coming up roses this week. If I had any IFTs left, I would have liked to have bought some C and S funds earlier in the week, but I'm more focused on the intermediate term than the short term. Still, I hope some of you were able to take advantage of this week's rally. Futures are pointing to more follow through upside action. I anticipate we'll be testing trend line resistance and the 50 dma soon.

Here's a couple of stocks I'm watching.

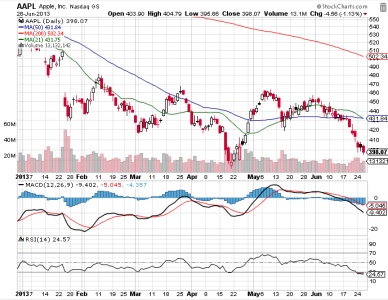
AAPL.png

You're probably all familiar with Apple. It's back below $400/share and has the potential to make a double bottom. MACD remains negative and pointing lower, while RSI is very negative and oversold. When those signals finally turn it would be a good place to take a position. One caveat is that the intermediate term is still down and that may continue to put downside pressure on price. But to a longer term investor, that may not matter. Apple pays a quarterly dividend of about 3%.

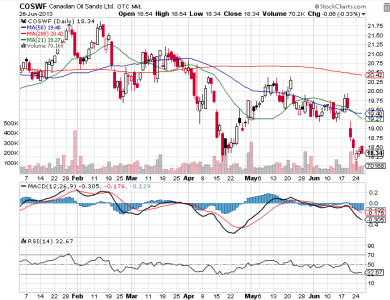
COSWF.png

Canadian Oil Sands Ltd. may be putting in a double bottom right now. MACD is negative as is RSI, but it could turn at any time. If those signals can confirm the move, I'd be a buyer. It pays a quarterly dividend of about 7.3% currently.

I saw that FAX posted a gain yesterday, as did ESD (another bond fund that I own). I'm looking for upside follow through on these funds in the weeks ahead. I wish the uncertainty about the Fed chair would get resolved though, as that could come back to be an issue for the market, although not necessarily a negative one.
 
Well, the S&P and Wilshire 4500 are testing the 50 dma now. A close above that level may prove bullish as more technical indicators are turning back up. But this is also the end of the quarter and that could be another reason for this rally.
 
Thanks again for discussing FAX as often as you do and your confidence in it. I decided to hold and now feel a bit more encouraged myself.

Do you have any insight on gold at this time and what would be your preferred vehicle for a gold investment?

Best regards to you.


P.S. Your chart on AAPL looks absolutely horrendous, please keep us informed when you spot any redeeming value on its statistics !
 
Last edited:
Thanks again for discussing FAX as often as you do and your confidence in it. I decided to hold and now feel a bit more encouraged myself.

Do you have any insight on gold at this time and what would be your preferred vehicle for a gold investment?

Best regards to you.


P.S. Your chart on AAPL looks absolutely horrendous, please keep us informed when you spot any redeeming value on its statistics !

I keep an eye on GLD and IAU, although I have not traded or owned either. I'd use IAU if investing for the longer term and GLD for shorter time frames as trading costs are higher for IAU per trade. You'll see it in the bid/ask spreads. IAU has a wider spread to cover cost. As far as my expectations for gold, I've always considered this a manipulated market. Did you see all those ads on TV from Rosland Capital imploring folks to buy gold? They ran for months. That was a big red flag to stay away as far as I was concerned. :notrust:

But for longer term investing it's not a bad idea to have a piece of the action if you can get it at a good price. Right now, the technical picture tells me the downside may not be over. I'm just not comfortable with it.
 
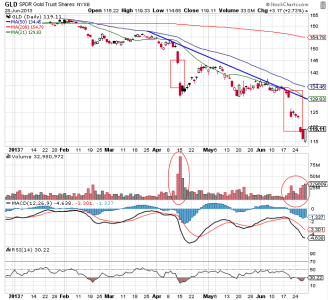
6-30-2013 13-01-02 PM.png

I didn't have time to post a chart of GLD earlier, so here's a follow up post of the chart. This chart looks bearish to me. Overall, price has been trending lower since February and there were two significant drops, one in April and one in June. Both saw gaps down. It looks like the gap in the first big drop in April may have been filled, but then shortly after the downtrend resumed. There are two big gaps in the most recent plunge. Maybe they get filled and maybe they don't. There are smaller gaps from earlier in the year that didn't get filled. I also don't like the volume associated with those moves lower. MACD is still negative and pointing down. RSI is barely out of oversold territory. I'm of the opinion lower prices are coming, but would not be surprised by more short term upside to fill the gaps.
 
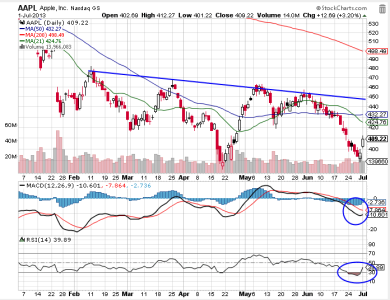
AAPL..png

I posted a chart of AAPL the other day anticipating that it may be putting in a double bottom. From a valuation perspective, the stock looks attractive to longer term investors. That's why I considered it a buy under $400. It now looks to be making another upside move as it gapped up a bit yesterday. MACD is turning up, but hasn't triggered a signal line crossover yet. RSI turned up too and exited an oversold condition. Short term I'm thinking it may rise above the 50 day moving average and approach that resistance line. Longer term, I think it's a good buy and hold candidate if you were able to pick up some shares off the recent lows.
 
Back
Top