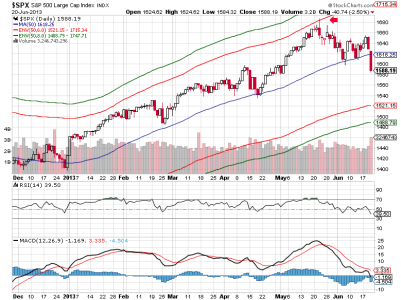
Well, the markets picked up where they left off last (OPEX aside) week as the sellers resumed their selling. What can we expect in the weeks ahead? I've got several charts that try to discern possible targets for a short term bottom.
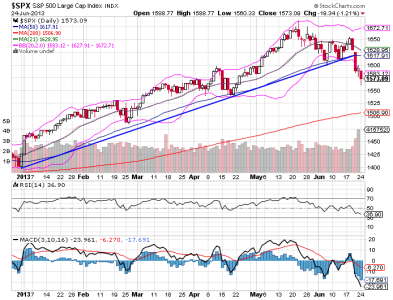
Using Bollinger Bands we can see that price on the S&P has traded below the lower bollinger band for the past three trading days. MACD is very low and getting more vertical. RSI is weak, but not yet oversold. We can turn very soon for a very short term rally, but I suspect it will get sold and may be hard to play in TSP. That's assuming we get a rally tomorrow. Our sentiment survey is on a buy this week and I did get a Top 50 buy signal, so even if this week closes red, I'd still expect a rally in here somewhere. That's the very short term.
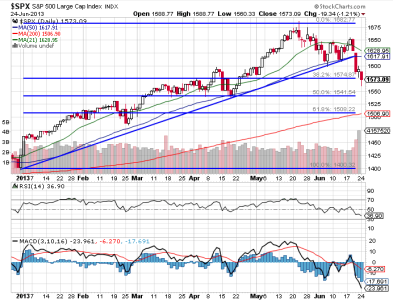
Looking at Fib retracements, we're already under the 38.2% level. The 50% is a reasonable bounce point and it's very near the 1550 level a lot of traders are watching, but while I would agree we could rally in this area, we are dropping too fast for me to think it would be anything more than a short term rally (again, assuming we get one) as the negative action suggests a longer term decline. Note that I am using the initial intermediate term rally point at the beginning of the year as a reference point. We are in a seasonally weak period and the intermediate term is confirmed to be down, so it made sense to me to use that price point as the retracement reference.
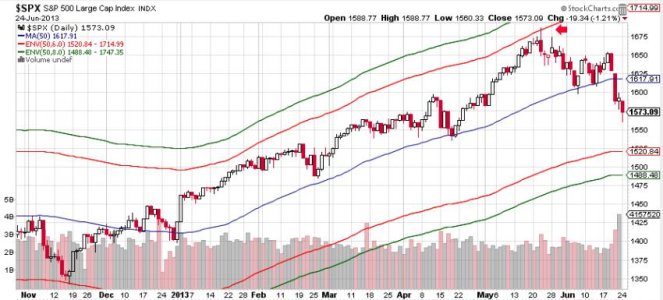
I showed you previously how the May 22nd high turned out to be the turning point in this market by using 6% and 8% envelopes around the 50 dma. This can also work in reverse. The lower envelope shows that 1520 is now 6% below the 50 dma. That could be another target area for a reversal. I actually think it is a more logical target for the intermediate term. But I doubt we get there right away and that 6% level could continue to move lower in the days ahead should the action get choppy, but retain its downward bias.
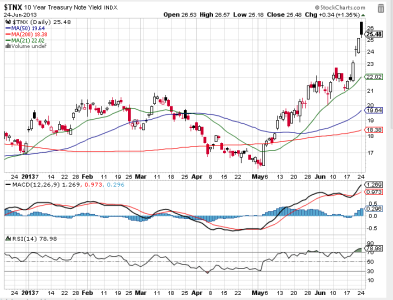
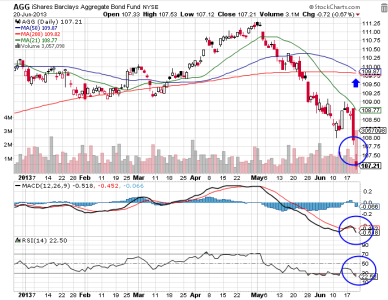
And then of course there's the fear of higher interest rates helping drive this downside action. And we can see the yield on the 10 Year Note climbed a bit more today. MACD is sky high and climbing and RSI is showing significant strength associated with this move.
In general, a lot of stocks and bonds are going to drop along with the major averages unless something changes the current dynamics at play. There is uncertainty about Fed policy moving forward, which is probably the major underlying reason for the change in market character. Liquidity levels falling to neutral on Friday has not gone unnoticed by a lot of traders either. This certainly speaks volumes about how the Fed feels about market support at the moment.

