coolhand's Account Talk

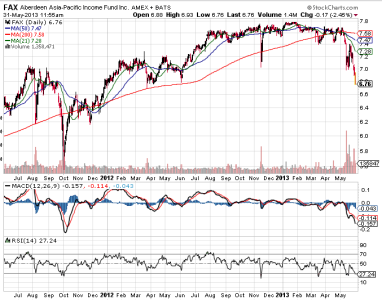
Bonds in general are certainly looking increasingly risky these days. But I still maintain them as part of a diversified portfolio. Last week, I sold some of my junk bonds to raise to raise some cash, but kept FAX, which I felt was a buy last week. But short term support didn't hold for FAX as it's now hitting lows not seen since April or June of 2012. It still appears to be an attractive long term buy and I'm certainly going to hold my position in it. That's why I focus on dividend paying instruments. They provide extra protection in any market environment.
FAX.png
 
6-3-2013 18-23-43 PM.png

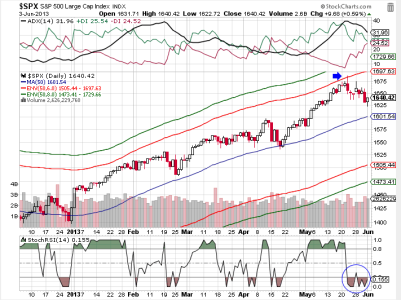
After tagging the upper 6% envelope (blue arrow), price has retreated. I'm expecting it to stay above the 50 dma before another another shot higher. The short term remains oversold on the StockRSI (circled area).

There are a lot of stocks that I follow that have fallen markedly, but price is still a bit too higher for my liking. I do however, like NSRGY, CAG and SO right now. But they've yet to make a decided turn higher, so the bottom may not be in. SO is a utility and that sector may not be done seeing weakness either, so I'd be watching that one a bit more carefully for an entry.
 
6-5-2013 1-10-50 PM.png

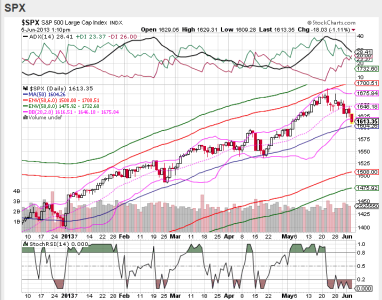
Same chart as yesterday. I added Bollinger bands to this one. Today's action is going to roll over many systems and indicators to sell conditions. And we just happen to be dipping below the lower Bollinger band today(which is just North of the 50 dma). I'm looking for a pop higher anytime now, although I'll allow for price to fall below the 50 dma for a day or two as long as things don't get ugly. So far this seems to be an orderly short term correction, but I may change my mind as the market continues to play out in the days ahead.
 
View attachment 24006

Same chart as yesterday. I added Bollinger bands to this one. Today's action is going to roll over many systems and indicators to sell conditions. And we just happen to be dipping below the lower Bollinger band today(which is just North of the 50 dma). I'm looking for a pop higher anytime now, although I'll allow for price to fall below the 50 dma for a day or two as long as things don't get ugly. So far this seems to be an orderly short term correction, but I may change my mind as the market continues to play out in the days ahead.

I am hopeful that it is short term correction as well. I have been looking at the Dow BBs adn it is starting to contract so I want to be in if it shoots up. Only in 15S/85G at this point, and trying to jump in at a bottom. BBs on Dow getting constricted just want to get a better feel for which direction it is going. Good luck to you and to all!! :)
 
Some preliminary data on the auto-tracker positioning through Wednesday:

The Total Tracker is showing a modest increase in stock exposure so far. It's up from 49.37% on Monday to 51.71% today. So there's more folks moving in than moving out right now, but the market has gotten more dicey since yesterday, so that could change.

The Top 50 has currently dropped their stock exposure from 96% to a current reading of 83.6%. That's a drop of 12.4% (and this is still a bull market). That would be a buy signal if it holds above 10% through the end of the week.

And our sentiment survey, which hasn't closed yet, is currently sporting a more bearish tone for next week as well.

Again, these are preliminary numbers, but they do help see where things are trending currently.
 
6-6-2013 18-16-52 PM.png

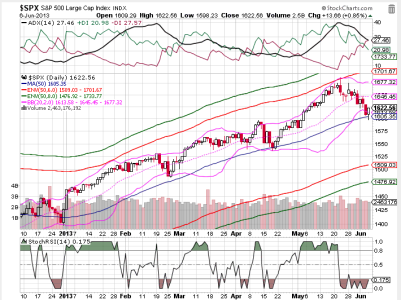
So far, this chart has played out very well. Price reversed when it hit 6% above the 50 dma about 2 weeks ago and fell to the 50 dma today before bouncing. I'm cautiously optimistic the low is in for at least the short term. But seasonality is weak and I think that means volatility. We'll probably retest this low after some follow through to the upside. At least that's my expectation. I'll look for a 50% fib retrace for now and reevaluate if price can get back that high.
 
Some preliminary data on the auto-tracker positioning through Wednesday:

The Total Tracker is showing a modest increase in stock exposure so far. It's up from 49.37% on Monday to 51.71% today. So there's more folks moving in than moving out right now, but the market has gotten more dicey since yesterday, so that could change.

The Top 50 has currently dropped their stock exposure from 96% to a current reading of 83.6%. That's a drop of 12.4% (and this is still a bull market). That would be a buy signal if it holds above 10% through the end of the week.

And our sentiment survey, which hasn't closed yet, is currently sporting a more bearish tone for next week as well.

Again, these are preliminary numbers, but they do help see where things are trending currently.

I'm going to reiterate again that the information I posted above was "preliminary". I said that the Top 50 were showing a buy signal, but only "IF" their collective stock exposure fell by more than 10% by week's end. After yesterday's rally, it's no longer on a buy as total stock exposure jumped back over 92%. I also note that the Total Tracker continues to show modest dip buying as it moved up a bit more to a total stock allocation of 52.56%.

We'll have to see how today's market performs in order to determine if a signal gets generated or not.
 
Last edited:
6-7-2013 10-40-06 AM.jpg

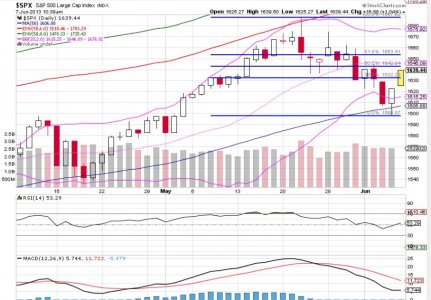
We bounced off the 50 dma yesterday and today we're getting some follow through upside action. We'll more than likely close positive today. Price is very near the 50% Fib level for this bounce. It could go higher. I'm anticipating we'll see some selling pressure early next week given the bounce we've had so far. But I'm holding long regardless. If I had more IFTs, I'd be tempted to pull in my stock exposure and play for it, but TSP is too limiting to get overly cute.
 
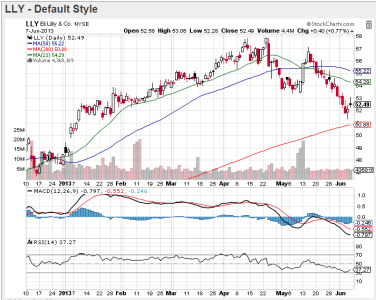
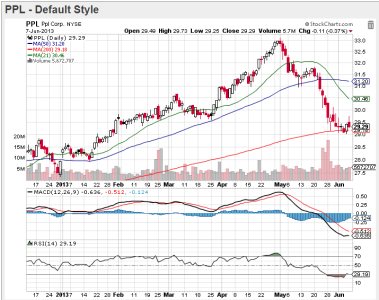
Here's two stocks that I think are reasonable buys right now.

LLY.png

Eli Lilly & Co. I mentioned as a buy back in mid May at its previous low. It managed to run a bit past $57 after I called attention to it. Now, there's a lower low and another potential, short term capital gain opportunity for those focused more on the short term, or a better longer term opportunity for those who are more inclined to buy and hold. In any event, the stock appears to be turning back up not far from its 200 dma. RSI is weak, but turned up late last week, while MACD appears to be leveling out. It currently pays a 3.73% dividend.

PPL.png

Ppl Corp. is utility sector stock that has been trading right around its 200 dma for the past week or so. RSI is oversold and has made a modest turn back up last week, while MACD is quite negative, but leveling out. Because it is part of the utilities sector it's a bit riskier as a short term play, but longer term looks attractive. It currently pays a dividend of 5.02%.
 
Thank you for posting this article, CH, I hate the HFT, and had not seen this article. Maybe there is hope about returning some confidence to the Markets ??

It will take time. That's assuming the powers that be care about trust and confidence. :suspicious:
 
6-11-2013 10-43-48 AM.png

Looks like the gap got filled at the open. I'm anticipating some upside now, but with seasonality weak, volatility and chop may be what we get.

On another note, bonds continue to get hammered. Those gaps may not get filled soon either as MACD continues to plumb new depths. RSI is oversold as well. The big question to me isn't when do we bounce? I'd rather know where all this money is going, as the bond market is many times larger than the stock market and the stock market is under some measure of pressure as well. I'm thinking when this market is ready, we could see some serious upside action sometime down the road. That's my thought anyway.

6-11-2013 10-49-26 AM.png
 
6-13-2013 05-06-54 AM.png

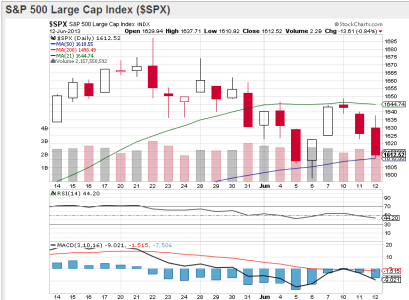
Well, the market has now retraced its two day rally last week and price has closed not far off last week's low. But price has not fallen back below the 50 dma just yet. Still, given futures are down moderately right now, I'd wager that we'll test May 6th's intraday low today. We could even see a lower low, but where we close will be key as to what happens next. Tomorrow is OPEX, which should be in the bulls favor. There's a lot going on in the global market and one of the big issues weighing on sentiment is rising yields. And the Nikkei fell more than 6% last night. Some of my indicators are on sells right now, but not all have confirmed. But it's getting close. And seasonality remains negative. I took a preliminary look at the autotracker and there is only modest changes in stock exposure for either the Top 50 or the Total Tracker. No help there. I may be looking to lighten up by tomorrow if for no other reason than to reduce risk.
 
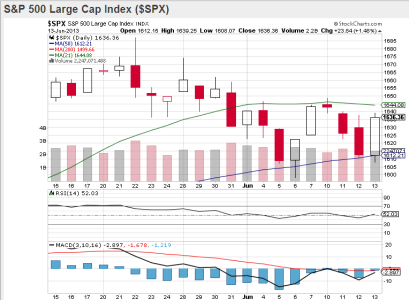
This morning I was feeling a bit bearish as my indicators were pushing the envelope in terms downside risk. We needed to turn soon or things might go from dicey to outright bearish. I think today's action helped make a case that this bull is not dead.

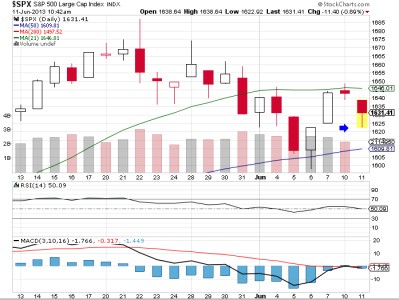
SPX.png

Today's candlestick would seem to imply the low from last week will hold for at least the short term. It's the kind of action that suggests we'll get some follow through to the upside as the 50 dma held yet again. But it's not just the action in the equities market that got my attention.

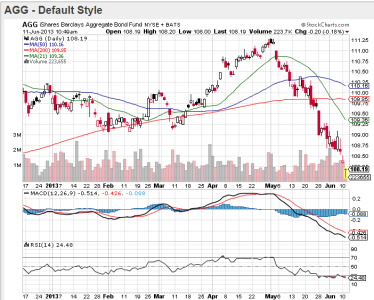
AGG.png

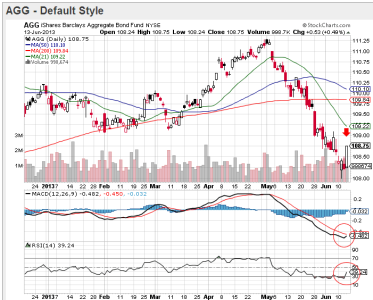
Barclays Aggregate Bond Fund (AGG), which our F fund approximates, is one of the largest ETFs around. And it holds bonds across the spectrum; Treasury notes, Treasury bonds, corporate bonds, utilities, U.S. agencies and more. So it's not a sector fund. It jumped 0.49/share today. That also makes me think the low may be in for now. The turn in MACD and RSI is encouraging.

But it's only one day, albeit a very positive one. But it certainly gives reason for the bulls to be optimistic. The only problem with that is if sentiment jumps to the bullish side too quickly. But I'll be looking for some follow through tomorrow just the same.

I also note that FAX, a global bond fund that I own and have posted here before, turned higher by 2.55% after getting hammered for almost a month. So the jump appears to be broad based.
 
Back
Top