coolhand's Account Talk

Here's stock on my "watch" list as of today.

View attachment 23546

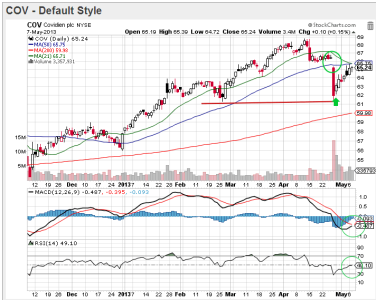
Covidien (previous known as Tyco Healthcare) is a large medical supply and equipment company. It's taking a pretty good hit today as a result of missing its revenue estimate for the 2nd quarter. You can read about it here. The news was hardly something to get overly bearish about, but price has been struggling a bit even before today's announcement. In my opinion, the news presents a good buying opportunity.

I've drawn three support line targets for this stock. It's currently at the first one, near the upper-$61s. However, RSI and MACD are still pointing down. RSI is also showing that it's oversold as of today. That's why it's not yet a buy for me, only a watch. As a longer term buy and hold stock, it's current price is relatively attractive now, but there's a good chance it may get even more attractive in the days ahead. Once it appears RSI and MACD are turning, I'd consider buying this stock either as a short term trade, or a longer term buy and hold. It pays about a 1.6% quarterly dividend.

Remember, it's only a watch for the moment. That may change in the not too distant future, but we'll have to see how the technical picture develops.

One trading day later and COV is up about 2% at the open. It's not a confirmed upside move yet, but I'm thinking the bottom is probably in for now.
 
Barrick Gold and Newmont Mining were two companies I posted charts on back in late January. At the time I had them on "watch" and was not ready to buy as this sector was very weak and susceptible to further selling pressure. Fresh charts are posted below.

View attachment 22034

The first chart is Newmont Mining Corp. I'm seeing a possible triple bottom reversal pattern setting up, but the stock has yet to confirm this pattern with a breakout in the $48 area (the accum/dist line has a positive divergence over the past 2 months). For a longer term buy and hold strategy, the stock has potential. And it pays a quarterly 3.1% dividend, which makes it more attractive to investors.

View attachment 22035

I find Barrick Gold Corp. intriguing, mainly because I'm thinking that over the long haul, gold may begin another ramp higher, which I would think may put upward pressure on this company's stock. Looking at the chart, price is sitting right at the lower support line and the accum/dist line is showing a negative divergence, which suggests it's heading lower. But like Newmont Mining, it may be a stock worth watching for the longer term buy and hold investor. Let's look at a shorter term view of this stock.

View attachment 22036

We can see that support has been holding around the $33 area since mid-November. And again, that A/D line suggests it will probably fail to the downside in the short term. If that happens, this stock will begin to look attractive at some lower price. I'll be watching that A/D line for a clue in the weeks ahead. And this stock pays a quarterly dividend of about 2.7%.

So when the bull market finally ends, will gold and mining stocks find favor?

4-29-2013 16-37-19 PM.jpg

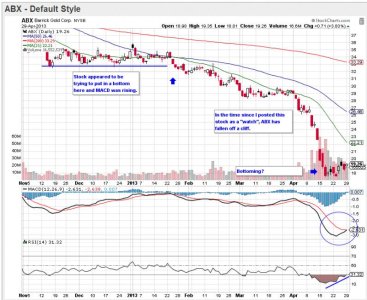
ABX was looking as though it was bottoming several months ago, but this sector ended up succumbing to further downside pressure. Since I posted the first chart on 24 January, ABX has fallen more than 41% as of today. It's still too early for short term traders to be sure it's bottoming, but RSI and MACD are rising. Still, this is one that I'd set a wide stop on as these stocks can be volatile and could see even further price deterioration down the road. For longer term investors, it might be worth taking a "small" position just to have exposure in this sector, but even a buy and holder can afford to wait and see if price really is turning up.

4-29-2013 16-37-47 PM.jpg

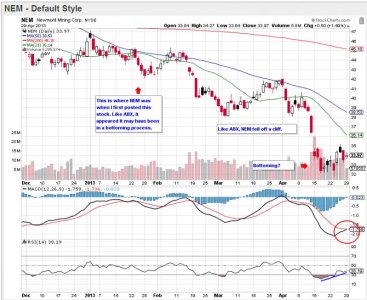
It's pretty much the same story with NEM. This stock has fallen about 22% since I posted the original chart. The technicals look similar and the stock is worth watching for possible entry in the weeks/months ahead.

I continue to watch both these companies, but I'm not ready to buy as yet.
 
GDX and GDXJ are both looking good at these levels.

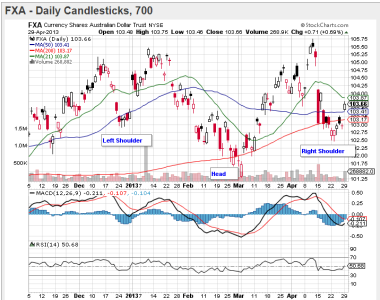
FXA looking good for gold right now with possible inverted H&S setup.
 
GDX and GDXJ are both looking good at these levels.

FXA looking good for gold right now with possible inverted H&S setup.

Hey Bullitt, nice to hear from you!

Yes, GDX and GDXJ charts look very similar to the miners charts I posted.

4-30-2013 8-56-48 AM.png

And I see the H/S pattern on FXA. It looks poised for a continuation higher, but why is this good for gold?
 
Another update for BP. See fresh chart below.

Let's review another pick I made about a month ago and see where it stands. Here's the original post:


Here's the chart today:

View attachment 23522

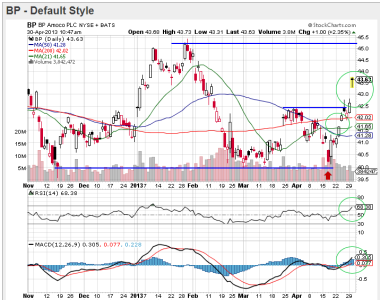
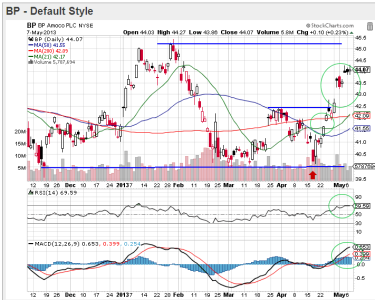
We can see that when I first called attention to BP, I was anticipating price appreciation as support was holding. It did move up, but it stalled in the low $42s and eventually returned to the support line (where I bought even more shares). Now we can see that it's making a more aggressive move to the upside with gaps the last two days. It is now above short term resistance as of today. RSI is gaining strength and MACD (momentum) appears to be turning up. It is acting as though it's got more short term upside potential given current technical readings. This particular stock is one that has significant upside potential in the longer term, although it does carry a bit more risk than some of its peers. They just need to put the Gulf Spill behind them in the Federal courts. News of a settlement can send this stock much higher. At least that's the way I'm hoping it plays out. And that may not occur for some time yet. But in the meantime, it still pays around a 5% quarterly dividend.

4-30-2013 10-47-26 AM.png

As anticipated given the technical indicators, BP had more upside, gapping higher this morning by more than 2%. Target now is the $45 area as long as technicals remain postive. At this time, RSI and MACD do remain positive and rising. So far, this pick is up about 8.5% in the short term.
 
Generally AUD (FXA) has a strong correlation with precious metals due to the high amount of resources mined in Australia. I think the correlation is around 70-80% so in this case AUD could be considered a leading indicator.
 
Generally AUD (FXA) has a strong correlation with precious metals due to the high amount of resources mined in Australia. I think the correlation is around 70-80% so in this case AUD could be considered a leading indicator.

I suspected it had something to do with resources down under, but wasn't sure. Thanks. :)
 
4-30-2013 2-55-34 PM.png

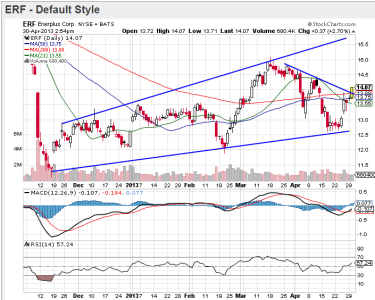
Update on ERF: Price is above trend line resistance at the moment. RSI and MACD remain positive and point higher. The Ex-Dividend date is tomorrow and the Date of Record is Friday. Those dates can sometimes see volatile price movement. I'm expecting price to remain on an upward tack, but I cannot be sure that's how it will play out. Just an FYI. So far, this stock is up over 9% since I first posted it, if you're keeping track. :cool:
 
Barrick Gold and Newmont Mining were two companies I posted charts on back in late January. At the time I had them on "watch" and was not ready to buy as this sector was very weak and susceptible to further selling pressure. Fresh charts are posted below.


View attachment 23583

ABX was looking as though it was bottoming several months ago, but this sector ended up succumbing to further downside pressure. Since I posted the first chart on 24 January, ABX has fallen more than 41% as of today. It's still too early for short term traders to be sure it's bottoming, but RSI and MACD are rising. Still, this is one that I'd set a wide stop on as these stocks can be volatile and could see even further price deterioration down the road. For longer term investors, it might be worth taking a "small" position just to have exposure in this sector, but even a buy and holder can afford to wait and see if price really is turning up.

View attachment 23584

It's pretty much the same story with NEM. This stock has fallen about 22% since I posted the original chart. The technicals look similar and the stock is worth watching for possible entry in the weeks/months ahead.

I continue to watch both these companies, but I'm not ready to buy as yet.


NEM earnings came out today and were a miss and the stock tanked another 4.62% NEM is now more oversold than the GDX gold miners. Further, my data research shows accumulation is going on and institutions are buying. May or may not be the bottom, but might be time to nibble a little.
 
NEM earnings came out today and were a miss and the stock tanked another 4.62% NEM is now more oversold than the GDX gold miners. Further, my data research shows accumulation is going on and institutions are buying. May or may not be the bottom, but might be time to nibble a little.

I saw the carnage in NEM. It was down as much as 7.5% during trading. I note that ABX is acting a little better, but the A/D line is still negative as is CMF. But we could indeed be bottoming here. I agree that taking a starter position in this sector or in select stocks in this sector would be a reasonable play at this time.
 
I've got another stock that has some short term upside potential. It's a bit riskier than some of the other stocks I've posted (with the exception of NEM and ABX, which are miner stocks), but I do think the risk is reasonable given the technical set-up.

5-3-2013 07-30-13 AM.png

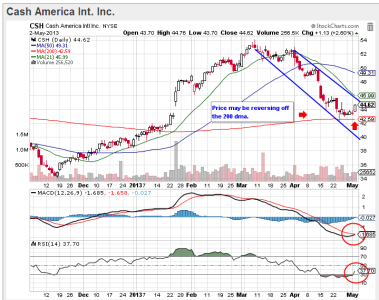
This is a fairly straight forward play. CSH has been in an intermediate term decline since mid-March. While the 21 and 50 dma continue to point lower, price appears to be bouncing off the 200 dma. Yesterday, RSI and MACD turned up a bit, with RSI exiting an oversold condition. I also note (though I did not highlight it on the chart) that January's gap has now been filled. These are the technical positives. Price is not far from the upper downward trending line however, which makes upside potential in the short term questionable to some extent. But again, the 200 dma is not far below either. If price gets above that upper trend line, it could run to at least the $48 area. I would set a stop in the 43.50 area, which is about 2.5% below yesterday's closing price. That may be a bit conservative, so if one is willing to take a bit more risk, you might drop it down closer to $43.

This is a relatively short term play in my view and not a stock I'd recommend for buy and hold. At least not at this time. Primarily because it pays very little in the way of dividends for the risk one takes in owning it. Conservative plays such as utilities, which pay handsome dividends, are still commanding a lot of attention in the current market environment. This is just my assessment of technical risk in the present and does not take into consideration company fundamentals or outlook.
 
More risk, set your stop at any close (or intra-day dip if you are squeamish) below the 200 day SMA (would keep you from getting stopped out on wild gyrations, but prevent your loss if a big drop occurred).
Less risk, buy once it closes above the upper trend line (less risk, less gain).
Price action could determine whether it goes past $48 (which would be about the 50 day SMA by then), but if the 200 day MA starts moving back up that would be a good sign to a support further move up.

The reality is that in any stock, be careful of the overall market trend. If we do see a reverse in the overall market trend down, then that would make this a counter trend play and it should be re-evaluated as such if that were to happen.

Looks promising :)
 
I've been pretty busy at work, so I haven't had a lot of time to post of late, but I did want to update on some stock picks this evening.

5-7-2013 17-40-31 PM.png

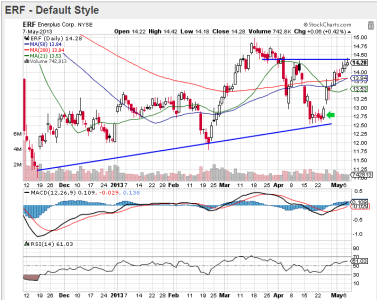
I bought ERF for $12.78 on 4/23/2013 (green arrow). As of today's close I am up 11.72%, plus I've earned a quarterly dividend (yield is about 7.5%).
It may be running into resistance now, but MACD is still showing momentum to the upside and RSI remains positive and showing a modest upside bias. But if one is playing it for short term gains, you might want to take profits now or wait till the signals turn down. It has the potential to keep running though.

5-7-2013 17-22-55 PM.png

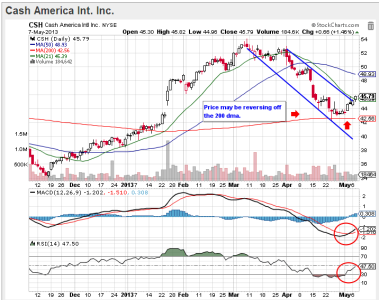
I didn't buy CSH myself (I had no spare cash at the time), but I saw this as a good short term play and would have bought it around $44.50. So far, I'd be up 2.9% at today's close. I was watching to see if price would get above that upper trend line and so far so good. It has some room to move to the upside yet and I'm thinking it's a reasonable expectation for it to tag $48. both MACD and RSI are pointing higher, which is what we want to see.

5-7-2013 17-29-49 PM.png

BP is one I actually bought in two separate accounts when I last mentioned this buying opportunity in mid-April (red arrow). I paid $40.47 in one account and as of today's close I'm up 8.88%. I'll qualify for a dividend at the close of business Friday (5/10). It's yield is about 4.8%. RSI is still strong, but flat lining just below 70, which would be an overbought condition should it manage to get above that level. MACD is rather high, but not quite turning. It may be hitting resistance now though, so taking profits here would be fine for a short term trader as long as one is willing to forgo the dividend. If I was trading it in the short term, I'd wait till the signals actually turn, but that's a personal choice. I like the longer term potential for this stock and plan to hold this longer term.

5-7-2013 17-34-59 PM.png

COV is another stock showing gains. I only posted this one last week (green arrow), but you can see it's in the money too. MACD is continuing to turn up, while RSI has risen from just barely oversold to about neutral. Short term, this stock may be running into resistance now, but I consider it a buy and hold stock. I think it has a good chance to run higher in the longer term. This is another stock I was not able to buy because I didn't have any spare funds at the time, but I probably would have picked it up for about $62.80 if I could have. Then I'd have about a 3.9% gain at this time. If I was trading it short term, I'd watch to see if that gap gets filled and whether price can stay above that 50 dma for more than few days. It's not there yet, but it's close. Of course, I'd still be watching RSI and MACD for further short term clues as well.
 
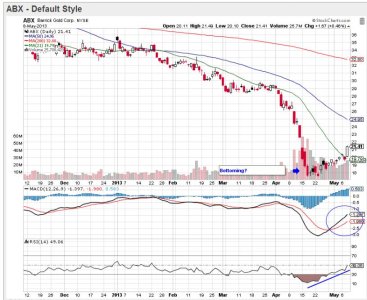
It may be time to buy ABX. It's taken an absolute beating for over a year and especially recently. It looks good for entry right now and could very well have a lot of upside potential in the longer term.

5-8-2013 17-39-19 PM.jpg

It looks like it may have finally bottomed in mid-April. At least in the short term. MACD has improved dramatically, although is still a bit negative, while RSI is gaining strength and ready to cross over mid-range. Today's big price spike certainly looks inviting. This stock could be poised to run to the high $28s in the relative short term if the stock can attract enough attention. I'd have a stop in place on this one, however. It can be volatile, so keep that in mind if you decide to jump in. Today's action alone was good for almost 8.5%. The downside can be equally dramatic.
 
5-9-2013 12-02-18 PM.png

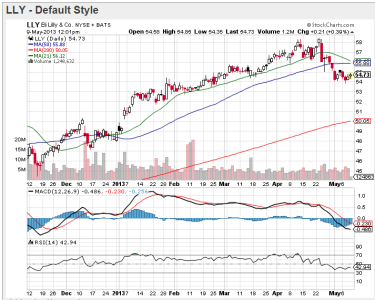
Okay, here's another stock I've been watching. Eli Lily looks like it "may" be basing right now. I'm actually on the fence on this one yet, as RSI is negative and moving a bit sideways and MACD is also negative, but looks like it wants to turn. The problem is that there is still a lot of money coming into this market. And there are many other stocks I wanted to post, but they took off before they got as low as I thought they would. BAX was one of them yesterday. But there were several others over the past couple of weeks or so. I think that because so many stocks are extended by most traders/investors standards that when a company pulls back a bit, it looks undervalued in comparison to everyone else. I'm still watching this one, but it could take off quickly.
 
The utilities sector has been seeing some selling pressure of late. I watch SO, PCG, ALE, and DUK, among others and I'm thinking there may be a buying opportunity coming down the road. Might not be in the short term, but I had some great entries into SO, PCG and ALE the last time they were beaten down.
 
The utilities sector has been seeing some selling pressure of late. I watch SO, PCG, ALE, and DUK, among others and I'm thinking there may be a buying opportunity coming down the road. Might not be in the short term, but I had some great entries into SO, PCG and ALE the last time they were beaten down.

I've been waiting for a buying opportunity in Westar Energy(WR). It's down over 2% today, but needs to drop a lot more for me to buy. It pays a nice 4% dividend.
 
I've been waiting for a buying opportunity in Westar Energy(WR). It's down over 2% today, but needs to drop a lot more for me to buy. It pays a nice 4% dividend.

Most of them are definitely over valued. But with the Fed continuing to flood the markets with liquidity, I'm not sure how long I'd have to wait to see significantly lower prices. I guess we'll see how far the current weakness takes the sector. But they'd have to come down at least 10% for me to feel comfortable with adding shares.
 
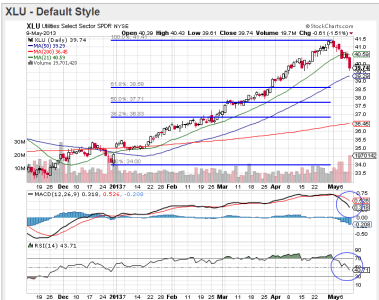
Of all the stocks I track, I pay close attention to the utilities sector. Many of the companies that comprise it pay nice dividends, are relatively stable, and I believe will continue to be seen as a safe haven in these times of economic uncertainty. It's one of the sectors that has been leading the market, which is not what one would expect if the economy is truly turning around. For the past week and half or so, this sector is coming under pressure even as the broader averages are moving higher. Liquidity remains very high as of Wednesday. And bonds too are seeing some pressure. There appears to be at least a short term rotation out of safer investments and into riskier ones. Riskier being a relative term. First, I'm thinking this market may see some serious upside action yet that will catch many by surprise. The support has certainly been there. It's just a question how much emotional distress it will take to coax money from the more conservative positions in the market and into those that are starting to over perform. That would help build momentum to the upside for the major averages.

But I'm not a big momentum chaser. But I am seeing what looks like rotation out of utilities and that may allow more conservative investors an opportunity to buy back in at lower prices. Utilities will always have a place in my personal portfolio, so I'm watching the action intently. Let's take a look at this sector.

5-10-2013 6-31-48 AM.png

We can see that XLU, a utilities select sector SPDR, is seeing some downside pressure. I'm watching the Fibonacci retracement lines for a clue as to when we could see a turn, because I'm not convinced utilities won't come back in the relative short term. The 50% retracement level is what I have my eye on, but I'm not predicting that's where this will turn. Only that it's a reasonable target area. RSI and MACD will help in determining how deep the retracement goes too. And as you can see, they're still pointing lower. I am watching several companies in this sector and when I think we're turning the corner, I may be a buyer. For now, I'm just watching these indicators. One other thing to consider. If the rotation turns out to be longer term, prices could fall much further than the 50% retracement area. The picture is not clear, but the indicators should help bring things into a bit more focus as time goes on.
 
Back
Top