coolhand's Account Talk

Things are getting very interesting in the markets again. Yesterday's plunge was on the deep side. We were due at least some short term selling pressure, but the severity of the drop will give pause to many traders. There's no shortage of reasons given for the decline. Precious metals and miner's selloffs, Boston Marathon situation, global growth concerns, to name a few.

As a result of the negative action, many technical indicators turned down in a hurry. The intermediate term was and remains in a sell condition, but liquidity has largely trumped those sell signals for quite some time now. Was there a corresponding dip in liquidity injections yesterday? I don't know yet, but I would not be surprised. As of Friday, liquidity was still at very high levels. And sentiment gets beared up quickly on negative news and weakening technicals. It may be that the influx of negative news events gave cover to the powers that be to reload for the next push higher. But I do note that there was broader damage done yesterday than has been typical on other short term declines. Many defensive stocks saw their largest drop in weeks. I also note that junk bonds, while still at very high levels, pulled back a bit yesterday. So there's reason to be wary of this market. And that's not a secret. Any bullish sentiment that's been seen in recent months is almost certainly due to the expectation that the Fed will continue to support market prices. If that is taken out of the equation, it's very possible we fall fast and deep. And don't forget, seasonality is no longer on the bulls side.

I am not overly bearish just yet, but I am skeptical of this bull at the moment. It appears we'll bounce this morning. But after that?
 
Liquidity did indeed drop yesterday. It's still well in expansion territory, but it dropped well off of last week's levels. That does not necessarily mean the game has changed because it could be ramped back up again if desired, but it is something that's very notable nonetheless. Sooner or later liquidity will fall much more significantly. The only question is when? As a side note, liquidity has not seen a period of contraction since last summer. It hasn't always been at extreme levels, but it's been in expansion for the better part of a year now.
 

Thanks. I've had access to Marty Chenard's analysis for several years. It's one of the more technically oriented services I've seen. But Marty tends to be a very conservative trader/investor and it comes across very clearly in his commentary. That's not necessarily a bad thing, but in his opinion this has been a high risk market for quite some time. The problem for him is that when you're being that conservative and issuing almost daily warnings while the market continues to climb for months anyway, it frustrates your subscribers. So folks who follow him have to understand the context of his analysis and make adjustments to their trading plan accordingly. His commentary aside, his charts can be a valuable resource for active traders.
 
Today's action is not particularly inspiring for the bulls. I note that liquidity, while still in expansion, may be tapering off. This process could still take weeks if they've a mind to continue to keep this market afloat. That's the problem for the bears. Getting heavily short as technicals begin to roll over has usually resulted in snap back rallies. And many are rolling over. I'd be a lot more bearish myself if not for liquidity.

In any event, if this market sells off again today or tomorrow, the game may have changed. Then again, it is OPEX week. And volatility is not unusual in that context.
 
Here's where we are from my perspective. Yesterday's action turned down even more technical indicators. The charts are looking bearish. But it's also obvious that they look bearish. Our sentiment survey came in decidedly bullish for next week. Here's something else to be very aware of; as of this morning, the Top 50 have dropped their collective stock exposure by more than 53%! Folks, that's a big time buy signal as we are still in a bull market. Remember, last year the Top 50 was wrong more than 75% of the time when they dropped their stock exposure by more than 10%. Now this is a preliminary reading as I don't have Friday's IFTs yet, but I'm pretty certain it won't make a big difference.

Now let me caveat this a bit more. Liquidity dropped again yesterday. It's still in expansion as of yesterday, but it's dropped by almost 50% from last week's levels. That may be a warning, but that doesn't mean we can't rally at least one more time given sentiment and the obvious deterioration in technicals. I'm not sure I'd be making any big bets either way. The bears should not get too comfortable just yet and the bulls need to respect the fact that liquidity is falling. This may very well be a market in transition, but it probably won't play out easily for either bulls or bears in the short term.
 
Last edited:
The stock (ETR) that I posted about here almost a month ago was a big winner. I said it was poised for a possible big run in mid 62 area and in fact it ran all the way to an intraday high of 70.70 on 19 April. So if you bought this stock say around 62.75 you would have a gain of 11.24% in less than a month if you were lucky enough to sell at the high. And it may go higher, but that was a fast and deep run, so I'm not expecting a lot more upside in the short term. It's actually due for some consolidation as are many other stocks on the big boards.

But what I really wanted to post was another stock that appears poised for some upside action.

4-23-2013 16-16-49 PM.png

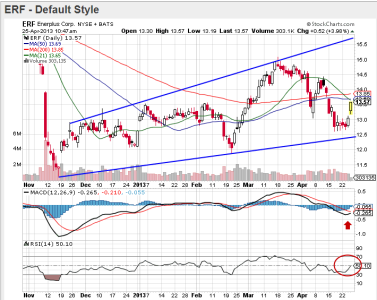
Enerplus Corp. is an oil and natural gas play with interests in Canada and the US. It's current yield is 8.31% and is paid on a monthly basis. That's a very nice dividend. They just announced a cash dividend in the amount of CDN $0.09 per share and that will be payable on May 21, 2013 to all shareholders of record at the close of business on May 3, 2013. The ex-dividend date for this payment is May 1, 2013.

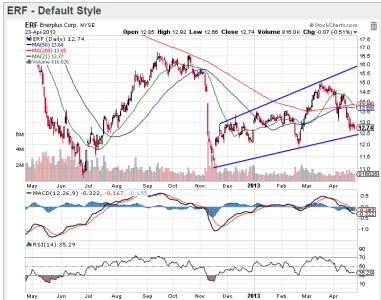
On the chart itself, price tagged the upper trend line in mid-March and has retraced not too far from the lower trend line. If RSI and MACD turn up and price remains above that lower trend line, I'd expect this stock to begin another cycle back up to the upper trend line once again, or at least the $15 area. If it falls below that lower trend, I'd look for support in the $12 area and then the lower 11s. Given this market has rallied hard for almost 4 months now, I'd not be surprised with more downside action should the broader market finally decide to make a sustained run lower. But for a longer term buy and hold play, I think price is attractive right where it is at present.
 
It looks like the stock I posted yesterday (ERF) may be starting its upward cycle today. Price is currently trading around $13.10, which is about 2.6% higher than yesterday's close. I anticipate RSI and MACD will begin to turn as well.

The stock (ETR) that I posted about here almost a month ago was a big winner. I said it was poised for a possible big run in mid 62 area and in fact it ran all the way to an intraday high of 70.70 on 19 April. So if you bought this stock say around 62.75 you would have a gain of 11.24% in less than a month if you were lucky enough to sell at the high. And it may go higher, but that was a fast and deep run, so I'm not expecting a lot more upside in the short term. It's actually due for some consolidation as are many other stocks on the big boards.

But what I really wanted to post was another stock that appears poised for some upside action.

View attachment 23487

Enerplus Corp. is an oil and natural gas play with interests in Canada and the US. It's current yield is 8.31% and is paid on a monthly basis. That's a very nice dividend. They just announced a cash dividend in the amount of CDN $0.09 per share and that will be payable on May 21, 2013 to all shareholders of record at the close of business on May 3, 2013. The ex-dividend date for this payment is May 1, 2013.

On the chart itself, price tagged the upper trend line in mid-March and has retraced not too far from the lower trend line. If RSI and MACD turn up and price remains above that lower trend line, I'd expect this stock to begin another cycle back up to the upper trend line once again, or at least the $15 area. If it falls below that lower trend, I'd look for support in the $12 area and then the lower 11s. Given this market has rallied hard for almost 4 months now, I'd not be surprised with more downside action should the broader market finally decide to make a sustained run lower. But for a longer term buy and hold play, I think price is attractive right where it is at present.
 
Quick update on ERF.

4-25-2013 10-47-40 AM.png

ERF gapped higher this morning and is now up another 4% on top of the roughly 2% gain yesterday. RSI and MACD are moving higher as expected. I'm still looking for price to get above $15 and maybe run above $15.5 to that upper trend line. This is not necessarily a short term play. I specifically look for quality stocks that pay handsome dividends and are poised for a run to the upside. The price has to be attractive for me to buy the stock. This is one of the ways I control risk. I generally do not chase momentum, that's a different kind of trading strategy. I also try to look at my picks as longer term positions.
 
Last edited:
Let's review another pick I made about a month ago and see where it stands. Here's the original post:

I mentioned a week or so ago that I thought BP was looking mighty tempting for longer term traders. Since then, it's beginning to show some life again.

View attachment 23046

Note that support held in the $40 area. RSI is rising nicely and the 28 dma is curling up. Friday's action saw a gap higher (red arrow) on some news of an $8B share buyback. That gap may get filled, but I'm relatively confident this stock will be biased higher at this point. I picked up more shares at $40.44 to take advantage of what I considered to be good growth potential (4.9% quarterly dividend helps too).

Now if they could settle that oil spill out of court it could be off to the races. :cool:

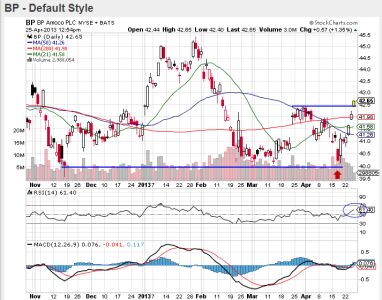
Here's the chart today:

4-25-2013 12-55-10 PM.png

We can see that when I first called attention to BP, I was anticipating price appreciation as support was holding. It did move up, but it stalled in the low $42s and eventually returned to the support line (where I bought even more shares). Now we can see that it's making a more aggressive move to the upside with gaps the last two days. It is now above short term resistance as of today. RSI is gaining strength and MACD (momentum) appears to be turning up. It is acting as though it's got more short term upside potential given current technical readings. This particular stock is one that has significant upside potential in the longer term, although it does carry a bit more risk than some of its peers. They just need to put the Gulf Spill behind them in the Federal courts. News of a settlement can send this stock much higher. At least that's the way I'm hoping it plays out. And that may not occur for some time yet. But in the meantime, it still pays around a 5% quarterly dividend.
 
Coolhand, very nice picks! I appreciate your insight on the charts. I'm trying to learn a bit of how to recognize these movements myself in my individual account. How do you go about finding these? If its a company you've bought before (like BP) I can understand that you might just glance at it once in a while but as someone who doesn't know who ERF is for instance, how would one go about searching to find that chart?
 
Coolhand, very nice picks! I appreciate your insight on the charts. I'm trying to learn a bit of how to recognize these movements myself in my individual account. How do you go about finding these? If its a company you've bought before (like BP) I can understand that you might just glance at it once in a while but as someone who doesn't know who ERF is for instance, how would one go about searching to find that chart?

I actually track at least 100 stocks, plus some mutual funds as well as bonds and bond funds. I determine what I want to track by learning what some of the pros are recommending. That information comes from multiple sources and is subject to change as needed. I then scan those charts daily looking for technical set-ups. Many of these stocks, MFs, and bonds are priced above my price points, so I'm also watching to see when any of them fall below that level, which I then can choose to buy or continue watching if the technical set-up isn't right yet. You can also scan technical set-ups at http://www.finviz.com/. But be mindful that their charting isn't always accurate and many of these stocks I would not buy regardless of the setup. That's why I've said before that I prefer "higher" quality companies to trade. They are less likely to throw me curve balls. And they need to pay a dividend too, which helps make them that much more attractive to investors. The objective for me is to reduce risk as much as practical in an effort improve my success rate. It's been working pretty well for me to date.
 
Here's stock on my "watch" list as of today.

4-26-2013 1-14-28 PM.png

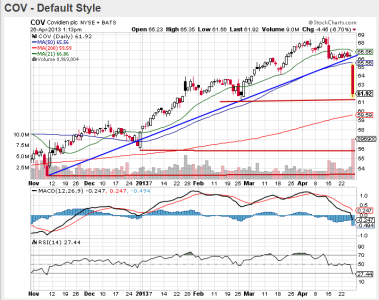
Covidien (previous known as Tyco Healthcare) is a large medical supply and equipment company. It's taking a pretty good hit today as a result of missing its revenue estimate for the 2nd quarter. You can read about it here. The news was hardly something to get overly bearish about, but price has been struggling a bit even before today's announcement. In my opinion, the news presents a good buying opportunity.

I've drawn three support line targets for this stock. It's currently at the first one, near the upper-$61s. However, RSI and MACD are still pointing down. RSI is also showing that it's oversold as of today. That's why it's not yet a buy for me, only a watch. As a longer term buy and hold stock, it's current price is relatively attractive now, but there's a good chance it may get even more attractive in the days ahead. Once it appears RSI and MACD are turning, I'd consider buying this stock either as a short term trade, or a longer term buy and hold. It pays about a 1.6% quarterly dividend.

Remember, it's only a watch for the moment. That may change in the not too distant future, but we'll have to see how the technical picture develops.
 
I meant to post this earlier today, but got sidetracked. I got an intermediate term buy signal at the close on Thursday, but I'm not acting on it for at least two trading days. Today being one of them. Since price ran back to the top of the trend lines or bollinger bands on various indexes, it consider it prudent to wait a bit longer before acting on this signal. I'm out of IFTs anyway until Wednesday.
 
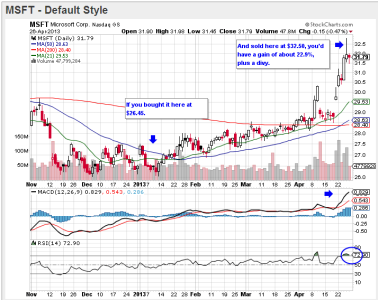
I posted the below charts (Microsoft and Southern Company) back on 9 January. That's the day I bought them. How have they fared?

View attachment 21839

The first stock I picked up is Microsoft. You can see that the 50 dma passed through the 200 dma not too long ago and price is now much more attractive. This is still a solid company and they are sitting on a mountain of cash. Not to mention they pay a decent quarterly dividend of about 3.3%.


View attachment 21840

Very similar situation with Southern Company. The 50 dma is below the 200 dma and the company is on solid footing. And being a utility they should do well in an economic downturn. This bull market is getting long-in-the-tooth after all. They pay a quarterly dividend of about 4.5%.

I generally expect to hold these stocks for the longer term. They appear to have good upside potential and as I mentioned, will pay handsome dividends while I wait for anticipated price appreciation in the months to come.


4-27-2013 08-22-01 AM.png

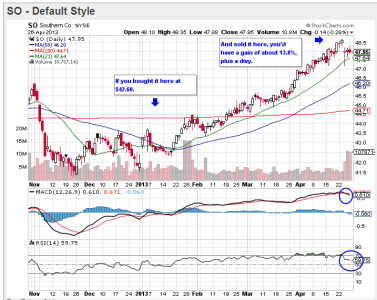
I've annotated hypothetical buy and sell prices to illustrate how these stocks have fared since I posted them more than 3 months ago. Southern Company would have returned around 13.8%, not including a quarterly dividend if one bought and sold on the dates annotated (blue arrows). This is a utility stock, and a good one for longer term players, but like so many stocks, it's run hard and deep for some time now. I'm not sure how much more upside we can expect in the intermediate term, but I do note that MACD and RSI are now falling. That doesn't necessarily mean its upside run is over (liquidity lifts many boats), but that's a healthy gain in a relatively short time frame. It's due to pay out another dividend soon (which is why I'm still holding it).

4-27-2013 08-27-49 AM.png

Microsoft had an even better run. Buying and selling on the annotated dates would have given one a gain of almost 23%, plus a dividend. Unlike Southern Company, it's MACD is pointing higher and RSI remains robust, although it's also overbought. This is a stock that I think has better upside potential in the longer term than SO does as MSFT is sitting on a tons of cash (they can absorb economic shock easier than many other companies) and they aren't a utility, which are considered conservative stocks. In less than three weeks (16May), holders of this stock will qualify for this quarter's dividend.

I do not recommend buying these stocks at this time. I only wanted to update you on how these stocks did since I originally posted them. Their price points are now far too high for entry in my opinion.
 
I posted charts (Microsoft and Southern Company) back on 9 January.

I do not recommend buying these stocks at this time. I only wanted to update you on how these stocks did since I originally posted them. Their price points are now far too high for entry in my opinion.

I held SO for awhile last year, CH. Would have held longer, but I realized after buying that I goofed, bought in the taxable account instead of the Roth account. So I sold for small profit (which got taxed), but haven't bought back since then due to price action and chronic procrastination and distraction and indecision about everything else out there that I might buy for oh so many different reasons. :o I will buy SO again someday, this time in the appropriate account (nontaxable), when conditions are better. :cool:
 
I held SO for awhile last year, CH. Would have held longer, but I realized after buying that I goofed, bought in the taxable account instead of the Roth account. So I sold for small profit (which got taxed), but haven't bought back since then due to price action and chronic procrastination and distraction and indecision about everything else out there that I might buy for oh so many different reasons. :o I will buy SO again someday, this time in the appropriate account (nontaxable), when conditions are better. :cool:

I think that when the market finally has its correction, this stock may be a buy once again. There's a lot of interest in defensive, dividend paying companies, and utilities generally fit that bill very well.
 
I bought my first SO position back in July '07 at $32 and have been nibbling on it ever since. I may never sell it.

This is the reason I try to focus on the longer term with my portfolio. At least as much as I can. 20% gains in a few months can sometimes turn into 50% or more gains over longer periods of time. Not with all stocks of course, but that's why diversification is important. And dividends can play a huge role in achieving that kind of return too.

Of course, I think I'm preaching to the choir, huh? :)
 
Back
Top