coolhand's Account Talk

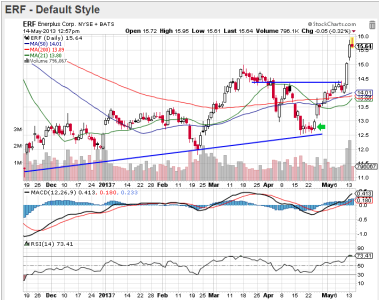
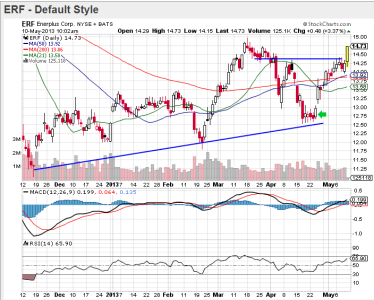
ERF is slicing through resistance in morning trade. I'm up over 15% currently (since 4/23). I'm not sure it can sustain this move in the short term, but it can be a runner at times. If it can get to the $15 area and close there, there could be more upside in the days/weeks ahead. This is for short term traders. Longer term, and from an "investment" perspective, you have the option of just riding any volatility while you collect monthly dividends in the 7.8% yield area and possibly being rewarded with further capital gains down the road.

5-10-2013 10-02-26 AM.png
 
Since I own ERF in two different accounts, I sold one of those positions for $14.73, which was good for about a 15.25% gain, not including the divvy later this month.
 
Quick update on three stock picks.

COV.png

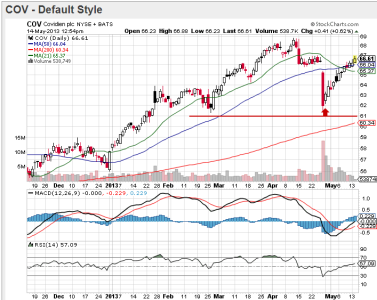
Since I first posted Covidian, it's been steadily climbing higher. It's now up about 6% since that time and technicals look good for more upside.

LLY.png

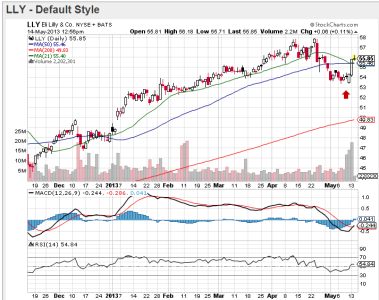
I posted LLY early last week. I was still on fence about whether is was turning or not, but suspected it was. We can see now that it was turning. This one is now up about 3.4% and its indicators also look positive.

ERF.png

I first posted this stock (green arrow) back when it was under $13. I bought it at $12.78. As of today, it is up more than 22% and could run further.

As far as our TSP, the underlying support for this market (liquidity) is still quite robust. As such, it makes sense to stay long until support falls off. And that won't be an easy decision, as liquidity has been curtailed from time to time by as much as 50% or so only to ramp back up to much higher levels. Of course, many longer term systems roll over during those drawdowns and that's helped propel price higher and higher as many traders and investors get whipsawed out of position and then scramble to get invested again once it becomes apparent that the downside action was nothing more than a head fake. Eventually, it won't be a head fake and we'll see a more pronounced sell off. But it's anyone's guess when that actually occurs.
 
There were a few others that I haven't posted (lack of time) that were also very successful. In a liquidity driven environment, it puts the wind at my back so-to-speak on these types of plays. When the liquidity falls off, the profits may get more challenging, or at least require more time for price to appreciate in many cases.

You've made some good trades, Jim.
 
I posted this chart a while back and thought it would be a good time to revisit it given we're hitting news highs almost daily on the indexes.

5-16-2013 7-29-18 AM.png

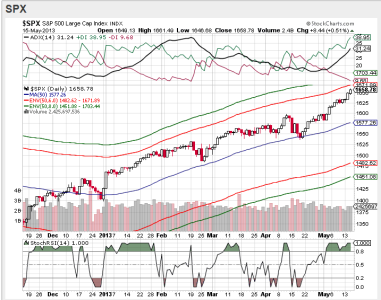
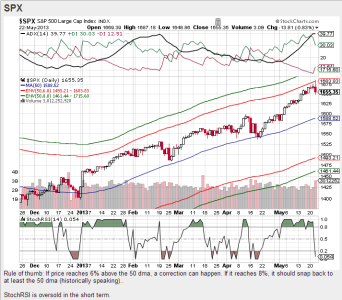
This is a chart of the S&P 500 (C fund). I've included some envelopes that show where price would be at 6% and 8% levels relative to the 50 day moving average. As a general rule, if price reaches 6% above the 50 dma, a pullback is possible near term. If it reaches 8% above the 50 dma, a pull back to at least the 50 dma is possible near term. This is a general rule and this is not an ordinary market. Still, it provides some measure of risk management in markets experiencing large moves either up or down. In this case, I'm really only watching the upper envelop and price is getting closer to that 6% above the 50 dma mark.

The wild card is all that liquidity and the emotional response this market may elicit as more traders and investors are left standing on the sidelines as the indexes continue their trek higher. This is just a scenario, but if we hit those levels it may be prudent to take something off the table. Having said that, regardless if we see a pullback at those levels or not, this market is very likely headed higher in the weeks and months ahead. This just doesn't look like a longer term top being made, but it could be a short to intermediate term one. And given we aren't overly flexible with IFTs, it may not be worth chasing lower prices if one can't get reinvested quickly if need be.

Just some thoughts I'd like to share. I'm still 100% invested here.
 
I posted this chart a while back and thought it would be a good time to revisit it given we're hitting news highs almost daily on the indexes.

View attachment 23818

This is a chart of the S&P 500 (C fund). I've included some envelopes that show where price would be at 6% and 8% levels relative to the 50 day moving average. As a general rule, if price reaches 6% above the 50 dma, a pullback is possible near term. If it reaches 8% above the 50 dma, a pull back to at least the 50 dma is possible near term. This is a general rule and this is not an ordinary market. Still, it provides some measure of risk management in markets experiencing large moves either up or down. In this case, I'm really only watching the upper envelop and price is getting closer to that 6% above the 50 dma mark.

The wild card is all that liquidity and the emotional response this market may elicit as more traders and investors are left standing on the sidelines as the indexes continue their trek higher. This is just a scenario, but if we hit those levels it may be prudent to take something off the table. Having said that, regardless if we see a pullback at those levels or not, this market is very likely headed higher in the weeks and months ahead. This just doesn't look like a longer term top being made, but it could be a short to intermediate term one. And given we aren't overly flexible with IFTs, it may not be worth chasing lower prices if one can't get reinvested quickly if need be.

Just some thoughts I'd like to share. I'm still 100% invested here.


Remember what I said last week about the S&P tagging the upper envelope at 6%. We could see a pullback. Today we hit that 6% mark and got a pullback. This pullback "may" be a bit deeper than the last couple we've had, but that remains to be seen. I'm not expecting the market to roll back to the 50 dma, but it could. It will depend on what the underlying support for this market is doing and how sentiment reacts. Typically, the bears have come out quickly when significant weakness presents itself. And that has helped kill downside action relatively quickly. We'll see how it plays out soon enough.

Bonds continue to sell off and that has my attention too.

5-22-2013 17-47-20 PM.png
 
Coolhand,

I know you track your numbers a little differently, and on a weekly basis, but I noticed that yesterday was the first time since you mentioned the herd being under 40% invested that Ocean's List now shows 40% investment in CS&I. As of COB yesterday, the herd was at 40.07%. I'll check in a couple hours to see what today's update looks like. Very interesting.

Right now, according to my numbers, the herd is at 39.32%. I don't include the L funds in my calculations, but I don't see that as an issue since they aren't used that much by the folks on the tracker. On another note, I've also compiled a running total of how the market fared when the herd was under 50%. It's not as impressive as being under 40%, but it was still positive overall for the bulls. I didn't see a whole lot of dip buying today by folks on the auto-tracker, so I don't think we'll see much movement in stock allocations. I'm thinking this market is likely to find its feet again.
 
Right now, according to my numbers, the herd is at 39.32%. I don't include the L funds in my calculations, but I don't see that as an issue since they aren't used that much by the folks on the tracker. On another note, I've also compiled a running total of how the market fared when the herd was under 50%. It's not as impressive as being under 40%, but it was still positive overall for the bulls. I didn't see a whole lot of dip buying today by folks on the auto-tracker, so I don't think we'll see much movement in stock allocations. I'm thinking this market is likely to find its feet again.
Ocean's List shows a bullish uptick of .3%, with the herd now at 40.37%. I also am only looking at C,S, & I funds. We've discussed in the past how your numbers differ slightly - I think the reason is that you filter out the "Hidden" members, while Ocean's doesn't. Or something like that. Anyway, I know you didn't intend 40% as a magic number that would immediately cause a turn in the market. I just found it interesting that - using the Ocean's List - it did. For a day at least.
 
Ocean's List shows a bullish uptick of .3%, with the herd now at 40.37%. I also am only looking at C,S, & I funds. We've discussed in the past how your numbers differ slightly - I think the reason is that you filter out the "Hidden" members, while Ocean's doesn't. Or something like that. Anyway, I know you didn't intend 40% as a magic number that would immediately cause a turn in the market. I just found it interesting that - using the Ocean's List - it did. For a day at least.

I see this as a weekly signal since that's how I capture and assimilate the data. I use this signal to provide overall market context with other indicators. It helps me assess risk and market direction. I don't filter out "hidden" members. I use every member on the tracker, but I do filter out the funds themselves, which are embedded in the tracker, along with the sentiment survey. With almost 1,100 members being tracked now, small variations aren't particularly meaningful. If Ocean uses a metric that captures the L funds in his calculations, that would certainly help explain the difference between our numbers.
 
I've been waiting for a buying opportunity in Westar Energy(WR). It's down over 2% today, but needs to drop a lot more for me to buy. It pays a nice 4% dividend.

Coming off what looks like a head and shoulders top, WR is down to around 32, from a high around 35. I might be a buyer around 30.
 
I don't filter out "hidden" members. I use every member on the tracker, but I do filter out the funds themselves, which are embedded in the tracker, along with the sentiment survey.
Do you filter out the systems Like Total US Market, LMBF Method, etc?
 
Coming off what looks like a head and shoulders top, WR is down to around 32, from a high around 35. I might be a buyer around 30.

It looks promising. There's a number of others that I'm watching that are look promising too, but there appears to be some sector rotation in progress, so I have to be careful with what I select to buy right now.
 
Do you filter out the systems Like Total US Market, LMBF Method, etc?

If it's a highlighted item in the autotracker, I take it out. I don't think LMBF method is one that I remove. Not sure about the other. I make assumptions that entries like LMBF method are an actual account someone is using. I don't think there are many entries like this. If we're talking about less than 5 entries like this, it won't affect the end results enough to be very meaningful. Perfection is not required. Not with almost 1100 line items.
 
There's a number of others that I'm watching that are look promising too, but there appears to be some sector rotation in progress, so I have to be careful with what I select to buy right now.

Please post the ones you think look promising, when you get a chance.
 
Here's four stocks that I'm watching:

DUK.png

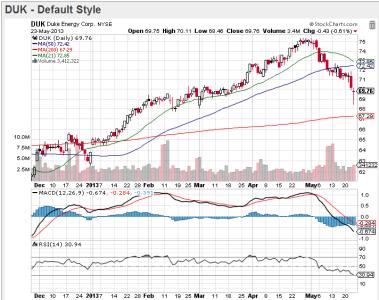
Duke Energy Corp., like most of the rest of the utilities sector, has been seeing weakness since early May. It's a company I'd like to own, but I'm not sure this sector has seen a bottom yet. MACD is decidedly negative and RSI is almost in oversold territory. One possibly positive sign is the tail on today's candlestick. Many stocks ended up with one today and that could be a sign that at least a short term bottom is near. But until MACD and RSI turn higher, I'd wait for any entry here. It pays a 4.36% divy at the moment, but the date of record was last week, so one would not be entitled to a divy for another 3 months or so. But I want to stress that there may be rotation out of the utility sector, so even if it was to bounce for a few days, it may not last long.

PEG.png

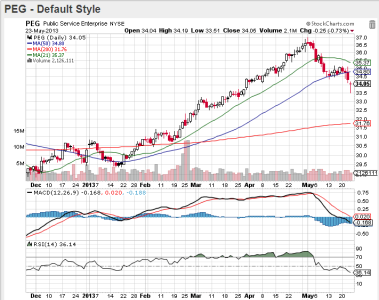
Public Service Enterprise was a stock I owned earlier this year. After picking up about a 15% gain, I let it go for better opportunities. Now it's starting to look attractive again. It too is showing a long tail on today's candlestick. But MACD and RSI have not turned yet, so it's not a buy at this time, but it bears watching. This one pays a 4.2% divy and it's ex-dividend date is June 7th, so it's not too late to qualify for the next dividend payout if it can show signs of bottoming soon.

TWO.png

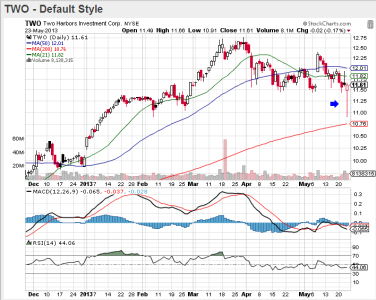
Two Harbors Investment Corp. is a Real Estate operations company and pays a hefty 11.01% divy at the moment. Note the very long tail on today's candlestick. It looks like it bounced off support in the high $10 area and not far from the 200 dma. MACD and RSI have not turned here either, but they aren't as negative as the previous two stocks above.

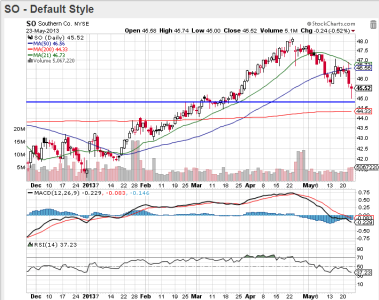
SO.png

I still own this one. Like Duke Energy, Southern Company has been seeing weakness for several weeks. The blue line is an area of support. Like the other stocks, MACD and RSI have not turned higher yet, so it's still only a watch. But it's also a utility sector stock, so I'm mindful that more weakness may yet be coming. SO pays a 4.44% dividend currently.
 
Thanks for providing your analysis... Learning a lot from you.

Thanks DBA. :) I actually had another fund that I'm calling a buy right now, but overlooked it yesterday when I posted the other charts.

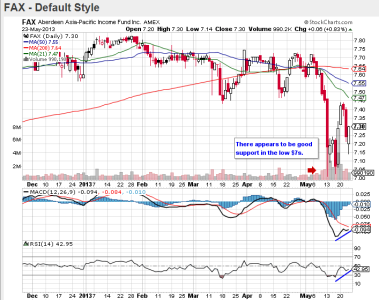
FAX.png

Aberdeen Asia-Pacific Income Common is a Closed End Fund that targets the Australian and Asian Fixed-Income markets. It is currently trading at a modest discount to its Net Asset Value. I've made two purchases of this fund in the past few days. I think there's a good potential for price appreciation and it throws off an attractive 5.75% monthly dividend. If you buy this fund by 29 May (ex-dividend date) and hold it past its date of record (31 May) you'll qualify for its next dividend payout, scheduled for 14 June. RSI and MACD appear to be turning higher since its recent sell-off a couple weeks ago.
 
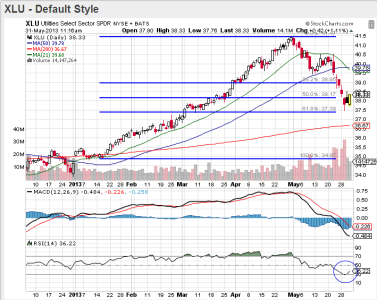
Last week I mentioned that I was watching both DUK and SO in the utilities sector for possible entry points. But I cautioned that there was rotation out of this sector and I would not be a buyer at that time. Both DUK and SO are rallying today, as are many other companies in this sector. Let's look at a chart of the sector itself, in this case XLU, which is a SPDR on the NYSE. Using Fibonacci retracements, I see that this sector has tagged the 61.8% retracement line, which is a deep, short term retracement (from early January price levels) and now appears to be turning back up. RSI dipped briefly into oversold territory and now is pointing higher (but still negative). MACD is still quite negative and has not actually turned.

XLU.png

The stock market is going through some kind of transition so I cannot be sure if the utilities sector is actually bottoming. It may be, but I'm not inclined to think these companies are going to recapture their highs of the year anytime soon. Perhaps this SPDR gets back to its 50 dma. That's a reasonable short term target. Of course each individual company's chart will be a bit different, but if this sector is seeing at least some short support, I'd expect most companies to be participating in it.
 
Back
Top