robo
TSP Legend
- Reaction score
- 471
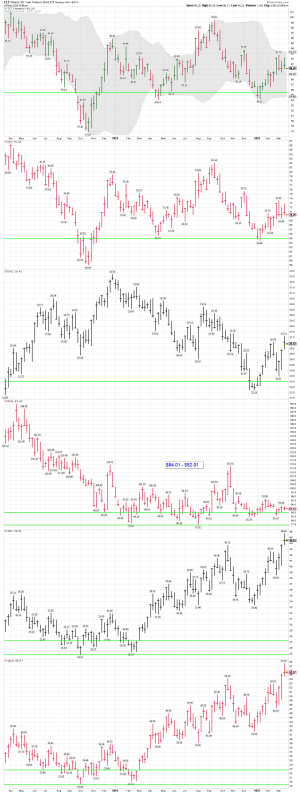
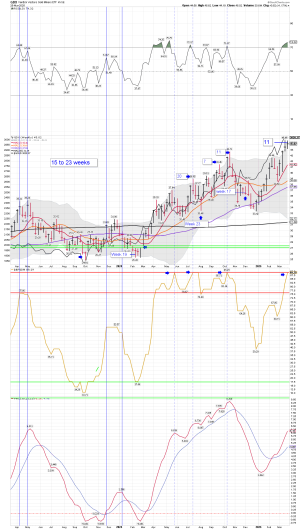
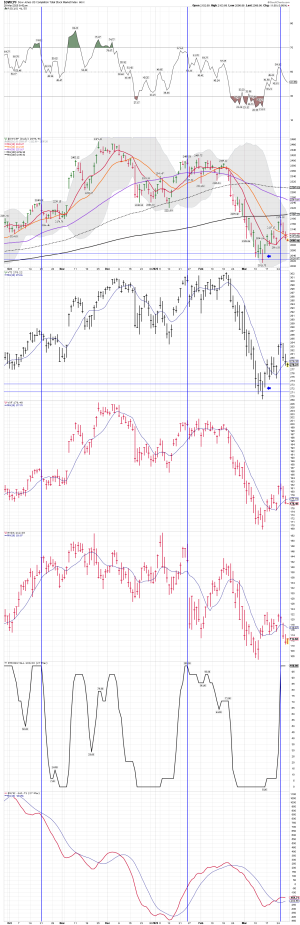
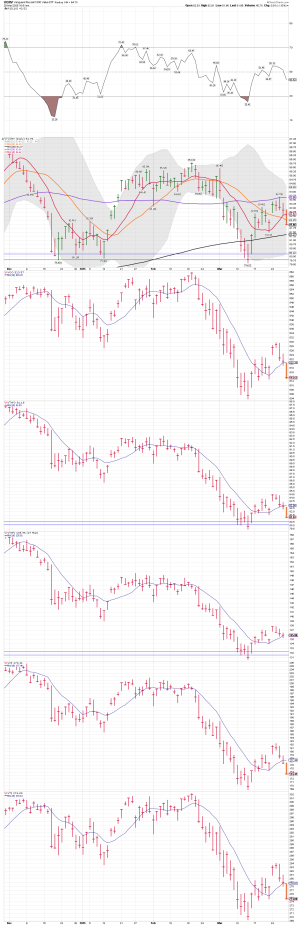
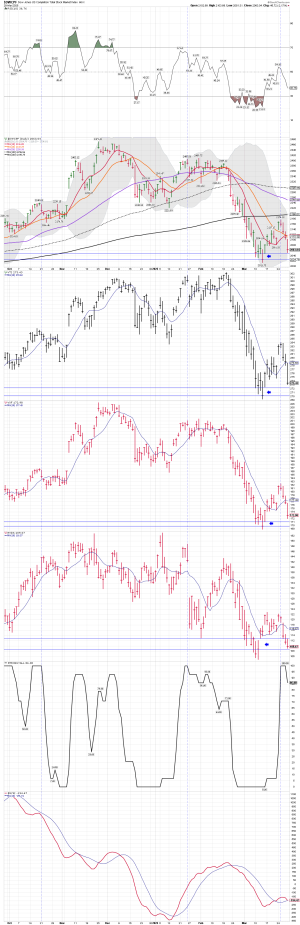
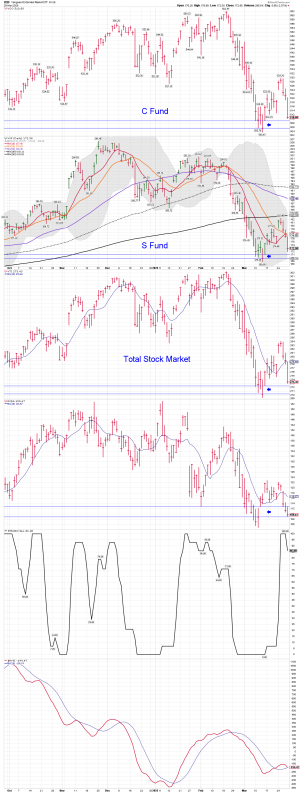
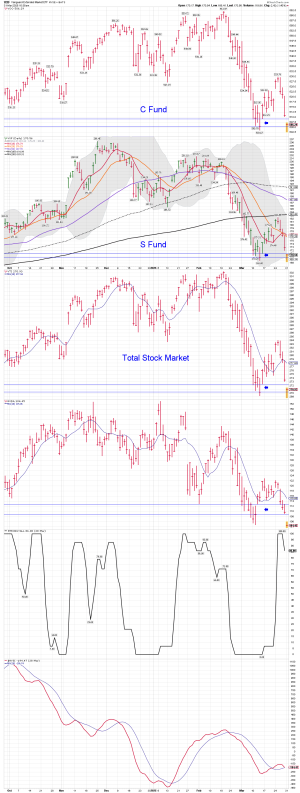
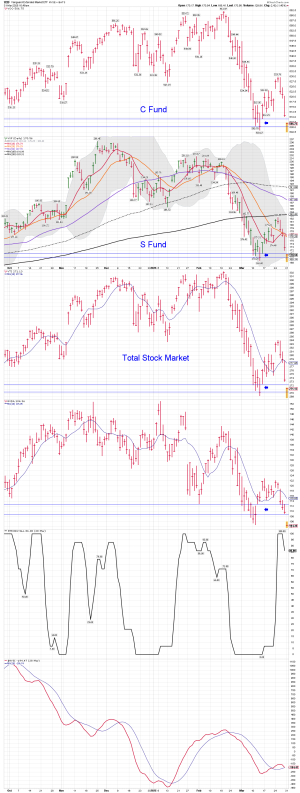
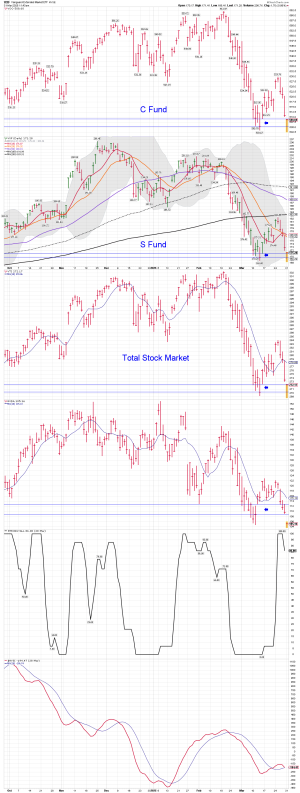
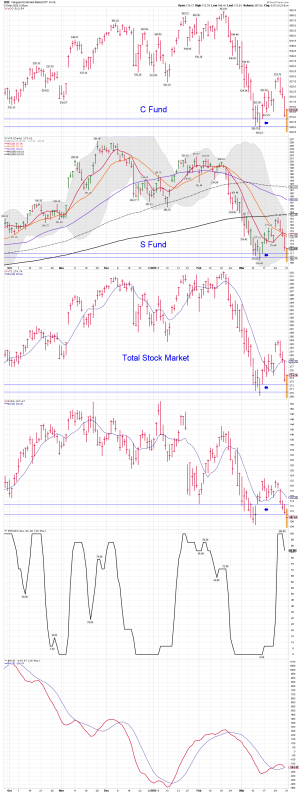
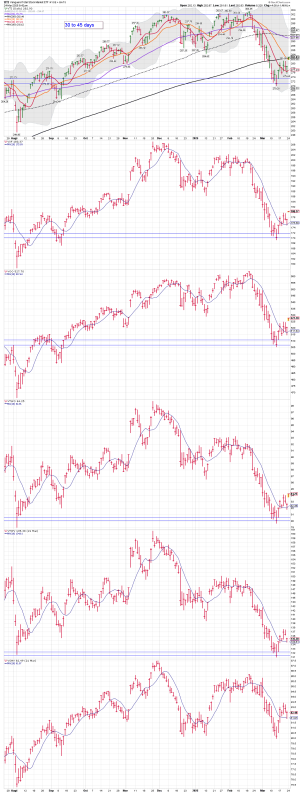
S Fund and Tariff talk: A nice gap up above the 20 day MA in early trading, as the talk of reduced tariffs is in the news.
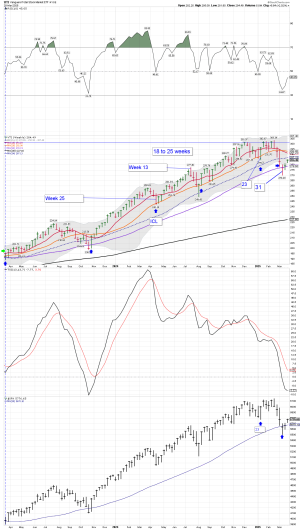
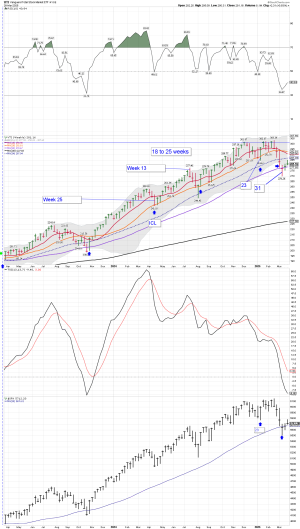
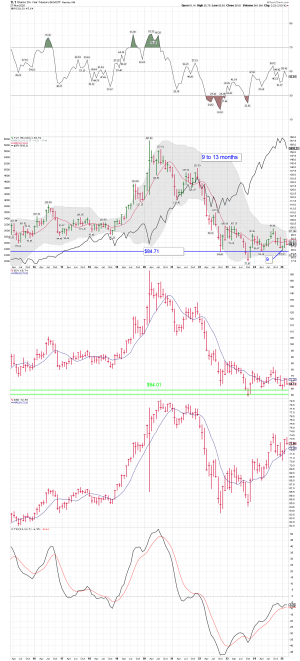
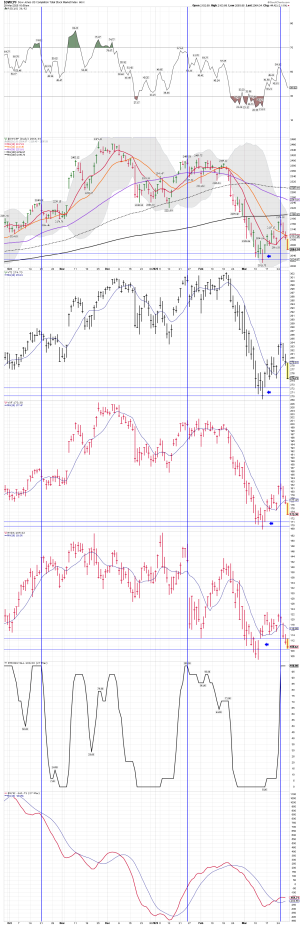
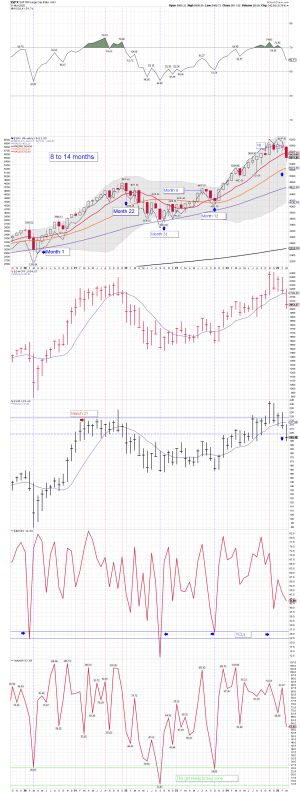
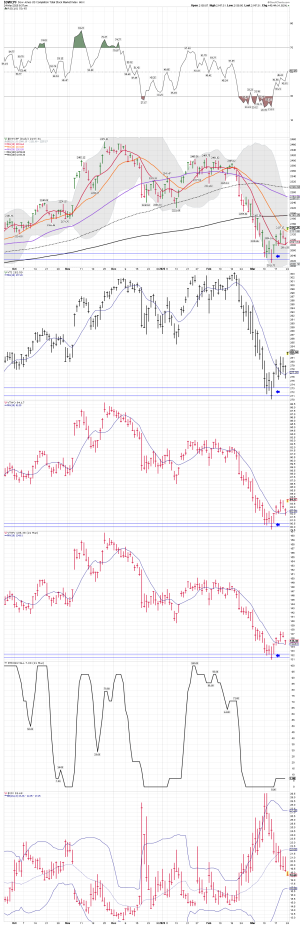
Vanguard Indexes: Looking good too. VTI moving back above the 20 day and the 200 day MA. That could bring in some additional buyers...
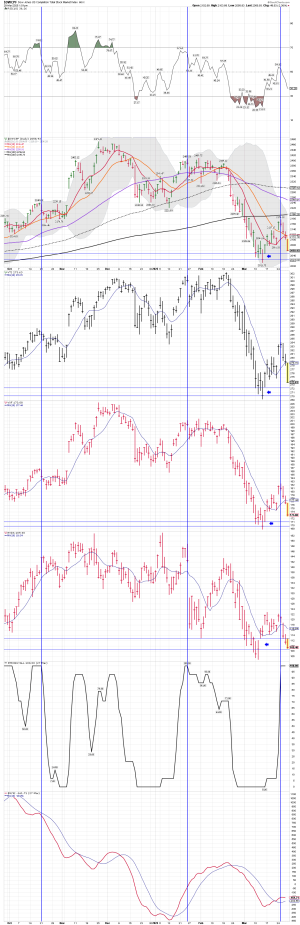
Vanguard Indexes: Looking good too. VTI moving back above the 20 day and the 200 day MA. That could bring in some additional buyers...
Attachments
Last edited: