-
The Forum works well on MOBILE devices without an app: Just go to: https://forum.tsptalk.com
-
Please read our AutoTracker policy on the IFT deadline and remaining active. Thanks!
-
$ - Premium Service Content (Info) | AutoTracker Monthly Winners | Is Gmail et al, Blocking Our emails?
Find us on: Facebook & X | Posting Copyrighted Material
-
Join the TSP Talk AutoTracker: How to Get Started | Login | Main AutoTracker Page
You are using an out of date browser. It may not display this or other websites correctly.
You should upgrade or use an alternative browser.
You should upgrade or use an alternative browser.
Bear Cave 2 (Bull Allowed)
- Thread starter robo
- Start date


robo
TSP Legend
- Reaction score
- 471
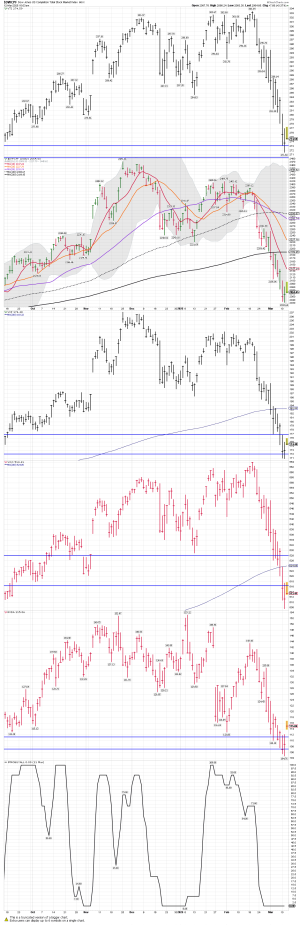
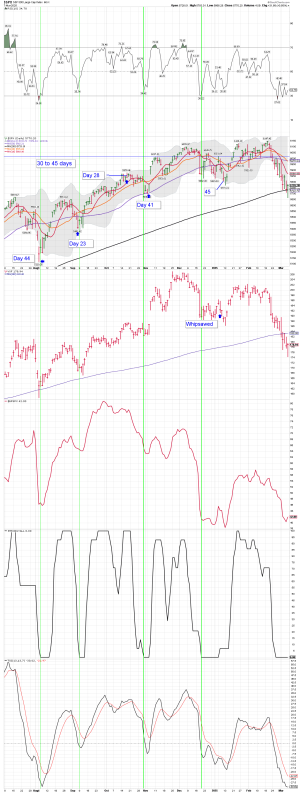
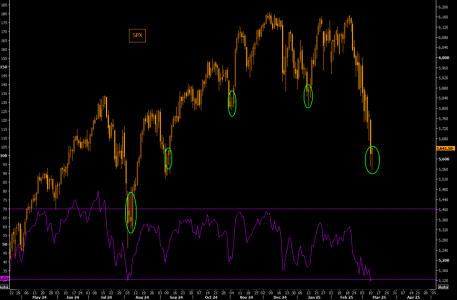
SPX daily: Bouncing around the 200 day MA....
Long some VOO ( Same as the C Fund) This is another ST trade. I'm still trading the daily charts, and that could be a mistake. We shall see how it plays out..
Bottom Line: The daily charts remain oversold.
Long some VOO ( Same as the C Fund) This is another ST trade. I'm still trading the daily charts, and that could be a mistake. We shall see how it plays out..
Bottom Line: The daily charts remain oversold.
Attachments

robo
TSP Legend
- Reaction score
- 471
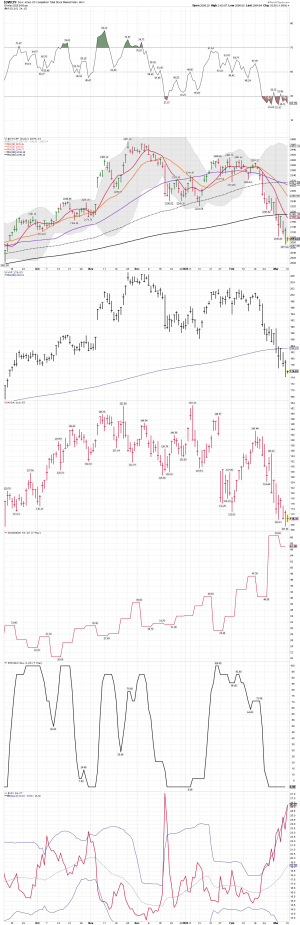
NVDA daily: Back testing the lows. I placed some limit orders based on the daily oversold chart. As I have been pointing out, if we are moving into the YCL any bounce will not hold for long.
We shall see how this one plays out, my last ST trade was a winner
This is a ST oversold trade based on the daily charts... win, lose or draw....
We shall see how this one plays out, my last ST trade was a winner
This is a ST oversold trade based on the daily charts... win, lose or draw....
Attachments

Last edited:
robo
TSP Legend
- Reaction score
- 471

robo
TSP Legend
- Reaction score
- 471
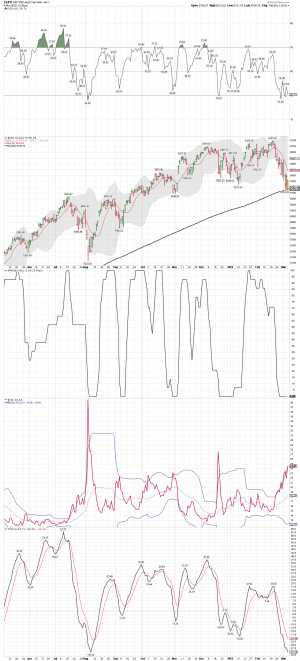
Small Caps daily: Another rough day for the S Fund and IWM. We shall see if the slightly higher low holds...
Bottom Line: Small caps remain oversold.....
Trading the daily oversold data..... The $VIX moving higher remains a concern
Bottom Line: Small caps remain oversold.....
Trading the daily oversold data..... The $VIX moving higher remains a concern
Attachments

Last edited:
robo
TSP Legend
- Reaction score
- 471
We shall see.....
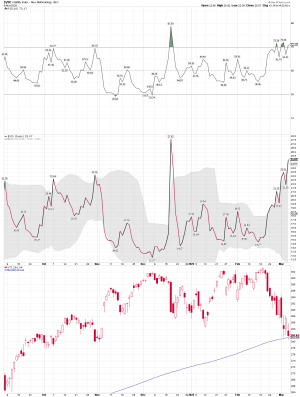
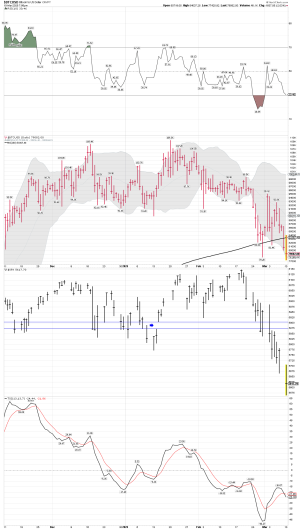
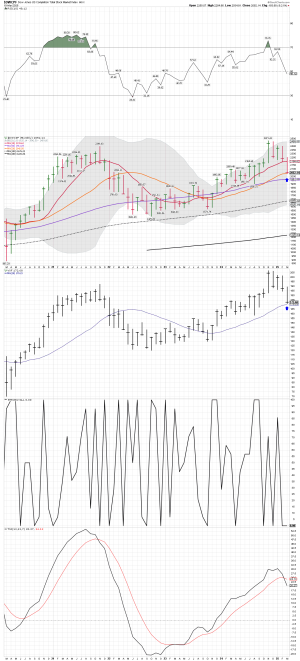
VIX daily chart: Waiting on the VIX to turn lower..... I'm trading the oversold daily....
Rare Triple Buy Signal Means a “V” Shaped Rally Is Ahead
Jeff Clark | Mar 7, 2025 | Market MinuteTraders should take advantage of any weakness to add long exposure to the stock market.
Attachments

Last edited:
robo
TSP Legend
- Reaction score
- 471
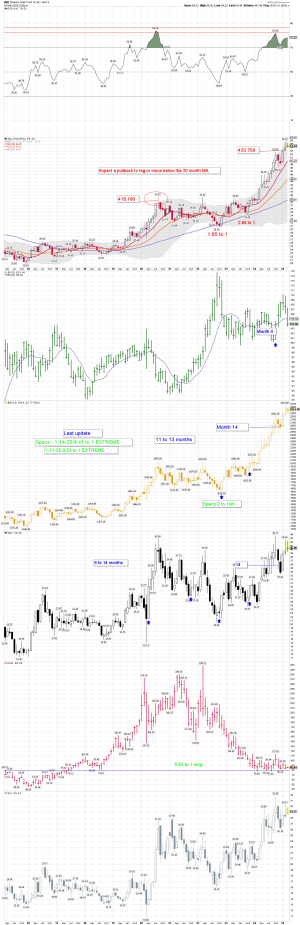
Daily Chart: Oversold and now on a buy signal, but not without above average risk. The VIX did move back inside the BBs. Still no turn of the PMObuy data, but the $BPSPX is turning higher. We shall see how it plays out next week. I'm still trading from the long side.
It looks like a stop of the bloodbath phase, but the indexes need to move back above the 200 day MA. What will they say about tariffs next week????
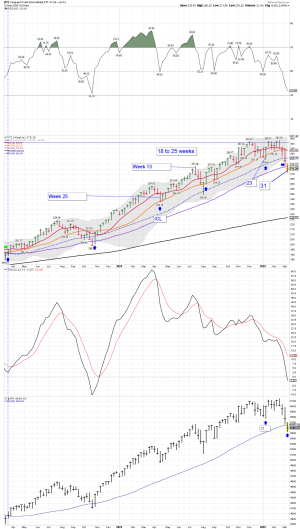
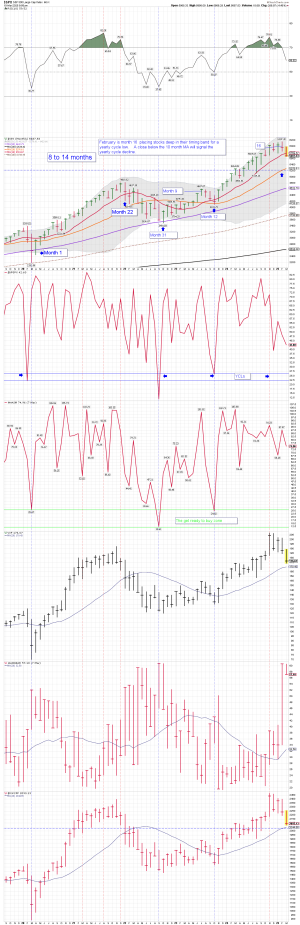
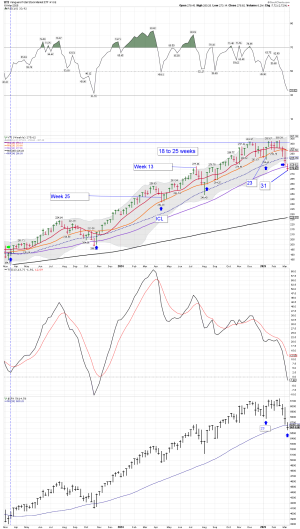
VT!/SPX weekly: A tag of the 50 week MA and a bounce..... A possible ICL in play.
It looks like a stop of the bloodbath phase, but the indexes need to move back above the 200 day MA. What will they say about tariffs next week????
VT!/SPX weekly: A tag of the 50 week MA and a bounce..... A possible ICL in play.
Attachments


Last edited:
robo
TSP Legend
- Reaction score
- 471
Daily chart and my current positions: I would like to see a higher low hold today on the daily chart... So far holding, but stocks are under selling pressure... Trading based on the daily charts, but the YCL could be in play... Tracking....
Long VOO, VXX, and NDVA
Undercuts in play..... We shall see how we close.
Long VOO, VXX, and NDVA
Undercuts in play..... We shall see how we close.
Attachments

Last edited:
robo
TSP Legend
- Reaction score
- 471


robo
TSP Legend
- Reaction score
- 471
Extreme Fear
March 10, 2025
Extreme Fear
Stocks dropped another 2.7% on Monday. That caused the CNN Fear & Greed Index to reach an Extreme Fear reading of 15. Which is the lowest reading over the past year. The market has rallied in t…
 likesmoneycycletrading.blog
robo
TSP Legend
- Reaction score
- 471
It is early in the session, but SPX has put in a hammer candle so far. Needless to say, we are at very oversold levels. Note previous hammer/inverted hammer candles led to the SPX bouncing. These types of candles post aggressive moves should be observed closely. A confirmation up, and it could be the signal for a short term bounce. The forced mechanical flows into low liquidity will work both ways. Become a Premium subscriber here to see why it could be equally violent on the way up if we bounce.
 themarketear.com
The Market Ear | Live news, analysis and commentary on what moves markets and trading | The Market Ear
The Market Ear | Live news, analysis and commentary on what moves markets and trading
themarketear.com
Attachments
robo
TSP Legend
- Reaction score
- 471

robo
TSP Legend
- Reaction score
- 471
The rally over the last two years has helped investors forget that markets also go down. After two +20% consecutive years, a sudden 8% drop from recent highs has investors panicking. Bear in mind, no pun intended, that the S&P 500 is only down 4% for 2025. Consider the graph below. It shows that the running five-day put volume set a record. So the question is whether we are now in a topping process with more losses to come or on a short break from the bull market. To rephrase the question, should we buy the dip or sell the rip?
Buying the dip implies the market is nearing a bottom. This presumes investors will get comfortable with tariffs and fiscal spending cuts. Possibly, it also means that Trump’s other plans, like lower taxes and looser regulations, generate optimism. We can’t rule out a more dovish Fed to boost optimism. Moreover, earnings expectations do not decline much despite signs of slowing growth.
Conversely, selling the rip implies the market is in a topping process. Furthermore, it likely means below-average growth or even a recession.
So are we buying the dip or selling the rip? The answer may be both. We do think the market is very oversold. However, the macroeconomic landscape is deteriorating, and we believe it will be hard for earnings to match current expectations. However, we rely heavily on technical indicators. This helps keep a level head when bad decisions are more likely to get the best of us. We are leaning toward a rally but eventually selling the rip. In other words, let the market’s oversold condition normalize a bit. Moreover, if economic conditions continue to deteriorate and our important long-term indicators turn bearish, we may reduce exposure.

 realinvestmentadvice.com
Buying the dip implies the market is nearing a bottom. This presumes investors will get comfortable with tariffs and fiscal spending cuts. Possibly, it also means that Trump’s other plans, like lower taxes and looser regulations, generate optimism. We can’t rule out a more dovish Fed to boost optimism. Moreover, earnings expectations do not decline much despite signs of slowing growth.
Conversely, selling the rip implies the market is in a topping process. Furthermore, it likely means below-average growth or even a recession.
So are we buying the dip or selling the rip? The answer may be both. We do think the market is very oversold. However, the macroeconomic landscape is deteriorating, and we believe it will be hard for earnings to match current expectations. However, we rely heavily on technical indicators. This helps keep a level head when bad decisions are more likely to get the best of us. We are leaning toward a rally but eventually selling the rip. In other words, let the market’s oversold condition normalize a bit. Moreover, if economic conditions continue to deteriorate and our important long-term indicators turn bearish, we may reduce exposure.
Buy The Dip Or Sell The Rip?
Should we buy the dip or sell the rip? Explore whether it is time to trade the fluctuations and investor panic.
realinvestmentadvice.com