-

-
The Forum works well on MOBILE devices without an app: Just go to: https://forum.tsptalk.com
-
Please read our AutoTracker policy on the IFT deadline and remaining active. Thanks!
-
$ - Premium Service Content (Info) | AutoTracker Monthly Winners | Is Gmail et al, Blocking Our emails?
Find us on: Facebook & X | Posting Copyrighted Material
-
Join the TSP Talk AutoTracker: How to Get Started | Login | Main AutoTracker Page
You are using an out of date browser. It may not display this or other websites correctly.
You should upgrade or use an alternative browser.
You should upgrade or use an alternative browser.
Bear Cave 2 (Bull Allowed)
- Thread starter robo
- Start date
robo
TSP Legend
- Reaction score
- 471
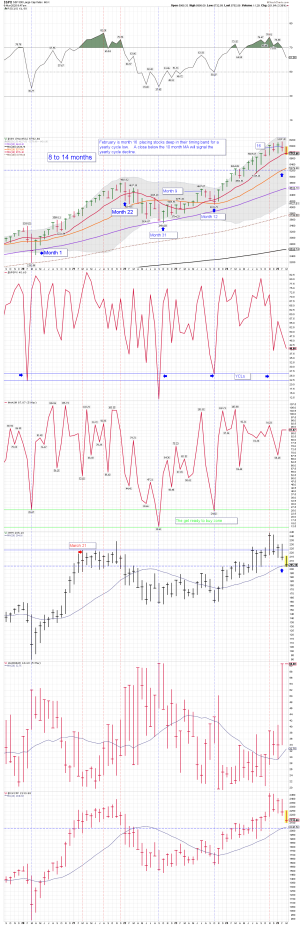
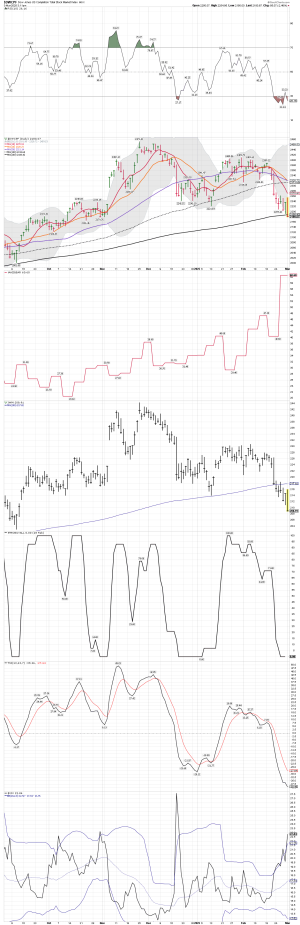
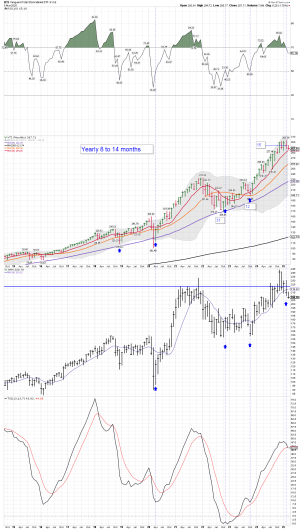
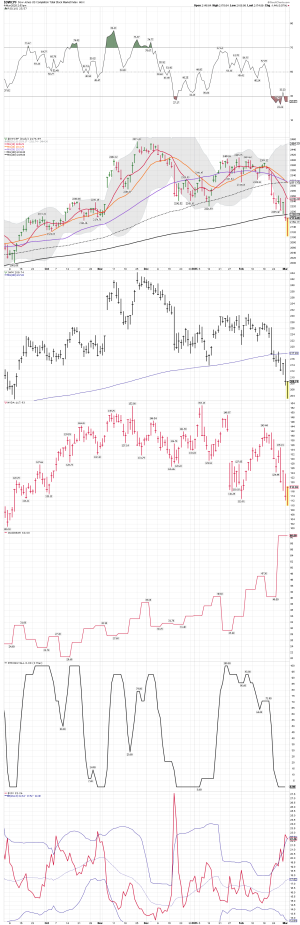
SPX monthly: The AIIBear data on the monthly is very Bearish (currently over 60ish) but some of the other indicators are not. I'm wondering if that has to do with the upcoming tariff talk... We shall see how it plays out.... For now, the monthly trend remains up.
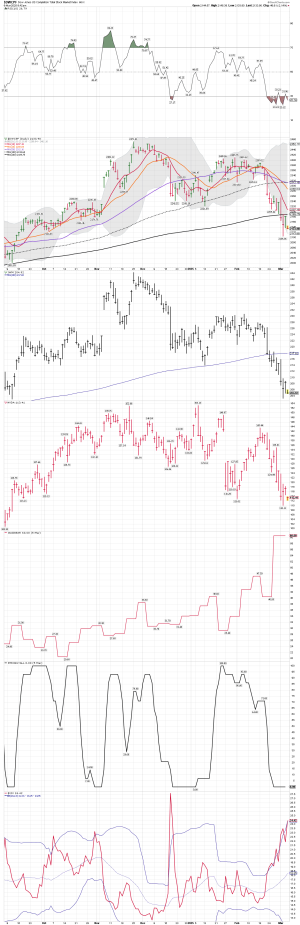
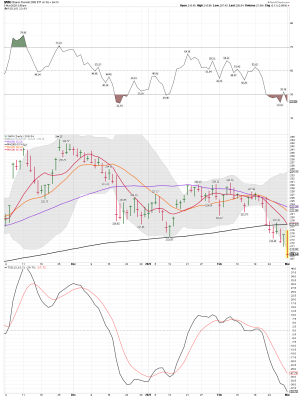
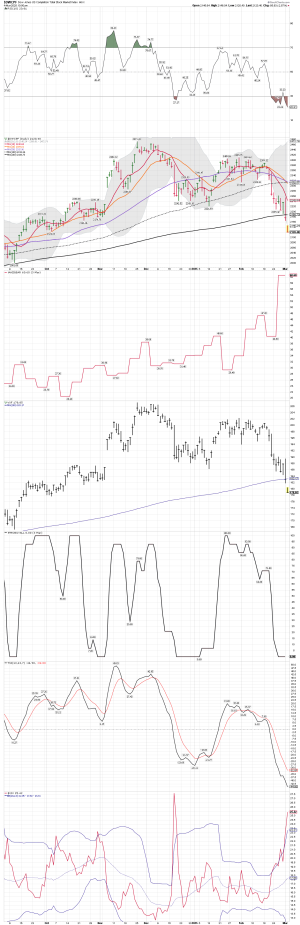
S Fund Daily: Oversold and it looks like it has bottomed.... A nice bounce Friday after getting very close to the 200 day MA.... Waiting on the next tariff comments....
S Fund Daily: Oversold and it looks like it has bottomed.... A nice bounce Friday after getting very close to the 200 day MA.... Waiting on the next tariff comments....
Attachments

Last edited:
robo
TSP Legend
- Reaction score
- 471
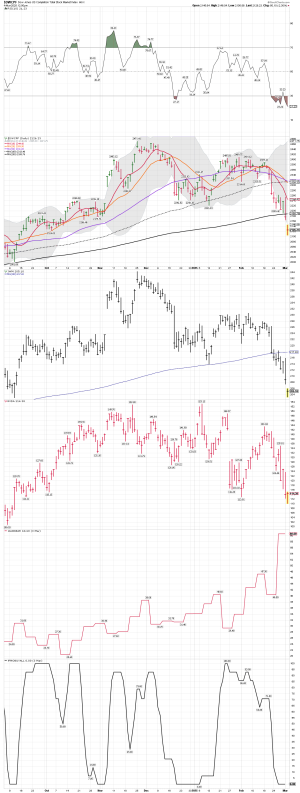
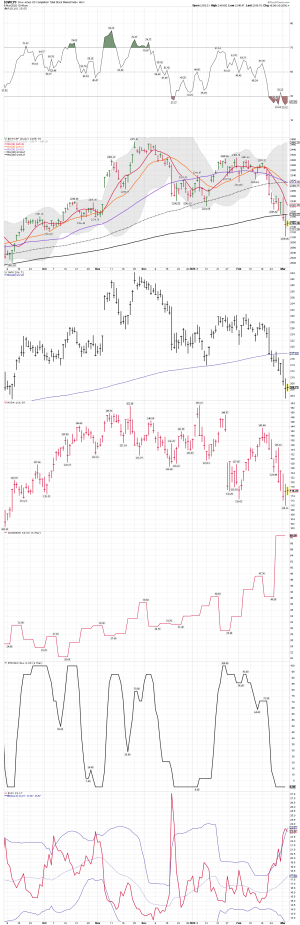
S Fund: Undercutting the 200 day MA today as the tariff talk ramps up.... We could see a nice bounce if the tariffs are delayed again...
I continue to watch the show..... I might place a small trade using IWM, in case the tariffs are delayed.
I continue to watch the show..... I might place a small trade using IWM, in case the tariffs are delayed.
Attachments
Last edited:
robo
TSP Legend
- Reaction score
- 471
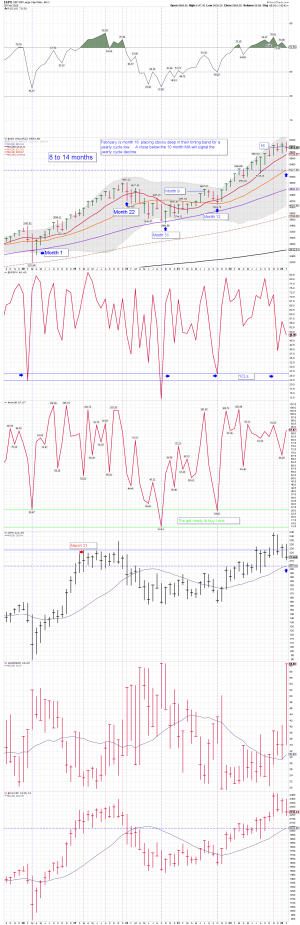
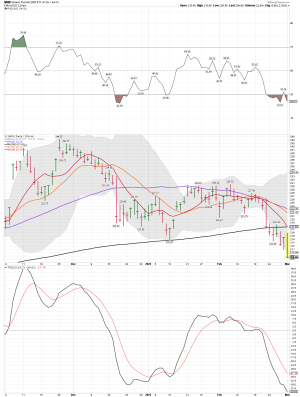
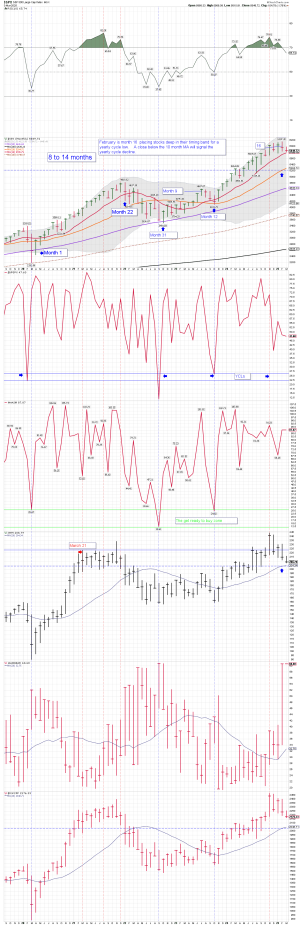
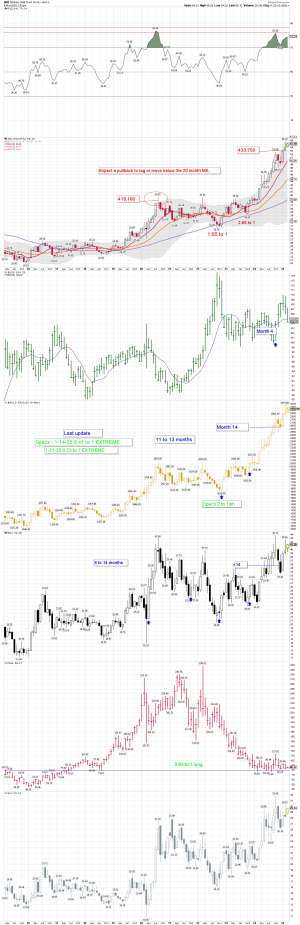
SPX monthly: I'm still watching to see if we might be heading into a YCL. A move below the 10 month MA would have to happen before a confirmed cycle signal would be in play.
IWM monthly: We shall see if IWM is leading the SPX into the ICL. This is month 2 since IWM moved below the 10 month MA.
What will Canada do? WOW!
What will Mexico and China do? We shall see how it plays out....
IWM monthly: We shall see if IWM is leading the SPX into the ICL. This is month 2 since IWM moved below the 10 month MA.
What will Canada do? WOW!
What will Mexico and China do? We shall see how it plays out....
Attachments
Last edited:
robo
TSP Legend
- Reaction score
- 471
We shall see....

 likesmoneycycletrading.blog
CNN’s Fear and Greed Index has registered “Extreme Fear” two consecutive days. And we. know what Mr Buffet would say … “Be greedy when others are fearful.”“
Fear
CNN’s Fear and Greed Index has registered “Extreme Fear” two consecutive days. And we. know what Mr Buffet would say … “Be greedy when others are fearful.””…
likesmoneycycletrading.blog
CNN’s Fear and Greed Index has registered “Extreme Fear” two consecutive days. And we. know what Mr Buffet would say … “Be greedy when others are fearful.”“
robo
TSP Legend
- Reaction score
- 471
robo
TSP Legend
- Reaction score
- 471
Taking profits, and I'm done for the day. We shall see what tomorrow brings. The daily chart remains very oversold....Agree. When midday reversals start too early, the bears tend to give it another go before the close. We'll see.
Attachments
robo
TSP Legend
- Reaction score
- 471
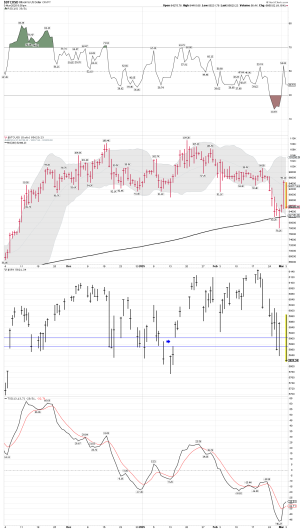
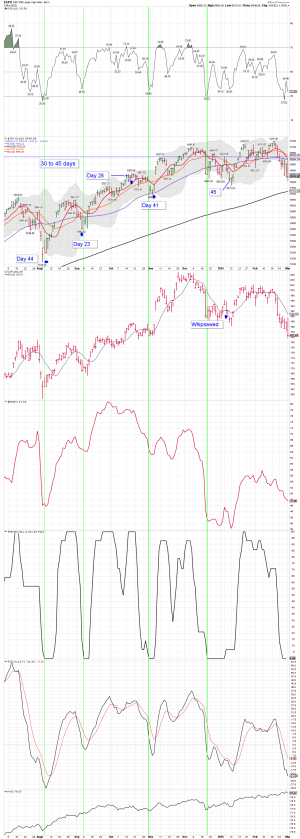
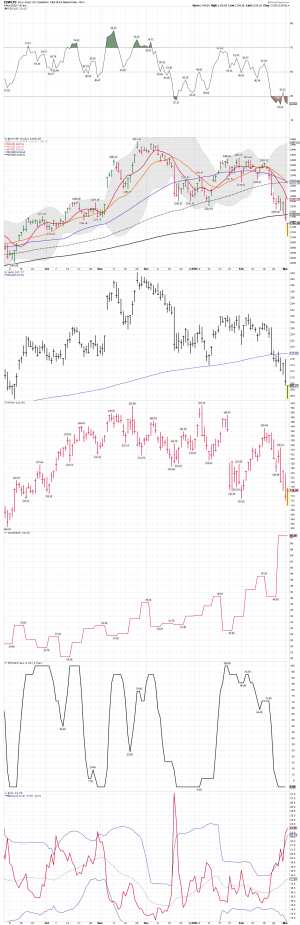
Daily trading charts: The VIX is moving down so we could get a buy signal once it moves back into the BBs.... The other indicators remain on a BTD if you are ST trading using the daily charts.... We shall see how it plays out, and if the S Fund can move back above the 200 day MA. The selloff was due since some sectors were very overbought. One never knows what will cause the ST exit. The odds still favor a oversold bounce, but some money is moving overseas into different sectors... Waiting on the next tariff comment. Good news or bad news???
The S Fund continues to see lower highs since the December high.... I'm still wondering if we are moving into a YCL
The S Fund continues to see lower highs since the December high.... I'm still wondering if we are moving into a YCL
Attachments
Last edited:
robo
TSP Legend
- Reaction score
- 471
SPX monthly and the YCL: The selloff gave the SPX a tag of the 10 month MA, but the BTDer's came in... This is the main chart I'm watching right now.
We shall see how it plays out.... Both IWM and the S Fund remain above their 10 month MA.... so the monthly trend remains up!
We shall see how it plays out.... Both IWM and the S Fund remain above their 10 month MA.... so the monthly trend remains up!
Attachments

robo
TSP Legend
- Reaction score
- 471
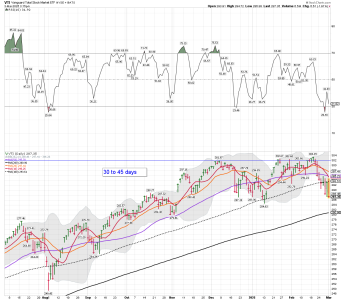
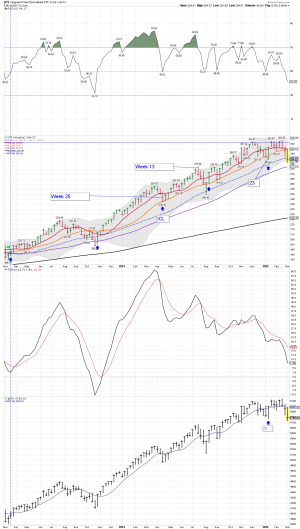
The SPX weekly: This is week 2 since the SPX and VTI moved below the 10 week MA. Getting closer to the 50 week MA. For the last couple of years the SPX pattern has only remained below the 10 week MA for 2 or 3 weeks. We shall see if the tariff talk causes a deeper selloff. Keep in mind valuation levels were at noise bleed levels in the weeks before the pullback.
Why track the daily? Used for ST trading.
Why track the weekly? Used for MT trading.
Why track the monthly: Used for LT investors.
Why track the daily? Used for ST trading.
Why track the weekly? Used for MT trading.
Why track the monthly: Used for LT investors.
Attachments
Last edited:
robo
TSP Legend
- Reaction score
- 471
Hold your nose and buy.
It doesn’t happen often. But, whenever the major market indexes decline towards their 200 day moving averages during a bull market, it pays to be a buyer of stocks.
Look at these long-term charts of SPY and QQQ – the exchange-traded funds for the S&P 500 and Nasdaq 100…
LOL.... Ok Jeff, I did. We shall see how it plays out!
robo
TSP Legend
- Reaction score
- 471
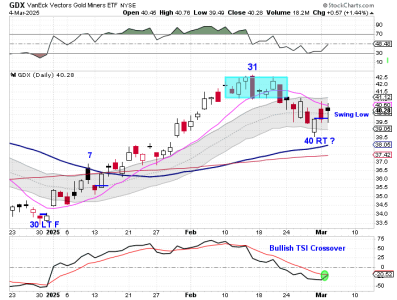
Gold miners: I currently have NO position in this sector..... I wait!
Gold Monthly chart:
The Miners formed a swing low on Monday.

 likesmoneycycletrading.blog
Gold Monthly chart:
The Miners formed a swing low on Monday.
Miners Form Swing Low
The Miners formed a swing low on Monday. The Miners printed their lowest point on Friday, day 40, placing them in their timing band for a daily cycle low. The Miners are still in their daily uptren…
likesmoneycycletrading.blog
Attachments
robo
TSP Legend
- Reaction score
- 471
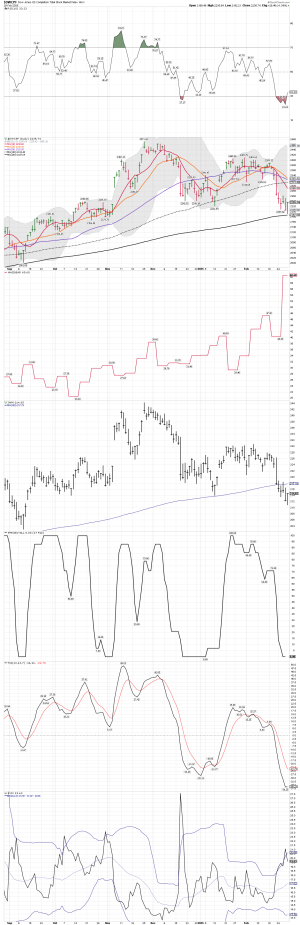
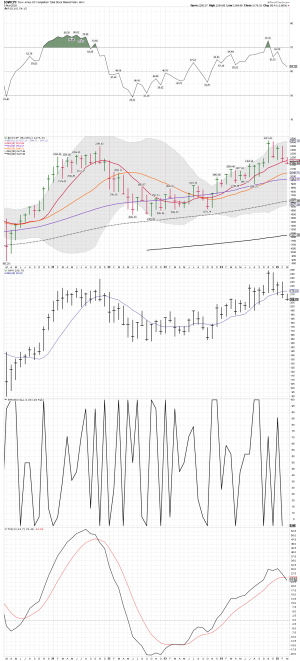
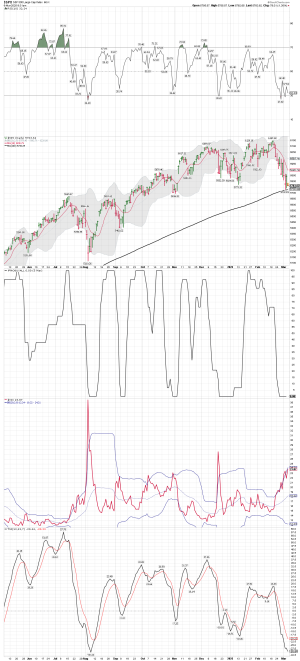
SPX daily: What will it be next? Another tag of the 200 day MA ( a back test), maybe an undercut of the 200 day MA, how about a higher low, or maybe a lower low.....
Bottom Line: Buckle up because NO ONE knows for sure.... Since we are still over sold on the daily charts, I'm ST trading from the long side. We shall see how it all plays out.
Bottom Line: Buckle up because NO ONE knows for sure.... Since we are still over sold on the daily charts, I'm ST trading from the long side. We shall see how it all plays out.
Attachments
robo
TSP Legend
- Reaction score
- 471
Small caps daily: All I can say is they are just looking ugly!
Some indexes are beating the SPX and small caps.
 likesmoneycycletrading.blog
Some indexes are beating the SPX and small caps.
Seeking Out Performance – 5/06/25
Outperformance is the act of producing better results. One way to measure the performance of an asset is to compare it to the S & P 500. The Health Care Sector has been out performing the S &am…
likesmoneycycletrading.blog