Bear Cave 2 (Bull Allowed)

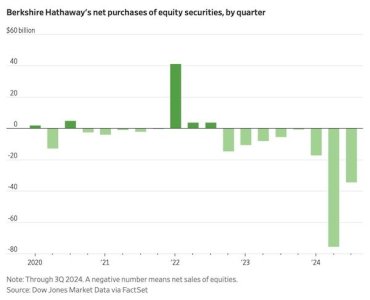
As a result, Warren Buffett’s company has raised its cash holdings to the highest level as a percent of assets on record.

It's interesting that, in the chart you posted, they had their biggest net purchasing in early 2022 when that bear market was just getting started.

They don't claim to be market timers, and it eventually worked out, but ouch. They could have waited a while.

tsp-022225a.jpg

tsp-022225b.gif
 
Last edited:
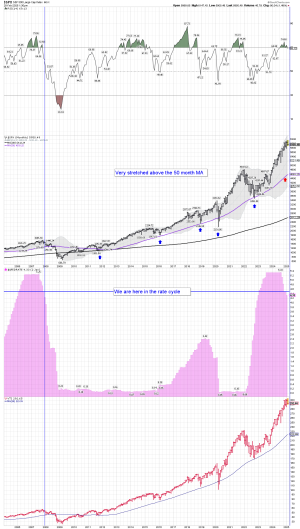
It looks like they have been selling into strength. Not sure what sectors they were buying during that time frame you mentioned, but he still made lots of gains. He bought a tad early during the 2008 Bear too. Right now they are looking at valuations that are very extreme so they are buying T notes, and continue to sell stocks. What is his yearly return with 320 billion of T notes earning around 5%, as they wait for the next correction? He still owns some stocks.... I think they are waiting until PE ratios are back to around 20ish again which is more normal before buying again. I'm sure they will scale in a tad early again knowing that are looking for LT gains. We shall see how it all plays out, and what happens with the tariffs. They must believe the risk/reward is way to high to have an extra 325 billion in stocks.

Have a nice weekend.

Costco with a PE of 60..... Crazy, and very extreme....


Attachments

  • a.png
    a.png
    108 KB · Views: 10
Last edited:

The Government Deficits Land in the Deepest Pockets​

Print Friendly, PDF & Email
john_hussman_thumbnail.jpg


John P. Hussman, Ph.D.
President, Hussman Investment Trust

February 2025​


With our most reliable valuation measures more extreme than both the 1929 and 2000 market peaks, we continue to believe that the stock market is tracing out the extended peak of the third great speculative bubble in U.S. history. Since the initial January 2022 market peak, the equal-weighted S&P 500 has clocked a cumulative total return less than 2.4% ahead of Treasury bills, while the small-cap Russell 2000 has lagged T-bills by -10.6% since then. The capitalization-weighted S&P 500 Index has performed better during this period only by driving the price/revenue multiple of the information technology sector to levels that easily exceed the 2000 extreme.

While record valuations, unfavorable market internals, and recurring warning flags have held us to a bearish outlook since the June comment, You Can Ring My Bell, our investment discipline has benefited despite a further market advance since then, partly as a result of the hedging implementation we introduced in the fourth quarter (see the section titled “Good News and Good News” in the October comment, Subsets and Sensibility).


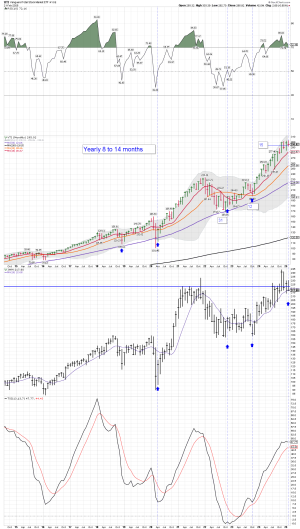
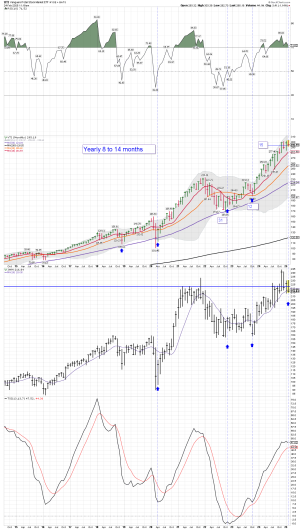
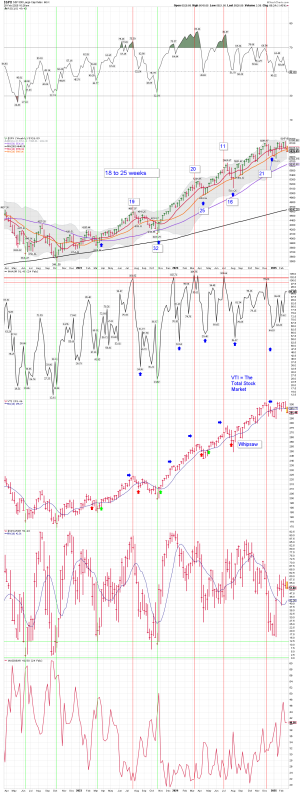
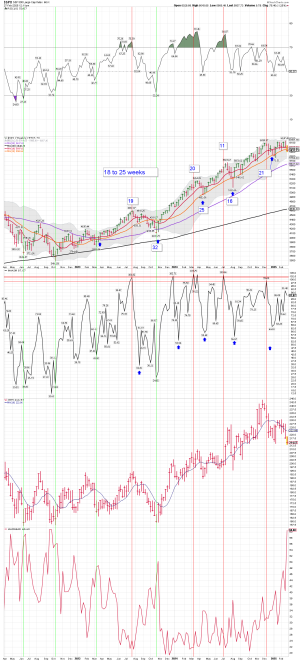
Monthly data: Watching to see if we are headed into a yearly cycle low.... That would normally take the SPX below the 20 month MA.

I remain a watcher as we get closer to the tariff deadline....

Pass the popcorn!

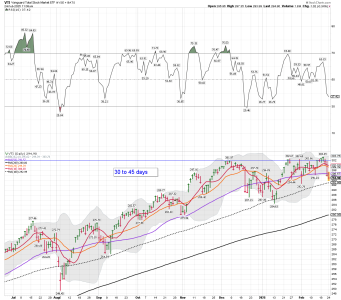
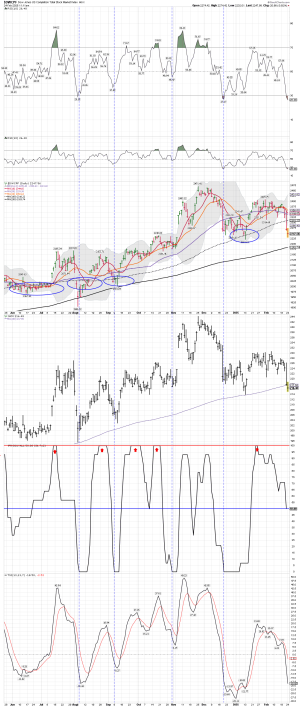
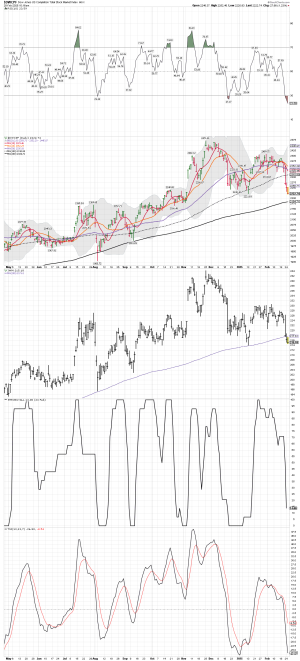
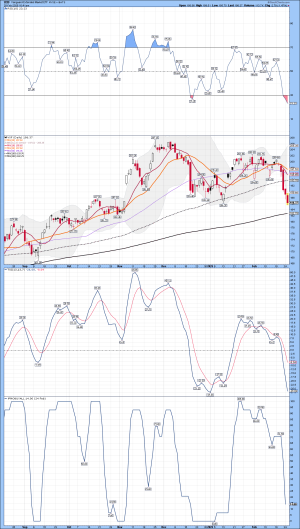
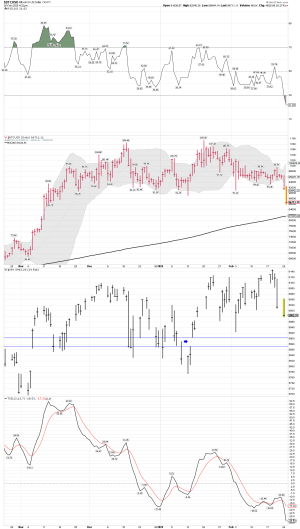
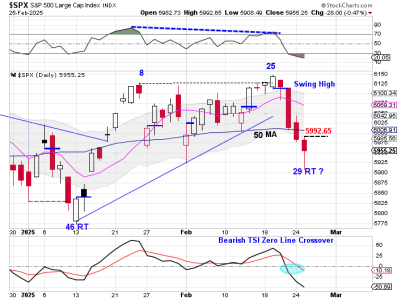
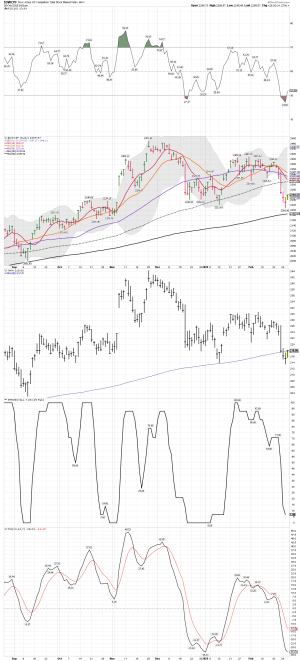
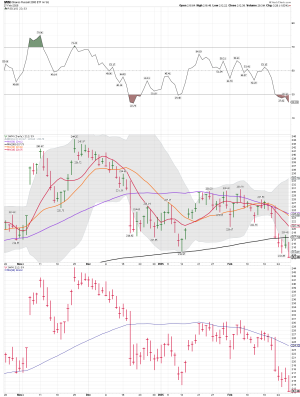
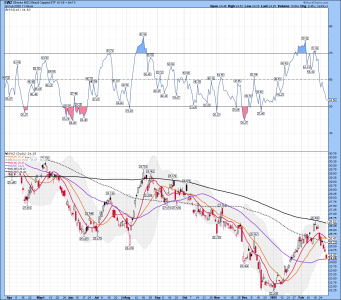
S Fund daily cycle: Getting closer to the 200 day MA. Buying a tag of the 200 day MA has been a very nice winner in the past....Buyers are already coming in this morning.... However, we shall see if we are headed into a YCL which could tag the 2000ish area. See the first chart.
 

Attachments

  • $SPX (5).png
    $SPX (5).png
    190.1 KB · Views: 10
  • VTI.png
    VTI.png
    79.2 KB · Views: 10
  • $DWCPF (4).png
    $DWCPF (4).png
    182.5 KB · Views: 8
  • VTImonthly.png
    VTImonthly.png
    107.7 KB · Views: 6
Last edited:
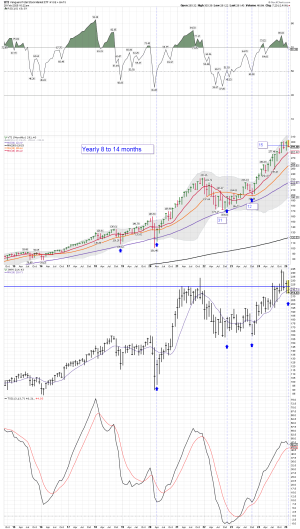
S Fund: Getting closer to a tag of 200 day MA and a buy signal on the daily. However, my focus remains on the monthly data... For now, the trend remains above the 10 month MA, but still watching to see if the YCL is in play. ( I track and trade VTI at Vanguard. This will be month 16 since last tagging the 20 month MA.)
 

Attachments

  • $DWCPF (5).png
    $DWCPF (5).png
    173.9 KB · Views: 7
  • $DWCPF (6).png
    $DWCPF (6).png
    156.5 KB · Views: 7
  • VTI (1).png
    VTI (1).png
    107.3 KB · Views: 6
  • $SPX (6).png
    $SPX (6).png
    204 KB · Views: 5
  • $SPX (7).png
    $SPX (7).png
    190.1 KB · Views: 4

Attachments

  • VXF.png
    VXF.png
    133.1 KB · Views: 4
  • VXF (1).png
    VXF (1).png
    59.8 KB · Views: 5
Last edited:
Coin and the SPX daily: Coin getting closer to tagging its 200 day MA, and the SPX closer to filling a gap... Coin is oversold on the daily, and buyers are starting to come in... We shall see how it plays out, and if dippers come in as the daily is oversold.
 

Attachments

  • $BTCUSD (4).png
    $BTCUSD (4).png
    83 KB · Views: 5
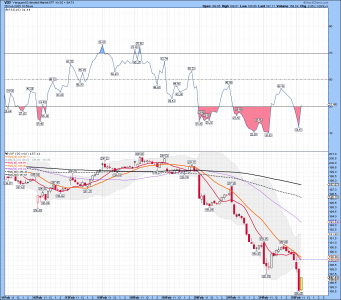
VXF: Watching to see if the 185.00ish low holds.... Testing the lows...
 

Attachments

  • a.png
    a.png
    62.5 KB · Views: 7
  • a.png
    a.png
    49.8 KB · Views: 5
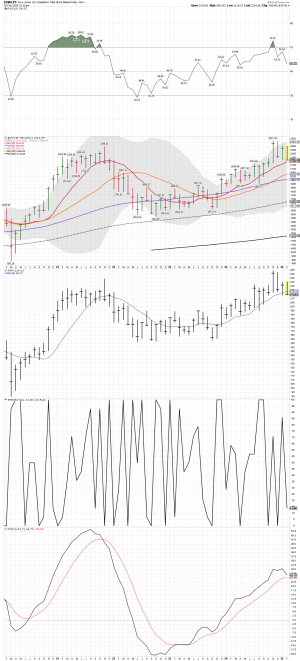
Monthly and the YCL: Today I posted some daily charts I use for ST trading, but don't take your eye off of the MT data and the upcoming tariff comments. In my opinion risk management is very important right now as a possible move into a YCL odds are increasing. It has been a nice 16 month run above the 10 month MA with only one tag during the run.

SPX monthly:
 

Attachments

  • a.png
    a.png
    191.3 KB · Views: 8
  • a.png
    a.png
    93.9 KB · Views: 6
Last edited:

We shall see how it plays out.... The daily remains oversold!
 

Attachments

  • a.png
    a.png
    22.1 KB · Views: 7
  • Sfund.png
    Sfund.png
    144.7 KB · Views: 8

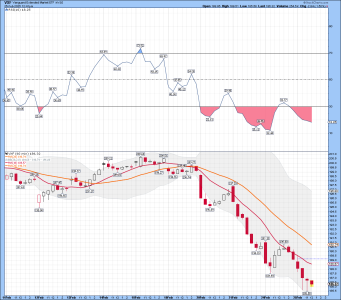
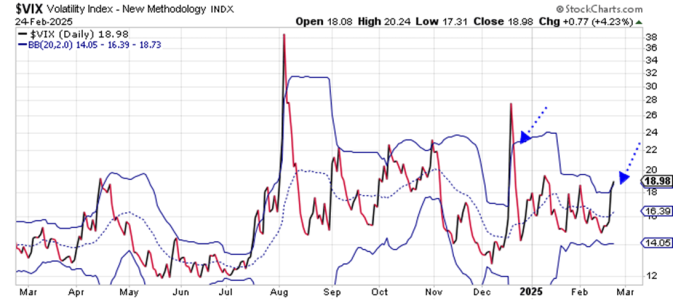
A DCL and a VIX buy signal on the daily charts: We shall see if it has legs....

The Volatility Index (VIX) is about to generate its first “buy” signal of 2025.

The VIX gave us eight buy signals in 2024. All of them came within a day or two of at least a short-term low in the stock market. And all of them were good for a rally of at least 100 points in the S&P 500.

So, while it has been a tough time for the bulls over the past few days, they can look forward to some positive action once the VIX generates a buy signal – which could happen as soon as today.

Look at this chart…
 

Attachments

  • vix.png
    vix.png
    218.8 KB · Views: 9
  • Sfund.png
    Sfund.png
    144.8 KB · Views: 9
  • $DWCPF (7).png
    $DWCPF (7).png
    183 KB · Views: 6
A RIF of around 700,000 and the talk of tariffs is up next....


Tariff talk and stocks are moving lower.... We shall see how we close.... But one would think buyers will come in....

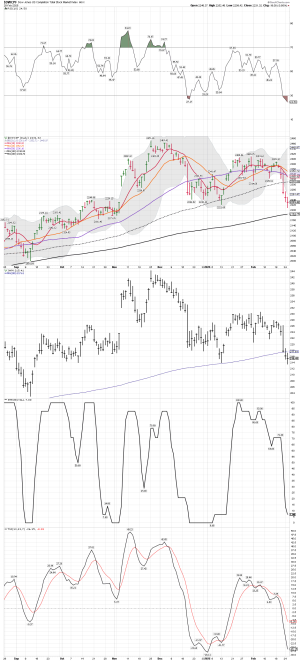
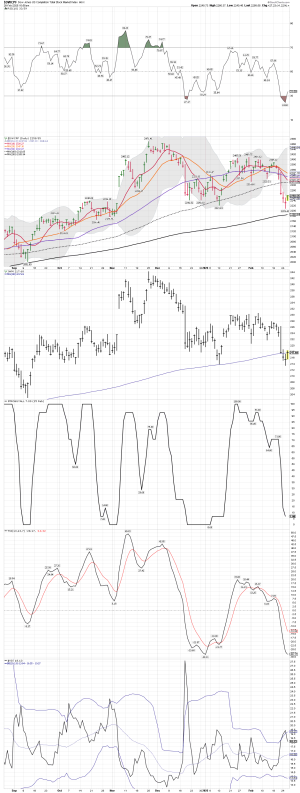
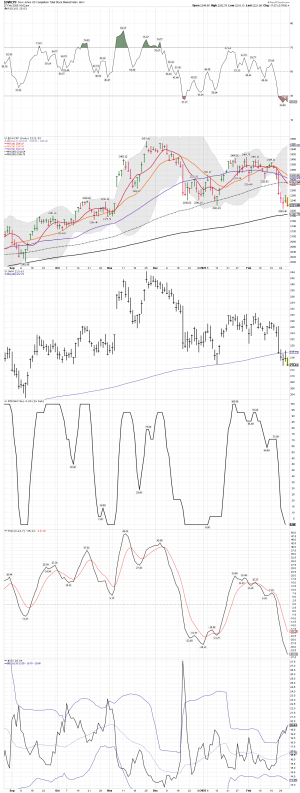
The daily remains very oversold, and the PMO did hit zero.... The VIX moving higher....
 

Attachments

  • a.png
    a.png
    193 KB · Views: 5
Last edited:
SPX/IWM weekly: The SPX is still unable to move back above the 20 week MA. We should continue to see more swings as we move into March and the tariffs come more into play.
 

Attachments

  • $SPX (9).png
    $SPX (9).png
    182 KB · Views: 4
The indicators and the odds are lining up for an oversold bounce. We shall see how it plays out. I'm waiting to see it the tariffs are put into place.


It’s time for a bear-busting rally.

The American Association of Individual Investors (AAII) reported yesterday that over 60% of its survey respondents were bearish on their outlook for the stock market for the next six months. Only 19% were bullish.

That’s the most lopsided report we’ve seen in several years. And from a contrarian perspective, it’s bullish.

Back on November 13, 2024 – following the large, post-election rally that pushed the S&P 500 above 6000 for the first time ever – bulls outnumbered bears 50% to 28%. From a contrarian perspective, that was bearish. And stocks have struggled to make any headway since then.

Now, with the S&P 500 still stuck near 6000 and trading down just 2% from its all-time high, the vast majority of investors have turned bearish. It’s remarkable that two months of choppy, back-and-forth action can create that drastic a shift in sentiment. This is the sort of bearish reading we’d typically get following a 10% to 15% decline in the market.

So, there’s plenty of fuel to power the stock market higher from here.

Now, though, with the AAII survey showing such a large bearish sentiment (a contrary indicator), if stocks start to move higher, then we could see a dramatic rally over the next few weeks as bearish investors flip to bullish and chase stock prices higher.

Traders should use any weakness over the next few days as a chance to add long exposure to the stock market.

I remain flat, but watching VXF for a ST trade.

VXF 60 minute chart: It might be trying to bottom around 185ish....
 

Attachments

  • $DWCPF (8).png
    $DWCPF (8).png
    201.3 KB · Views: 7
  • VXF (2).png
    VXF (2).png
    68.9 KB · Views: 7
Last edited:

Retail Investors Are Suddenly Bearish​

michael-lebowitz-and-lance-roberts_avatar-46x46.png
By RIA Team | Feb 28, 2025

The American Association of Individual Investors (AAII) sentiment indicator claims that 60.6% of the retail investors are bearish. The percentage of bears in its survey increased sharply from 40.5% at the prior reading on February 19. The AAII retail investor survey is now the most bearish it has been since September 2022. More stunning, this is only the sixth time since 1987 that bearish sentiment has been above 60%. Furthermore, the five-week change in the index is the third largest in history.

The graph below shows that a similarly high level of retail investor bearishness occurs most often when the market has already declined significantly. Some may argue that political sentiment may dramatically impact the current reading. While we certainly have seen that in other surveys, the jump in bearishness occurred over the past week, not when Donald Trump became President.

An old Wall Street adage goes, “When everyone is on one side of the boat, go to the other.” Sentimentrader qunatifies whether the advice is worth following. In its analysis, as shown in the Tweet of the Day, of the other five times bearishness was above 60%, the average return six months later was +14.26%, increasing to 22.35% for twelve months. The S&P 500 was up six months later in four of the five instances. Moreover, the market was positive in all instances, looking out for a full year.
 

Attachments

  • a.png
    a.png
    122.7 KB · Views: 8
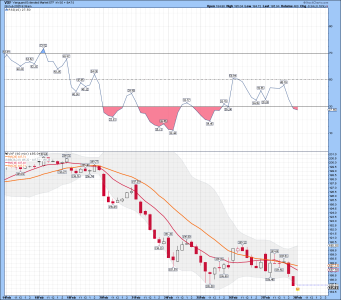
I placed a limit order to buy some shares of VXF at Vanguard for a oversold ST trade.

Long @ $184.77

I'll be using a stop....
 

Attachments

  • VXF (3).png
    VXF (3).png
    50.3 KB · Views: 9
Last edited:
EWZ Brazil daily: A tag of the 50 day MA, and an index I'm watching for a trade.
Watching to see if the 50 day MA holds, and we get a bounce. The 200 day MA remains tough resistance.
 

Attachments

  • a.png
    a.png
    88.4 KB · Views: 5
Last edited:
Back
Top