Bear Cave 2 (Bull Allowed)

"I know nothing of your history and am better for it. Have a good day"

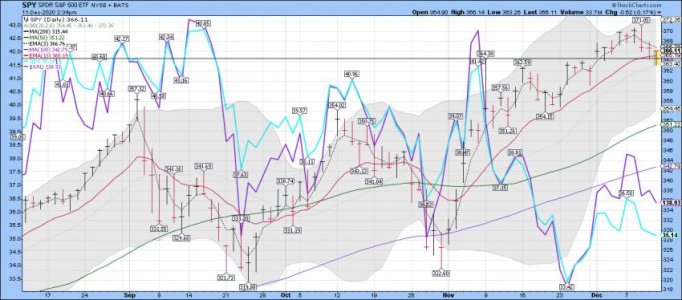
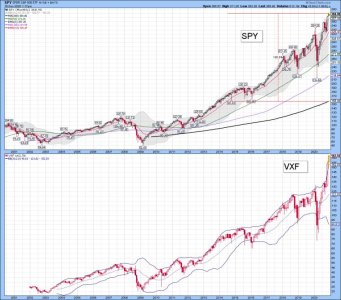
I post data about my trading system (which is currently long) and other data about risk/management ( the risk of being long).

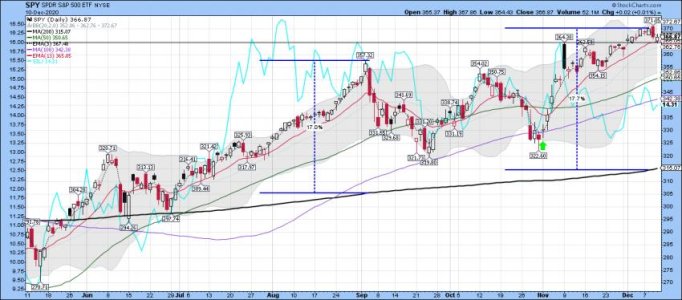
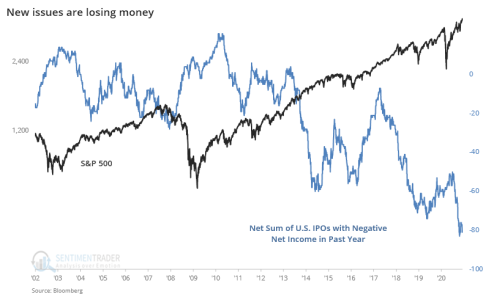
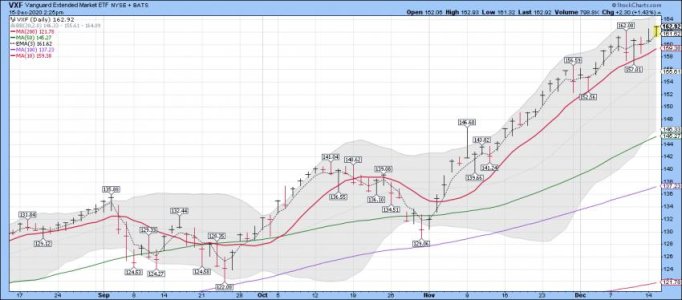
Bottom Line: My trading system remains long, but the medium term data is warning one should have taken some profits after a very nice run. My system is based on a mechanical trading system ( numbers) and has NO OPINIONS or GUESS WORK on how I'm positioned. I also use over 10 indicators for risk management and position size. Some are now hitting historical extremes again.

The trend remains up, but with lots of RISK now!

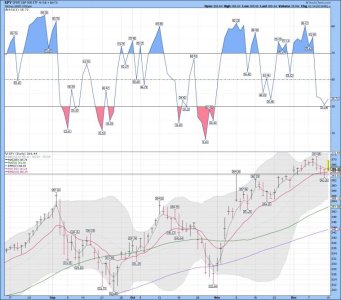
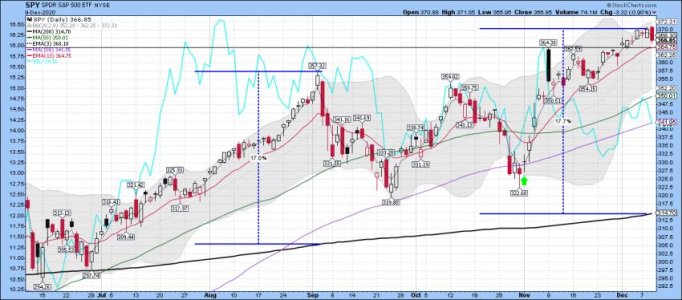
My last buy signal was 28 days ago when the SPY moved above the 3 ema, and it was confirmed once it moved above the 13 ema. It remains in place for now. No guess work or opinions in my trading system. My work will probably just confuse you if you don't understand how trend trading works or how to trade using moving averages. In the short term anything can happen, but the medium term is sending out BIG warnings signals about having to much money in stocks. I currently only have a 10% position after reducing on the way up. Keep in mind I'm 70 so when I'm 100% long my stock position is only 30% of my total account. The rule of 100 is a good average for those of us that are NOT greedy....

I have posted before how my trading system works, and why I trend trade. It is system based on data only.

The "Trading Edge"

"Without a crystal ball, you can't know the future direction of stock prices with any amount of certainty, regardless of whether you use fundamental or technical analysis.

However, once you recognize the market prices are the result of millions of investors who "believe" they know the direction prices are going to take, you have the "key" to beating the markets.

Knowing that prices are based on the beliefs of the masses is your "trading edge."

If you look at any long term chart of the financial markets, you will see that "most" of the time, the markets are moving up or down in trends that last many months, and sometimes years.

These "trends" reflect the "beliefs" of all those investors. And those "beliefs" are controlled by the "emotions" of fear and greed.

While prices are rising, the majority of investors "believe" they will "continue" to rise.

While prices are "falling" the majority of investors "believe" they will "continue" to fall.

Because emotions are involved, you will see more investors buying near tops and pushing prices higher than anyone expected they would go.

And of course, because emotions are involved, you will also see more investors selling near bottoms, pushing prices lower than anyone expected they would go.

This has been going on since the beginning of free market trading."

https://www.fibtimer.com/about/prior_commentaries.asp

https://www.youtube.com/watch?v=3DeTQt9cjiU&feature=emb_logo
 

Attachments

  • aa.jpg
    aa.jpg
    69.7 KB · Views: 99
Last edited:
Keep in mind I'm 70 so when I'm 100% long my stock position is only 30% of my total account. The rule of 100 is a good average for those of us that are NOT greedy....

or made appropriate savings decisions earlier in life and don't have to gamble on TSLA, SNOW or ABNB.
 
LOL..... You are correct Brother! I take NO risk with the money I have put away for my wife. I have over 500k in CDs making around 3.5% for at least 2 more years. I bought them a few years ago before the Fed took the rates to zero. I laddered them for my wife at two different credit unions, and I'm debt free, house, cars, etc.... The money I have in the markets now is money I will never need because I have plenty of monthly income. I'm one of the lucky ones and get around 6k a month. SS for both of us, retired military etc..... I'm not bragging just pointing out why my max stock position doesn't go very high (only 30%), and with my current risk indicators my position is only 10%. After the next sell off and there will be one, I will increase my position at Vanguard back closer to a 30% position. Those CDs have nothing to do with my trading accounts and I have 4 of them. Some are for gambling, some are for trading, and some for investing. I pretty much trade for fun these days, but do follow my trading system which is unbiased when it comes to buy or sell signals. There has been some nice trend trading the last few years. I use SDS and SSO in one of my accounts, and there is NO shorting at Vanguard and I mainly use VXF for long positions.

Day 28 of this confirmed uptrend, but we are testing the 13 ema again....

I remain long!

Good Trading.

Take Care.
 

Attachments

  • aa.jpg
    aa.jpg
    65.8 KB · Views: 81
Last edited:
VXF remains in a uptrend, but at a risk level that is extremely high. It has NEVER been this stretched above its 200 dma.... VXF is like the S fund.

It hasn't touched the 13 ema once since the current uptrend was confirmed. I use the daily data to trade. Easy money, and we had NO whipsaws so far.... This trend was easy to trade.... I use the closing price for the 13 ema, but I have unlimited moves at Vanguard so it's easy to buy back my shares if I do get whipsawed.... TSPer's cant do that with limited moves.

https://stockcharts.com/h-sc/ui?s=VXF&p=D&yr=1&mn=0&dy=0&id=p89552215099&a=853271537
 

Attachments

  • aa.jpg
    aa.jpg
    66 KB · Views: 85
Last edited:
VXF - The move up continues...... 29 days for this run....
 

Attachments

  • aa.jpg
    aa.jpg
    84.8 KB · Views: 79
SPY - Day 3 under the 3 ema and having some trouble at the 13 ema..... We shall see how this plays out..... Since it's easy money Monday coming up, and Options Expiration is next week, one would think the bulls got this.... With that said, if we close bellow the 13 ema I'm out as that is a sell signal for me. We have way to many risk/reward indicators at extremes to hold on for now. I will buy back shares if I get whipsawed once I get my next buy signal.

https://www.marketwatch.com/optionscenter/calendar
 

Attachments

  • aa.jpg
    aa.jpg
    68.1 KB · Views: 76
Heading for 3590's by late December. Thinking the January effect will bring the next ramp to around 4,000.
 
Still watching this possible repeat pattern.... Looking to buy back my shares of SILJ. I wait to see how the current move up for SPY plays out.... Getting deeper into this cycle with lots of extremes being hit..... These divergence patterns usually convergence at some point....
 

Attachments

  • aa.jpg
    aa.jpg
    71.1 KB · Views: 70
Well, we should expect next week to be up, but my system is close to a sell signal...

Friday was day 3 with a close below the 3 ema, and day 2 below the 10 sma. I use the 13 ema so it's holding, but with the MACD turning down I will be looking to sell after recently reducing my position....

Good Trading!
 

Attachments

  • aa.jpg
    aa.jpg
    85.9 KB · Views: 56
Don't forget that this is stock market magic week, and the guy behind the curtain speaks Tuesday. It might provide some stock market swings for those that like to trade.


Options Expiration Calendar 2020

https://www.marketwatch.com/optionscenter/calendar

The Wizard speaks on Tuesday... LOL.... rates will remain unchanged for years, and the congress needs to do more.....

https://www.marketwatch.com/economy-politics/calendar

I'm still waiting to buy SILJ back as it remains on a sell signal..... It's still making lower highs, and below all the ema's I use for trading. It has been slowly moving down since August - as stocks are what most want to buy these days. Well, except the insiders and the smart money because they continue to sell stocks to the dumb money. However, hard to call them dumb since the trend remains up.

My system remains on a buy signal too, but with a reduce position size. I'm still keeping my eye on the divergence between SILJ and SPY. At some point they will convergence....

Bottom Line: The trend remains up!
 

Attachments

  • aa.jpg
    aa.jpg
    93.5 KB · Views: 55
Last edited:
Easy money Monday off to a good start.....

Investors have never been so hungry to lose money

Jason Goepfert
Published: 2020-12-14 at 09:00:00

The hunger for new issues is voracious and bankers trying to pad year-end bonus numbers can't keep up. Their new stocks are making money, but the companies themselves certainly are not.

Here's the Wall Street Journal, writing about DoorDash (abbreviated, with highlights added):

https://www.sentimentrader.com/blog/investors-have-never-been-so-hungry-to-lose-money/
 

Attachments

  • aa.png
    aa.png
    59.1 KB · Views: 52
A nice gap up and back above the 3 ema..... Easy money Monday! New all time highs coming this week? We shall see....

Bottom Line: The trend remains up.
 

Attachments

  • aa.jpg
    aa.jpg
    77.4 KB · Views: 57
Guess the "pullback" happened on Friday. I'm wondering when this end of the year selling will happen, particularly the tax loss harvesting for value stocks.

Realistically, this is the last week of trading before new year. Those stocks that underperformed due to the shutdowns will be under pressure. Most of my holdings are getting whacked today but none of them are high flyers.
 
SPY is again having trouble staying above the 3 ema today after a nice gap up. I will see how we close, but I already reduced down to a 10% position.

There are several very important risk/reward indicators that caused me to reduce, but these were the most important ones hitting extremes.

Data: ROBO, Dumb money buying, Smart Money/Insiders selling, Options Speculation Index, and the current risk appetite by traders.

I get this data mainly from Sentiment Trader, but not all....

https://twitter.com/SentimenTrader

I remain long with only a 10% position.

Bottom Line: The trend remains up!

Again, the SPY is still having some trouble holding above the 3 ema, but the Bulls/Buyers are clearly in charge as most LOVE STOCKS! This will be day 4 IF we close below the 3 ema.... I use the closing prices for signals, but do short-trade using the 2 hour charts.... I don't post that data here.... We are now at 30 days for this run on my daily chart..... I trade the daily.

Good Luck on your positions Brother!
 

Attachments

  • aa.jpg
    aa.jpg
    77.1 KB · Views: 48
SentimenTrader
@sentimentrader

Dec 14
This is the fastest (almost) doubling in the small-cap Russell 2000 in its history, beating its prior (almost) doubling from the '82 bottom by 10 days.

In the 3 months after the other times the Russell (almost) doubled, its average risk was -7.8% versus reward of only +1.2%.
 

Attachments

  • aa.png
    aa.png
    52.6 KB · Views: 43
VXF: A huge move since the March lows...... A very nice run! I don't normally trade the Russell 2000, but I do trade VXF at Vanguard.


Bottom Line: The trend remains up, but the risk/reward level is not very good..... That doesn't mean we cant keep moving higher, but one should have reduced some on the way up....
 

Attachments

  • aa.jpg
    aa.jpg
    65.3 KB · Views: 44
SPY and VXF monthly: The moves above the upper BB on the monthly chart will not continue much longer based on the data I use.....
 

Attachments

  • aa.jpg
    aa.jpg
    93.4 KB · Views: 44
I am curious is SPY above the Bollinger band on the bi-annual, 5 year, 10 year, and 15 year basis i mean tagging any of these 5 together can concoct a bear signal.....I guess for some. Spy is not above the Bollinger band neither on the daily or weekly basis this must be some algorithms you have written.
 
I am curious is SPY above the Bollinger band on the bi-annual, 5 year, 10 year, and 15 year basis i mean tagging any of these 5 together can concoct a bear signal.....I guess for some. Spy is not above the Bollinger band neither on the daily or weekly basis this must be some algorithms you have written.

Money has been flowing out of the SPY (Big caps) and into value/small caps, rotation. This caused a huge move up, and a rare extreme above the upper BB for IWM and VXF on the monthly charts. Rare extremes usually revert back to the mean going forward. Day 31 for this run up on the daily chart, and a buy signal for me using VXF. VXF is like the S Fund and I trade it at Vanguard. I trade the daily data because I have unlimited moves.

https://www.etf.com/etfanalytics/etf-fund-flows-tool
 

Attachments

  • aa.jpg
    aa.jpg
    52.9 KB · Views: 43
Back
Top