robo
TSP Legend
- Reaction score
- 471
The Forum works well on MOBILE devices without an app: Just go to: https://forum.tsptalk.com
Please read our AutoTracker policy on the
IFT deadline and remaining active. Thanks!
$ - Premium Service Content (Info) | AutoTracker Monthly Winners | Is Gmail et al, Blocking Our emails?
Find us on: Facebook & X | Posting Copyrighted Material
Join the TSP Talk AutoTracker: How to Get Started | Login | Main AutoTracker Page
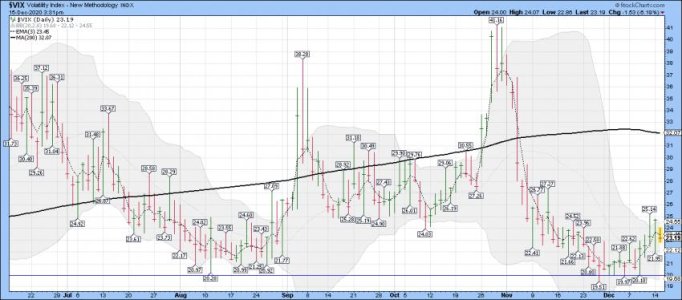
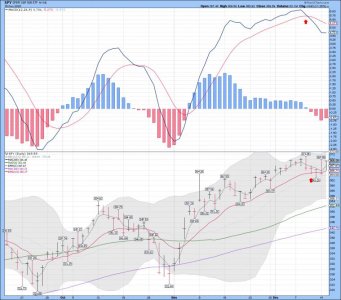
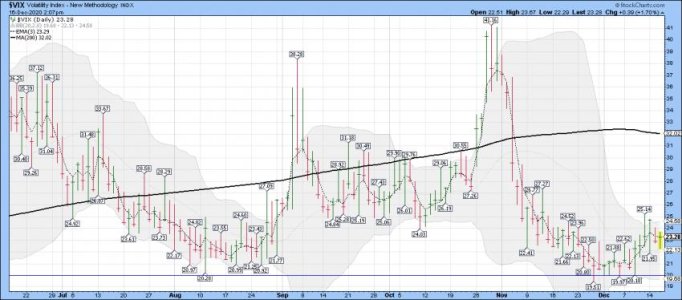
$VIX: Daily....
HMMMM....... What is this telling us?
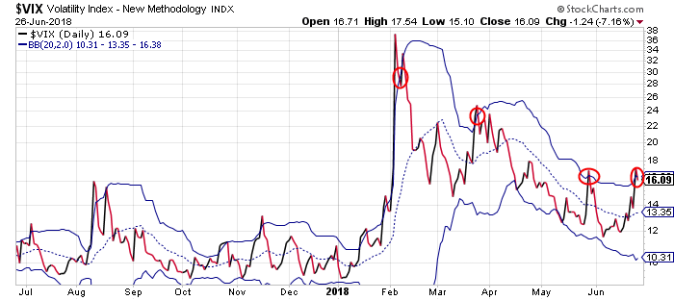
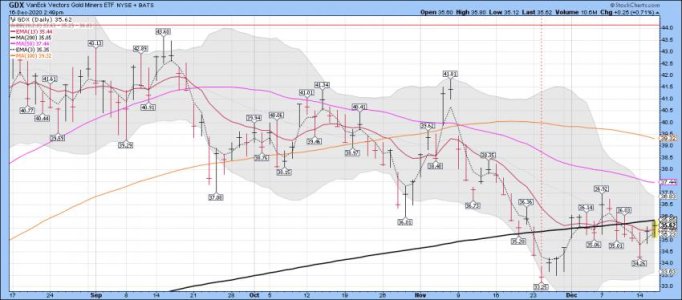
what percentage of time does any random stock stay within the Bollinger bands,
One of the great joys of having invented an analytical technique such as Bollinger Bands is seeing what other people do with it. The rules below covering the use of Bollinger Bands were assembled in response to questions often asked by users and our experience over 30 years of using the bands. While there are many ways to use Bollinger Bands, these rules should serve as a good beginning point.