Bullitt
Market Veteran
- Reaction score
- 75
Ran into two people from work who I have not seen in years a few days ago. The one was checking his TSP and the other noticed. Next thing you know, it turned into another one of those "how much did you make in 2020" discussions. "Bro, I'm up XX% this year, it's unbelievable. I check it every day"
The one said he got out in February, but never did say whether he got in or not. (I think he was telling the truth but has missed out on the massive ramp up since March.) The other was gloating about his gainz thru some trading service I had never heard of. The one who got out said he had heard of another guy who uses it and made $XXX,XXX.00 this year.
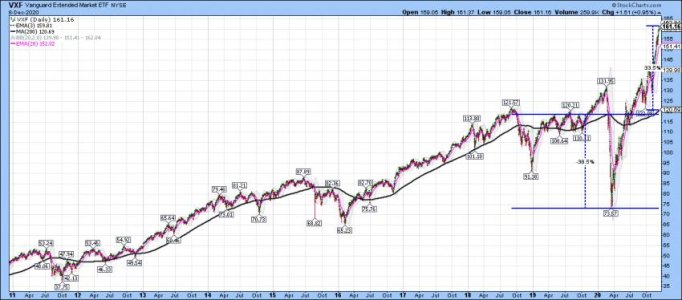
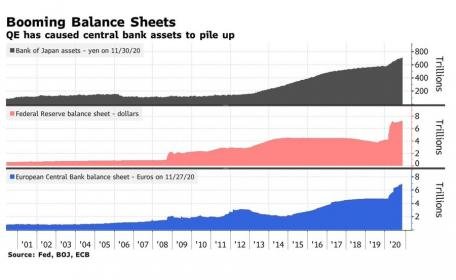
1. FOMO is happening in markets.
2. Don't compare what you have to others.
3. Make sure your foxhole is deep.

