Bear Cave 2 (Bull Allowed)

retread,

TSP is for MT trading only. I always try and point that out. In my opinion you should first do the matching in your TSP account, second is Roth IRA's for you and your wife at Vanguard in a trading account, third max out the rest of your TSP/401k for those that can, and last a straight up trading account at Vanguard. Well, that is how I played it and I moved my TSP funds to Vanguard once I could. For your TSP account you should be using a weekly chart Brother. I like TSP all except the two moves a month.

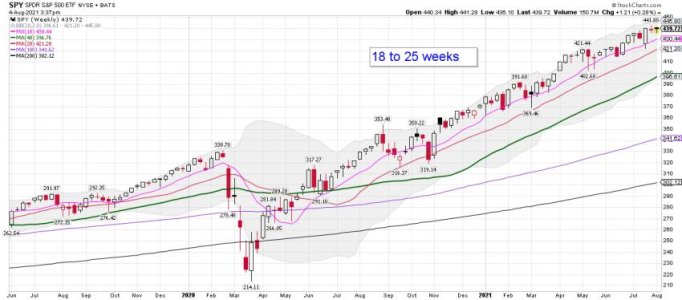
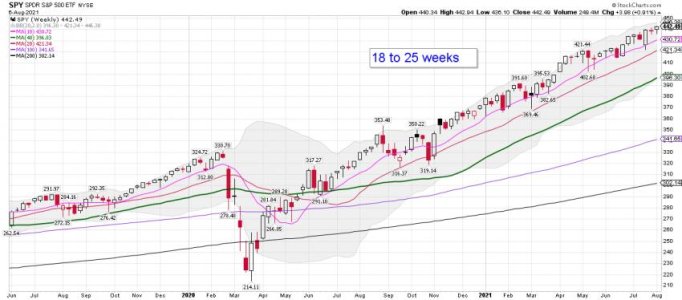
My posts about ST trading are NOT about a TSP account. However, my posts related to weekly and monthly charts are. The SPY weekly chart below. if you use the 20 wma for making moves you would have been long for most of this trend. Even after a short-term tag of the 20 wma you would have went right back to a buy signal. If you don't understand let me know and I will explain it better. I'm not including risk management data in the signals because that is used for how large a position size should be after a new buy signal. If you use the 40 wma for buy and sell signals, which I don't, you would still be long the C Fund. Back test it on my chart below. Tagging of the 200 wma is always a time of extremes and one should start scaling in small even if we move lower. Once we see the bottom forming adding tags of the 40 wma is also a good time to add. Again, we are talking about MT trading on the weekly chart. The daily is different.

Take Care!

Bottom Line: In my opinion you should also get a Roth IRA at Vanguard if you can. See the eggs and a basket picture below.
 

Attachments

  • a.jpg
    a.jpg
    53.1 KB · Views: 92
  • a.jpg
    a.jpg
    84.9 KB · Views: 90
Last edited:
We shall see how this plays out!


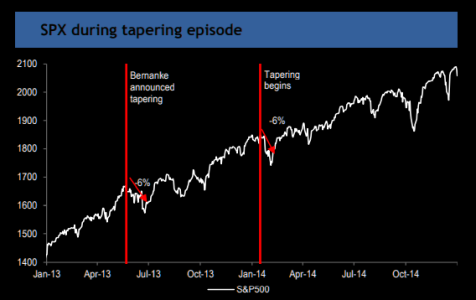
Second Chart: Tapering - Maybe, but I doubt anytime soon...... LOL...... We shall see.....


Let's revisit those old Tapering charts...
Last time around, pre-tapering phase led to higher yields, DM equities did well post the initial selloff, and market leadership was pro-Cyclical....
https://themarketear.com/
 

Attachments

  • a.jpg
    a.jpg
    37.5 KB · Views: 85
  • a.png
    a.png
    33.1 KB · Views: 87
DeMark Indicators are worth tracking in my opinion: I use it as a Risk Management tool when I can find his data free.

8-3-21 Mad Money with Jim Cramer and the DeMark Indicators


https://www.youtube.com/watch?v=Cfj5DkvlvQE


Bottom Line: Lots of indicators continue to provide warnings that you should currently be nimble and trading small. I don't try and pick tops or bottoms, but the warnings do keep adding up. With that said, the trend remains up if you are trading the SPY.

SevenSentinels
@SevenSentinels

8:30 PM, August 4, 2021

List of Critical Warnings Expands

https://twitter.com/SevenSentinels?ref_src=twsrc^google|twcamp^serp|twgr^author
 

Attachments

  • a.jpg
    a.jpg
    56.8 KB · Views: 82
Last edited:
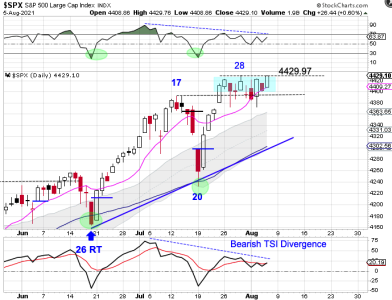
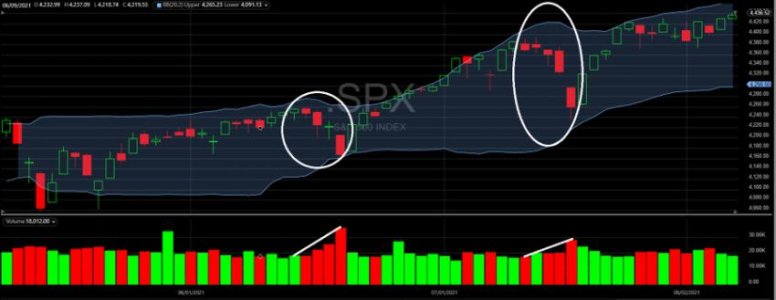
Daily cycle: I use cycles as a warning indicator as part pf my Risk Management tools for determining position size.

It’s Getting Late


It’s Getting Late
by likesmoneystudies

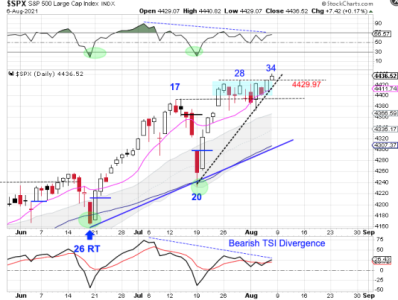
Stocks broke out above the day 17 high on day 24. They have been consolidating above the day 17 high since then.


Stocks broke bearishly out of consolidation on Monday but formed a bullish reversal on Tuesday to close below back in the consolidation zone. Stocks delivered bullish follow through on Thursday. Thursday was day 33 for the daily equity cycle, placing stocks in their timing band for a daily cycle low. Stocks are currently in a daily uptrend. A break above the day 28 high of 4429.97 will indicate that stocks will remain in their daily uptrend. At this point of the daily cycle -- even if stocks break higher, it will be given right back as stocks seek out their daily cycle low. However, there is the potential for stocks to begin a melt-up phase. Therefore stops could be raised to 4429.97 with a close above the day 28 high.

https://likesmoneycycletrading.wordpress.com/2021/08/05/its-getting-late-6/


SevenSentinels
@SevenSentinels
1h
August 5, 2021, 7:45 PM

Waiting For NFP
https://twitter.com/SevenSentinels?ref_src=twsrc^google|twcamp^serp|twgr^author


I sure agree..... I just don't know what will happen...... Melt up or melt down!

We will shall see how it plays out tomorrow.
 

Attachments

  • a.png
    a.png
    47.9 KB · Views: 71
  • a.jpg
    a.jpg
    59.1 KB · Views: 70
Last edited:
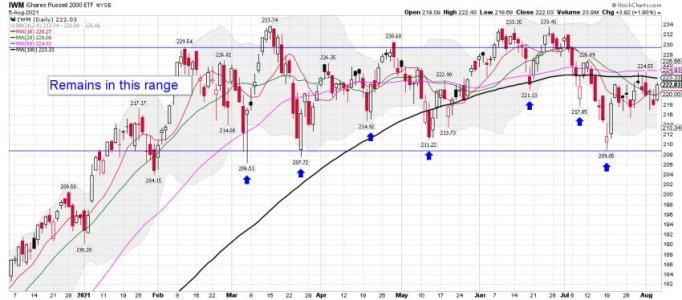
IWM daily: A nice move up today, but IWM remains below its 50 and 100 dma and stuck in a trading range. A warning signal? "Maybe" tomorrow will shed some light. I said MAYBE.
 

Attachments

  • a.jpg
    a.jpg
    61.4 KB · Views: 66
Last edited:
NFP - Not much of a reaction so far......

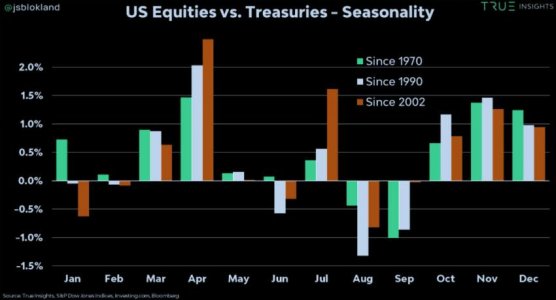
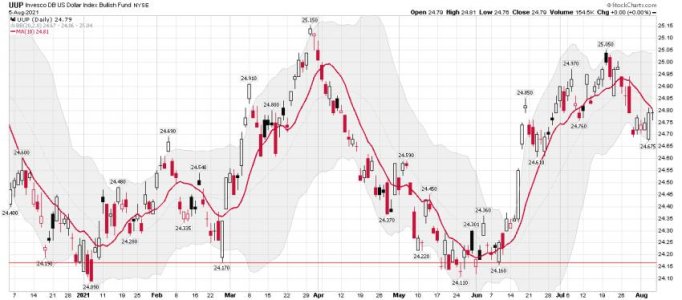
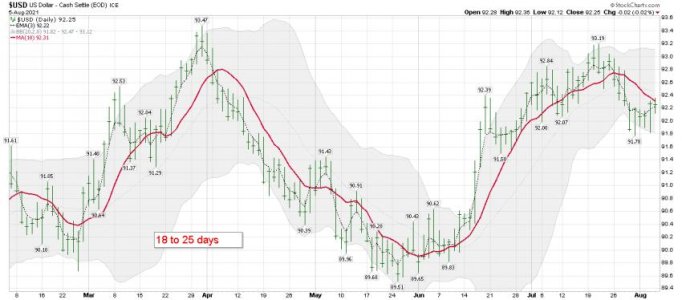
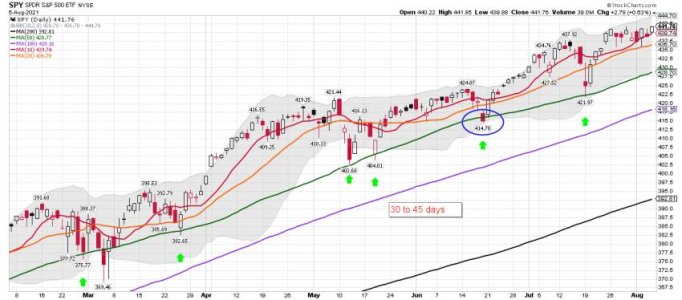
The dollar be on the move, and trying to get back above the 10 dma. Keep in mind "Easy Money Monday" is up next. You buy on Thursday's and sell on Monday's. Well, that has been the pattern for ST trading. STBD if that continues the rest of August and September. One would expect an up day today based on the patterns the last year.

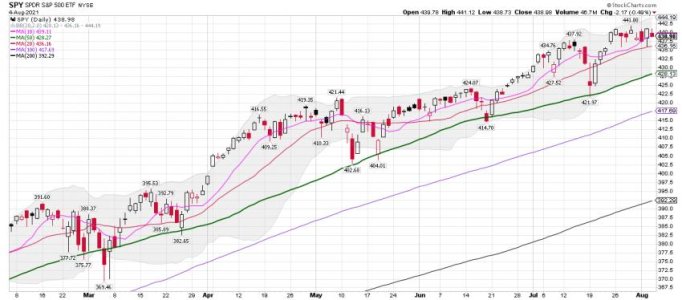
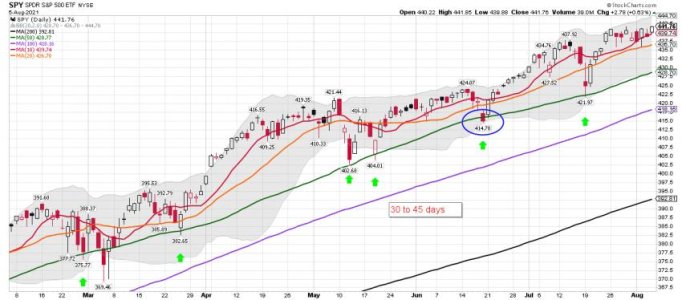
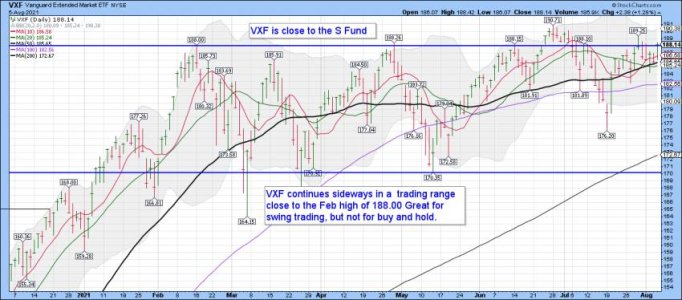
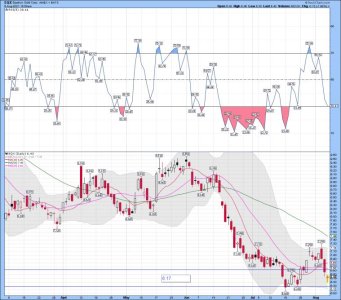
Bottom Line: If you are trading the SPY the trend remains up. Small caps have been much tougher, but the VXF index is currently trending above the 10 dma too. Waiting to see how we close today.

VXF, UUP, USD, SPY daily charts: ( VXF is close to the S Fund and I trade it at Vanguard )
 

Attachments

  • a.jpg
    a.jpg
    74.4 KB · Views: 62
  • a.jpg
    a.jpg
    55.8 KB · Views: 60
  • a.jpg
    a.jpg
    49.9 KB · Views: 61
  • a.jpg
    a.jpg
    59.1 KB · Views: 60
Last edited:
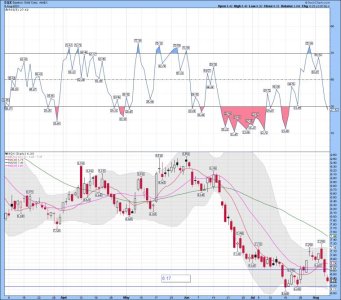
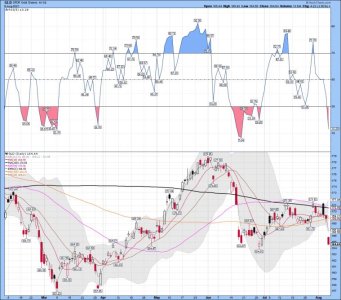
EQX daily: Are the miners trying to bottom? We shall see.....
 

Attachments

  • a.jpg
    a.jpg
    84 KB · Views: 60
SPY weekly: What's not to like on a MT weekly chart. Just BTD..... Very few tags of the 20 wma for those that like to use the 20 wma for MT trading. I use the daily, but have unlimited moves anytime during the day.

Bottom Line: The trend remains up!
 

Attachments

  • a.jpg
    a.jpg
    52.9 KB · Views: 53
Last edited:
EQX daily: I bought a tranch of EQX back today. I sold my shares after the first upper BB tag. This is a trade only! I trade GDX/GDXJ/NUGT/JNUG and DUST sometimes. At Vanguard I trade only GDX, GDXJ, and I'm currently trading small tranches of EQX.
 

Attachments

  • a.jpg
    a.jpg
    83.9 KB · Views: 61
Last edited:
I need to start monitoring that again. I was waiting because I think most stocks will sell off during the next 10% pullback. Well, that is a guess based on the data I use. I think we have a big scare coming in the next 60 days, but the SPY continues to move higher.

I’m going to look things over this weekend, but the Easy Money Monday pattern is up next. Tracking a few guys that are Big Time Short using Triple leverage. Lol..... I currently have a few small short positions that are down..... I have stops in place, but they haven’t been tagged yet.

We shall see how next week plays out as we get deeper into this daily cycle.

Have a nice weekend and take care!
 
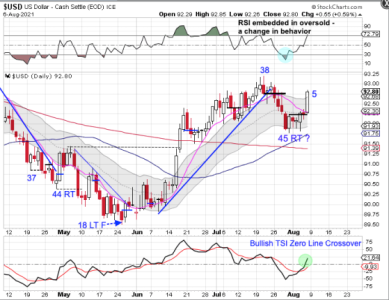
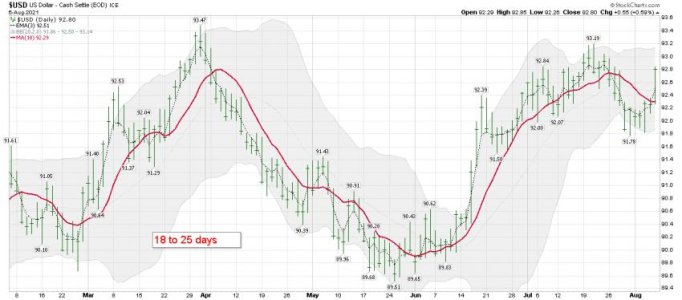
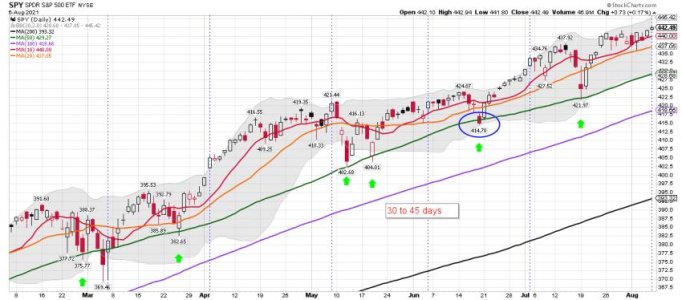
USD and SPX daily cycle: It's the next move for the dollar that I think is the most important.....


The 8/07/21 Weekend Report Preview
by likesmoneystudies
The Dollar


A bullish reversal formed on day 45 to place the dollar late in its timing band for a daily cycle low.

Stocks:

Stocks have been consolidating above the day 17 high until Friday.
Stocks broke bullish out of consolidation on Friday. Friday was day 34, placing stocks in their timing band for a daily cycle decline. At this point, any breakout will likely be given right back as stocks seek out their daily cycle low.

However, there is the potential for stocks to begin a melt-up phase. Therefore stops could be raised to 4429.97. Stocks are currently in a daily uptrend. They will remain in their daily uptrend unless they close below the lower daily cycle band.

https://likesmoneycycletrading.wordpress.com/2021/08/07/the-8-07-21-weekend-report-preview/
 

Attachments

  • a.png
    a.png
    97 KB · Views: 50
  • a.png
    a.png
    120 KB · Views: 53
  • a.jpg
    a.jpg
    50 KB · Views: 48
  • a.jpg
    a.jpg
    62.4 KB · Views: 49
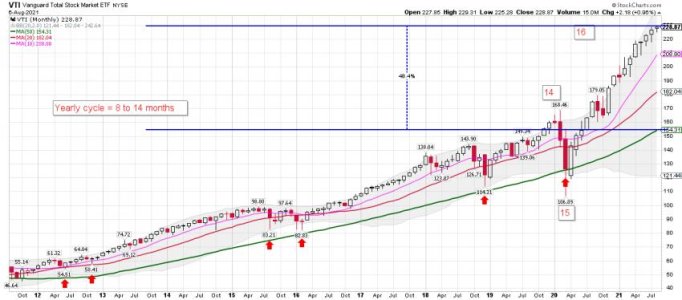
VTI monthly: VTI is the total market at Vanguard..... Buy/Hold and just BTD have done very well since the 2020 low.


Rydex bulls have always heavily outnumbered bears at market highs, but the bulls became extremely jazzed about stocks on January 31, 2018, when the ratio lurched to a then-record 27.3, meaning that Rydex traders had 27.3 times as much money invested in bullish funds as bearish funds.

That week, the S&P [500 Index] and NDX [similar to QQQ] both started a plunge of 12% in a span of just ten days.
Fast forward to February 19, 2020, as the S&P 500 hit a new intraday high, the Rydex ratio pushed to 29.7, also a new record at the time.
The S&P then crashed 35% in 23 days.

Yesterday [August 5, 2021], the ratio hit a new record of 42.8, so Rydex investors are betting 42.8 times as much money on a continued rise in stocks as they are on a decline.
--Steven Hochberg and Peter Kendall, "Elliott Wave Financial Forecast", ElliottWave.com, August 6, 2021.
 

Attachments

  • a.jpg
    a.jpg
    55.1 KB · Views: 49
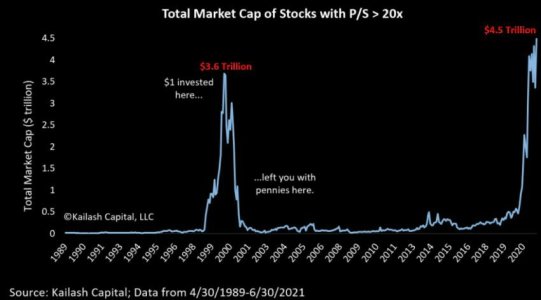
Not that investors really care!

The number of U.S. stocks with market capitalizations surpassing 20 times sales is usually tiny but had skyrocketed in 1999-2000 and again in 2021.


Absurdly-overpriced U.S. stocks are usually rare except for the euphoric twin peaks of 1999-2000 and today:
 

Attachments

  • a.jpg
    a.jpg
    33.4 KB · Views: 53
Divergences don't matter until they matter.


Imagine jumping off a 100-story skyscraper. When you're down to the tenth floor you tell yourself, "I'm doing fine so far with only 10% of the trip remaining. I'll be okay." That's pretty much what investors are doing when they ignore all-time record insider selling, greater net inflows into equity funds since November 2020 than during the previous 20 years combined, exactly the same divergences for small-cap shares, gold mining, energy, and emerging-market securities that we had experienced in 2007 and roughly in the same order, and in recent weeks even high-yield U.S. corporate "junk" bond yields climbing moderately from all-time record low levels which have been below the inflation rate for the first time in U.S. history. Exactly when the reckoning happens and how, and the extent of the ultimate depths, will of course remain unknowable in advance. Eventually all of today's extremes will be followed by nearly opposite extremes and probably within three years or less.
https://truecontrarian-sjk.blogspot.com/
 
OPEX is coming our way again: Still a couple of weeks to go, but next week we might start seeing some action.

https://www.marketwatch.com/optionscenter/calendar
thomas

@VolumeDynamics

1h
Everybody ALL BULLED UP for next Friday's OPEX... might want to have a look at what happened in June and July Opex

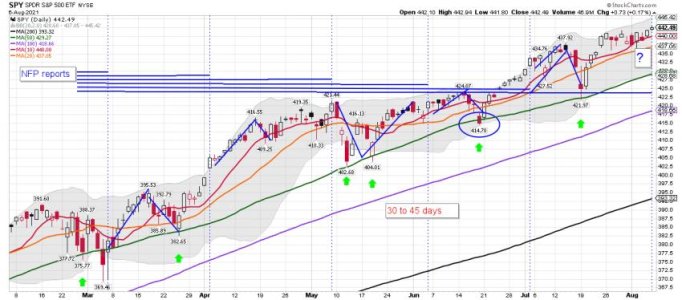
SPY NFP tracking: Blue lines...... We shall see how next week plays out.....

Bottom Line: The trend remains up for the SPY.
 

Attachments

  • a.jpg
    a.jpg
    40.6 KB · Views: 58
  • a.jpg
    a.jpg
    66.7 KB · Views: 57
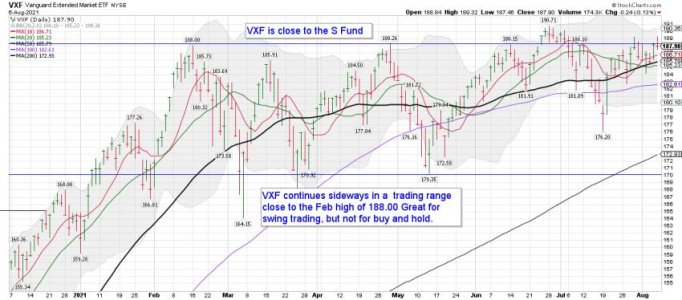
VXF daily = The S Fund: Still in a sideways trading range..... Not what you what to see in a Bull Market. It only matters if you are trading only small caps. Best to always have a mix.
 

Attachments

  • a.jpg
    a.jpg
    67.3 KB · Views: 59
Handling Stock Market Hardballs

As a market timer, the one thing we must always remember is that the markets can, and most definitely will, throw every possible hardball, curve ball, fast ball, knuckle ball, etc. at us.
Market Timing is Unique

Market timers face psychological battles that very few people ever face in their entire lives. There are so many differences between the emotions experienced in trading the financial markets, and what we experience in our lives, that it can easily interfere with our ability to trade.

If we can identify those emotions we can take steps to protect ourselves from them, stop them from influencing us, and become winning (profitable) market timers and traders.

For example, in the workplace, working hard and expecting to be justly rewarded for it are part of the American dream. Who would argue with the logic?

But in the stock market, work as hard as you can and the markets will still reverse on you and give you losses. Make the perfect trade and it can still go bad.

This is because timing the markets is not about our work ethic. It is not about genius or luck. It is about numbers and probability.

Numbers and Probability

Toss a coin 50 times and you can expect 25 times it will land heads up, and 25 times it will land tails up. But there is no rule that says the first 7 tosses will not all come up tails.

Once we realize that over time the numbers "always" add up in our favor, we can more easily endure the short term swings. The market "hardballs."

Being prepared for all that the market can throw at us, helps us to stick with our trading strategy.

Once you face the fact that market timing isn't easy money, or that you won't become rich overnight, you will be able to prepare yourselves mentally for the long haul.

If you expect that at times there will be losing trades, you won't be disappointed when they happen. You will have your eyes set on the big picture, which puts the odds in your favor over time.
https://www.fibtimer.com/subscribers/fibtimer_commentary.asp
 
Back
Top