-
The Forum works well on MOBILE devices without an app: Just go to: https://forum.tsptalk.com
-
Please read our AutoTracker policy on the IFT deadline and remaining active. Thanks!
-
$ - Premium Service Content (Info) | AutoTracker Monthly Winners | Is Gmail et al, Blocking Our emails?
Find us on: Facebook & X | Posting Copyrighted Material
-
Join the TSP Talk AutoTracker: How to Get Started | Login | Main AutoTracker Page
You are using an out of date browser. It may not display this or other websites correctly.
You should upgrade or use an alternative browser.
You should upgrade or use an alternative browser.
Bear Cave 2 (Bull Allowed)
- Thread starter robo
- Start date
robo
TSP Legend
- Reaction score
- 471
Hussman's latest Market Comment:
The Folly of Ruling Out a Collapse
John P. Hussman, Ph.D.
President, Hussman Investment Trust
August 2021
Ruling out market losses
“They won’t let it go down,” speculators just replied in unison – a phrase that conveniently embeds the assumption that Fed policy holds the market up mechanistically, rather than purely by way of the yield-seeking carry-trade mentality of speculators.
Recall how quantitative easing operates:
The Fed buys U.S. Treasury or mortgage-backed bonds.
The Fed pays by creating base money (currency and bank reserves)
Someone in the economy has to hold that base money at every moment until it is retired.
A bank depositor decides to take “idle” cash out of the bank and “put it to work” in stocks.
That same base money goes right into the account of whoever sold the stock.
The base money isn’t “on the sidelines” because there are no sidelines. Somebody has to hold it.
It isn’t “looking for a home.” It’s already home.
It can’t “go into” the market without instantly coming back out. It can only change hands.
The cash is there because the Fed put it there. It will not go away unless the Fed retires it.
The main effect of Fed easing is simply to create a pile of zero-interest hot potatoes that someone in the economy has to hold at every moment in time. It may be useful to examine how that pile of zero interest money can encourage speculation, and also the conditions when Fed easing can ineffective or even useless in “supporting” the market.
https://www.hussmanfunds.com/comment/mc210808/
Attachments
robo
TSP Legend
- Reaction score
- 471
I have LOTS of cash in my Vanguard accounts so I'm starting to buy some miner shares again. I have "NO IDEA" how low the miners will go, but this will be a MT trade. I be catching the falling knife Brother.
thomas
@VolumeDynamics
Make sure to pack that parachute this week...
https://twitter.com/VolumeDynamics/status/1424745474158784522
thomas
@VolumeDynamics
Make sure to pack that parachute this week...
https://twitter.com/VolumeDynamics/status/1424745474158784522
Attachments
Last edited:
- Reaction score
- 2,450
Hussman's latest Market Comment:
"Historically, when trend uniformity has been positive, stocks have generally ignored overvaluation, no matter how extreme. When the market loses that uniformity, valuations often matter suddenly and with a vengeance. This is a lesson best learned before a crash than after one."
– John P. Hussman, Ph.D., October 3, 2000
robo
TSP Legend
- Reaction score
- 471
"Historically, when trend uniformity has been positive, stocks have generally ignored overvaluation, no matter how extreme. When the market loses that uniformity, valuations often matter suddenly and with a vengeance. This is a lesson best learned before a crash than after one."
– John P. Hussman, Ph.D., October 3, 2000
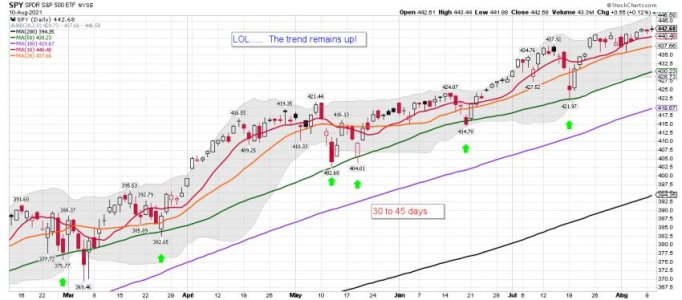
Many reasons I went to trend trading, but the most important one is - " I trade what is happening and NOT what I think will happen"
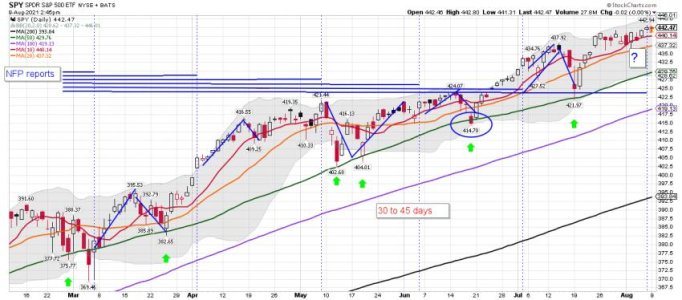
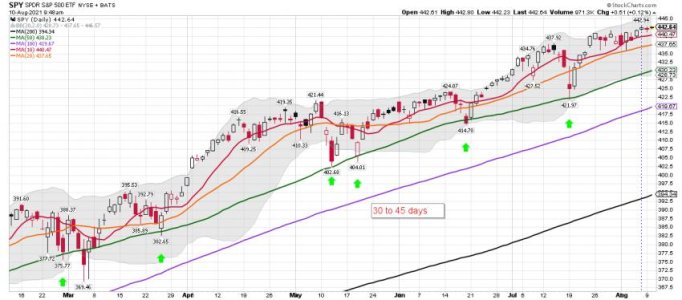
SPY daily chart with NFP data:
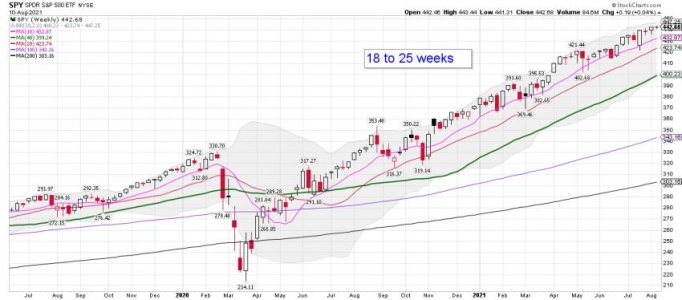
Bottom Line: Love it or hate it the Trend for the SPY remains up.
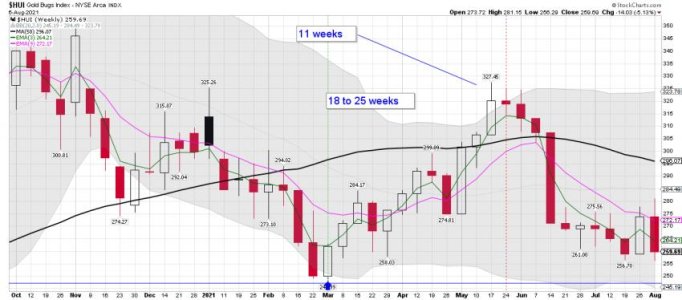
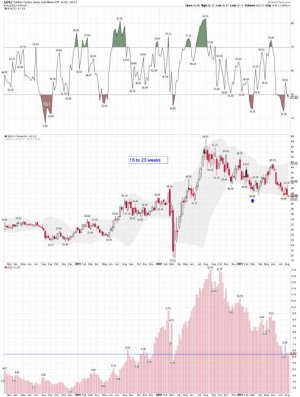
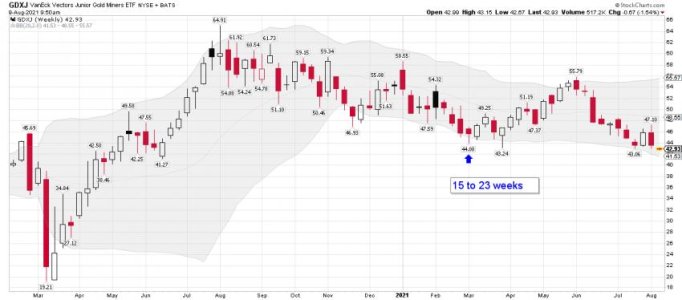
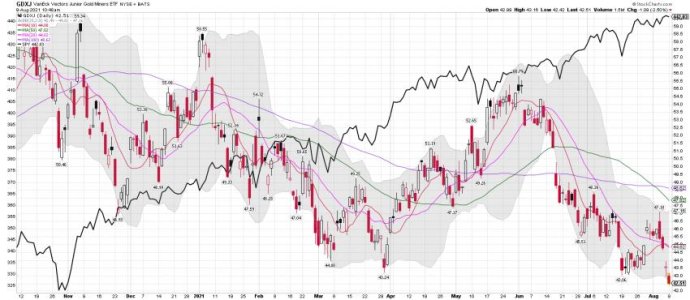
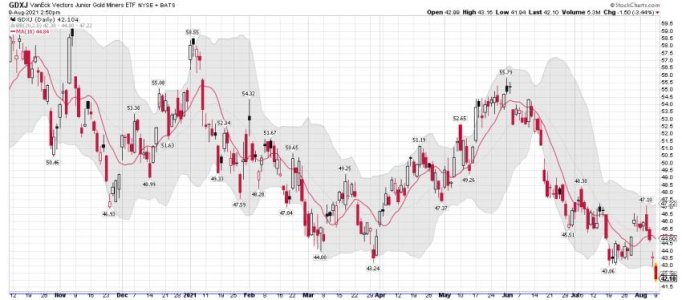
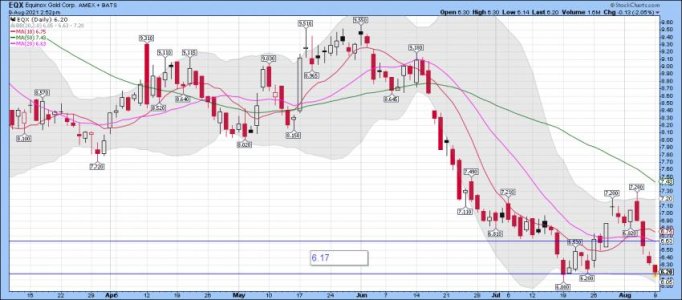
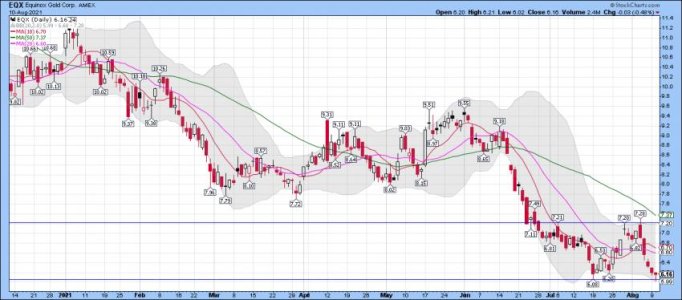
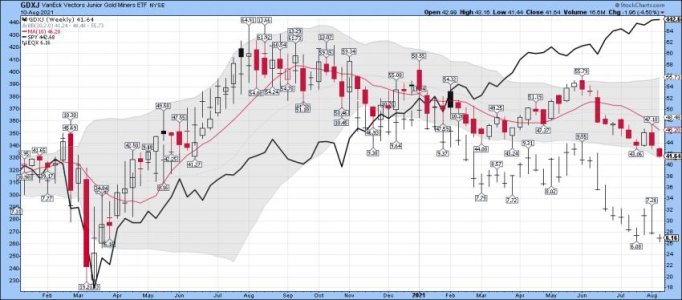
Update on the miners: I bought some GDXJ and EQX as I'm looking for an ICL. Again, I have NO IDEA how much lower the miners could go, but I like to trade lower BB tags - A win lose or draw trade for me. The last time I bought EQX under $6.20 it was a winner. We shall see how this trade plays out. A lower BB buy and a upper BB sell. I like to trade the BB's for some indexes, but not all. I like to see clear repeating pattern, before I place a win, lose or draw bet.
Attachments
robo
TSP Legend
- Reaction score
- 471
NO ONE EVER KNOW's FOR SURE: Once you understand this you will NOT bet the "FARM" on some GURU's call. I know of plenty of traders that lost lots of money talking calls from so called experts trading gold and the miners. LOL..... I was one of them for sure...... That will NEVER happen again!
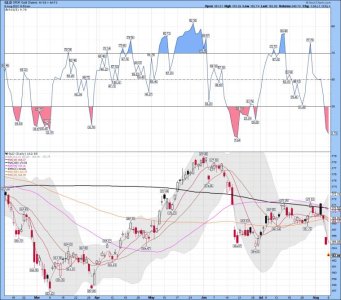
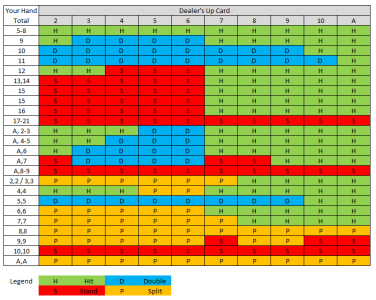
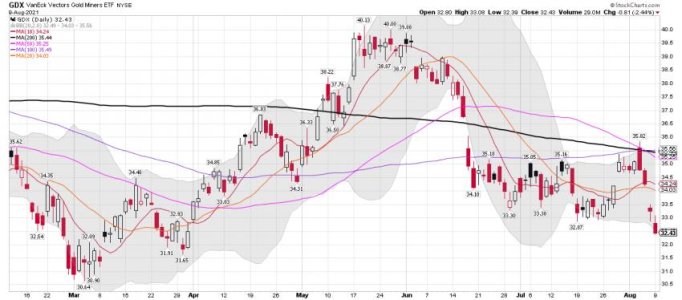
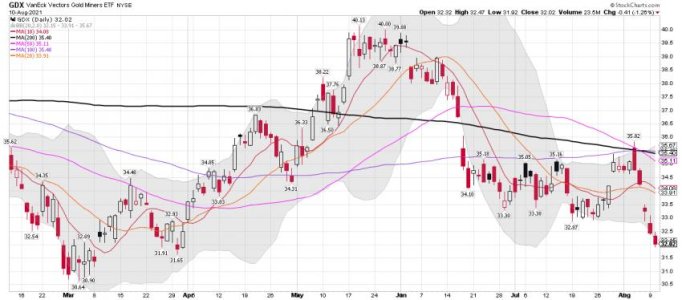
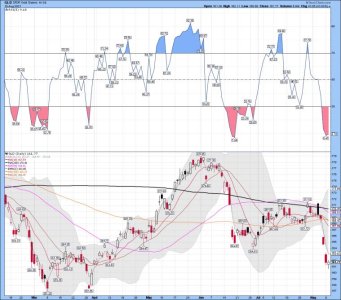
I can only talk about what I'm currently seeing, and everything else would be guessing: GDX tagged the lower BB, is oversold and we are getting "CLOSER" to a possible cycle low. What one should do is wait for the turn, but I like to trade these lower BB tags. So I keep it small, stay nimble, and use stops. I have NO buy signal for the miners. In fact, it's on a ugly sell signal until it's not. That doesn't mean I'm not ST trading using DUST or NUGT. So, currently trading the miners in a downtrend, is no more then gambling. However, I see above average odds for a trade or bet based on the data I use. So this trade is like playing blackjack, but you don't get the free drinks. Hit me! Yes, I love to play Blackjack.
GDX daily: The last chart is my daily trading data, and the trend remains down! Falling knife for now.......
Jeff's comments are worth a read. Can you remember a time you bet the farm on the miners based on someone's else's call?
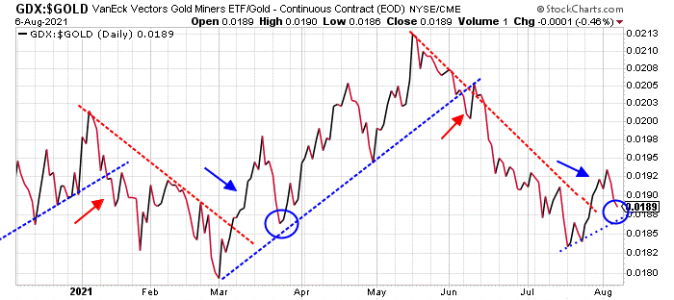
The “Moron” Buy Signal
There’s a thin line that separates genius from moron.
And, I tripped over that line a few times last week…
It started last Monday when I wrote about the Golden Buy Signal. The GDX/Gold ratio chart had triggered a buy signal. And, I told readers it was time to buy gold.
“You’re a genius,” one reader e-mailed me when the price of the shiny, yellow metal popped $30 higher on Wednesday morning.
https://www.jeffclarktrader.com/market-minute/the-moron-buy-signal/
Attachments
Last edited:
robo
TSP Legend
- Reaction score
- 471
Well, we shall see how deep the blood bath phase goes......
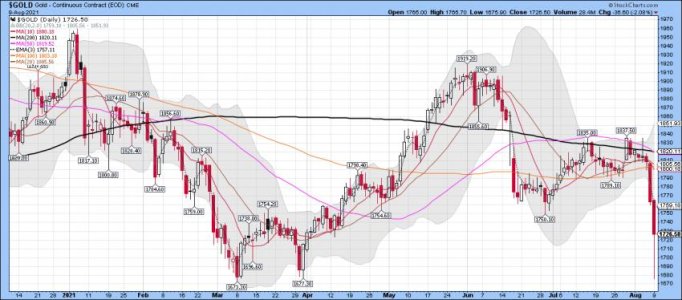
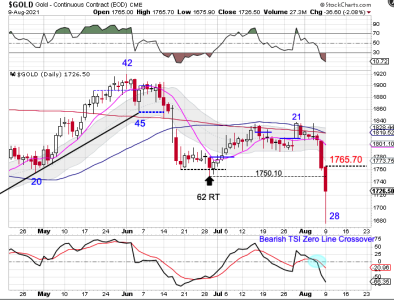
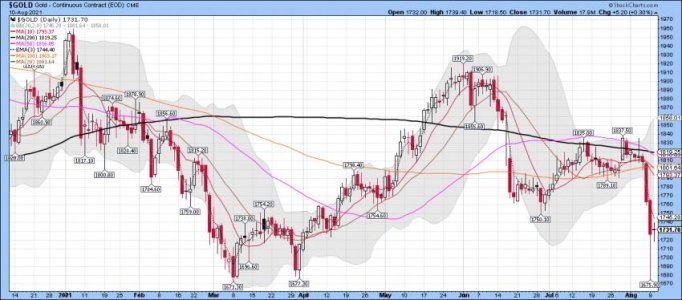
Gold daily: A nice bounce after testing the March lows. A wild couple of days for sure if you are trading gold and the miners. You can bet a ****-load of stops were hit.
Gold update: The bloodbath begins
https://blog.smartmoneytrackerpremium.com/
Gold daily: A nice bounce after testing the March lows. A wild couple of days for sure if you are trading gold and the miners. You can bet a ****-load of stops were hit.
Gold update: The bloodbath begins
https://blog.smartmoneytrackerpremium.com/
Attachments
Last edited:
robo
TSP Legend
- Reaction score
- 471
Gold daily: Another cycle dude
Gold Got Hammered
Gold dropped 90 points to break below the previous daily cycle low on Monday. Breaking below the previous daily cycle low forms a failed daily cycle which extends the intermediate cycle decline. This could kick off a 5 - 7 bloodbath day phase to print the ICL.
However, gold is in its timing band for both a daily and weekly cycle low. A swing low would signal a new daily cycle and quite possibly the ICl. A break above 1765.70 will form a daily swing low. For those with a higher risk tolerance can use a close above the previous DCL of 1750.10 as a buy signal.
https://likesmoneycycletrading.wordpress.com/2021/08/09/gold-got-hammered/
Attachments
robo
TSP Legend
- Reaction score
- 471
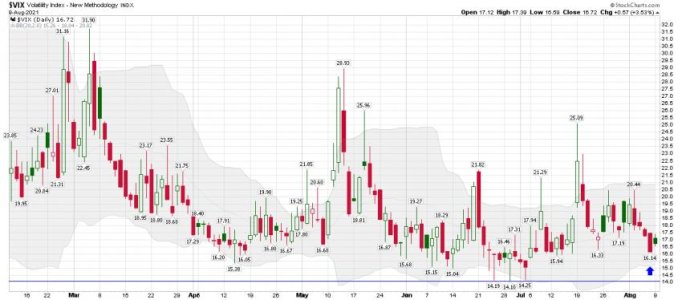
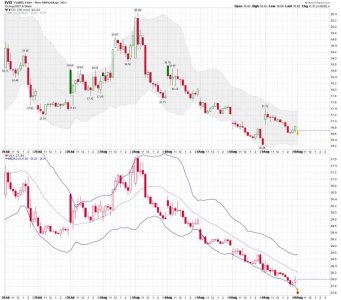
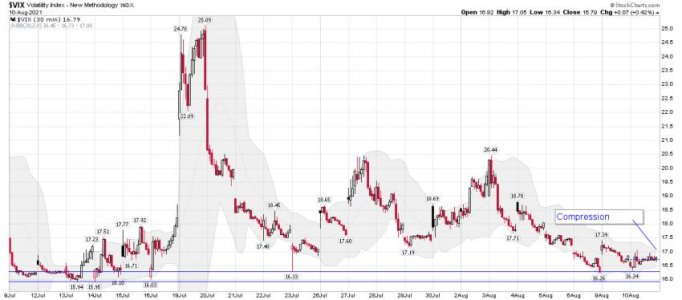
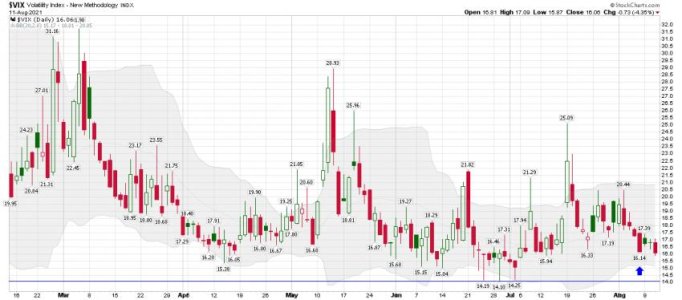
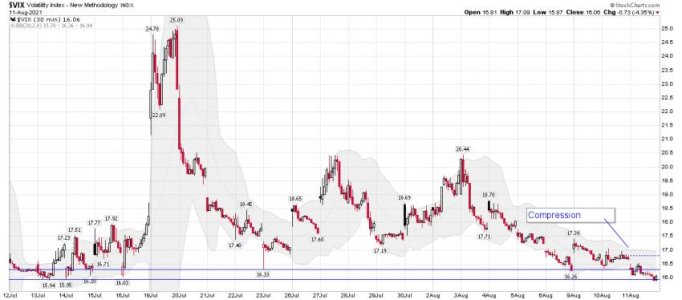
VIX 2 hour: A closer look and I be Watching.....
https://stockcharts.com/h-sc/ui?s=$VIX&p=30&yr=0&mn=0&dy=10&id=p39497731842&a=1006974222
https://stockcharts.com/h-sc/ui?s=$VIX&p=30&yr=0&mn=0&dy=10&id=p39497731842&a=1006974222
Attachments
robo
TSP Legend
- Reaction score
- 471
LOL.... Just BTD..... I'm still tracking some traders that are short using 3X..... One of these days they will be correct, but it will take a huge move just to get even.
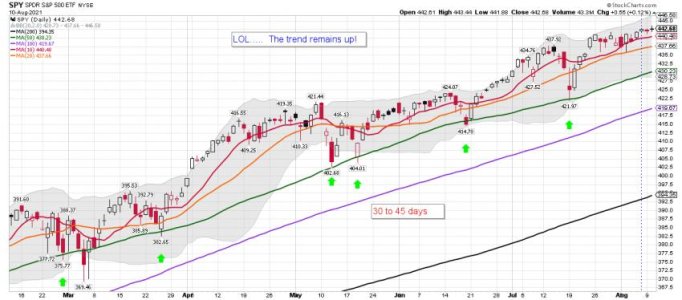
SPY daily chart - Bottom Line for the SPY: The trend remains up!
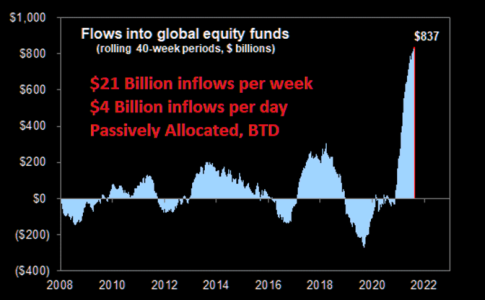
$4.2B worth of buying per day
There has been 187 US equity trading days from November 1st to today. This was the start of positive vaccine developments. Since November 2020, there have been +$837 Billion worth of global equity inflows in 40 weeks. This is +$21B worth of inflows every week or +$4.2B worth of buying per day.
https://themarketear.com/
Attachments
robo
TSP Legend
- Reaction score
- 471
Miners hammered pretty good today - and the CPI is tomorrow. Many were calling gold the most straightforward trade going into 2021.
I bought another small tranche of EQX @ $6.05..... The 2020 low was $4.63, and one never knows how much lower it could go. However, the position is small and I'm building a MT position. The total position once completed will be only around 10% of my MT trading account at Vanguard. Buying other miners too. I have a long ways to go to get to a 10% position since I just started. Looking for an ICL in the days ahead. This is still a trade or I wouldn't be scaling in. I don't invest in the miners. I only trade them.
GDKJ weekly: The last chart
Take Care!
Miners and gold daily: The trend remains down!
SPY daily: Another new ATH.
SevenSentinels
@SevenSentinels
59m
8:30 PM, August 10, 2021
SPX Sets ATH on Negative Overall Breadth
https://twitter.com/SevenSentinels?ref_src=twsrc^google|twcamp^serp|twgr^author
Attachments
Last edited:

