Bear Cave 2 (Bull Allowed)

I will continue to just trade the price action....

Where There’s Fire There’s Smoke
Back in early February of 2020, I noted that, even as the major stock market indexes had pushed to new highs, a number of Hindenburg Omens had been triggering on the NYSE and the Nasdaq pointing to a significant deterioration in breadth: “While an individual signal has very little value in forecasting a stock market crash… a cluster of signals can be valuable in that it signals a pattern of dispersion that is not compatible with a healthy uptrend.” In other words, where there’s fire (flames in the chart below) there’s smoke (a warning signal). The following six weeks of stock market action proved the value of this sort of signal yet again.
https://thefelderreport.com/2021/08/11/where-theres-fire-theres-smoke/
 
RE: Hindenburg; first time hearing this about the Nasdaq, thanks for posting. As far as I know, last one on the NYSE was in March.
 
ICL ??? We shall see! This is why I use cycles for Risk Management. If it is an ICL it's time complete my 10% position (BUT NOT BEFORE) it's confirmed! I will scale in with remaining tranches.

Good Trading.....

Cycle swing low chart:
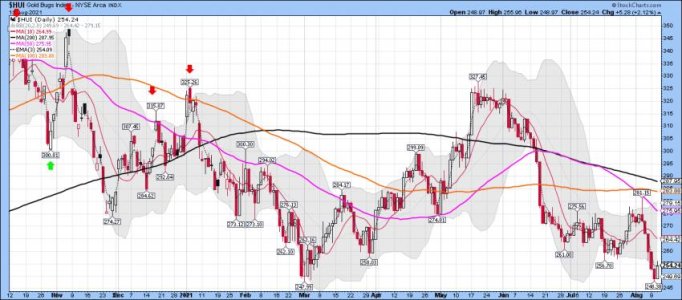
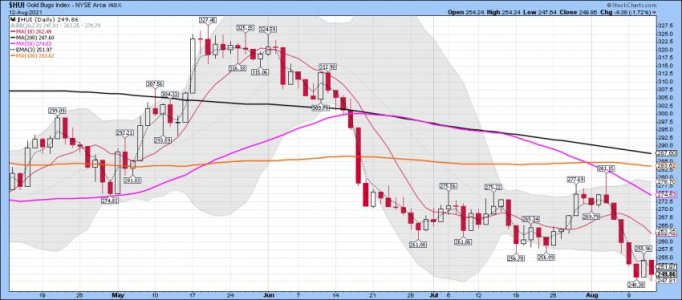
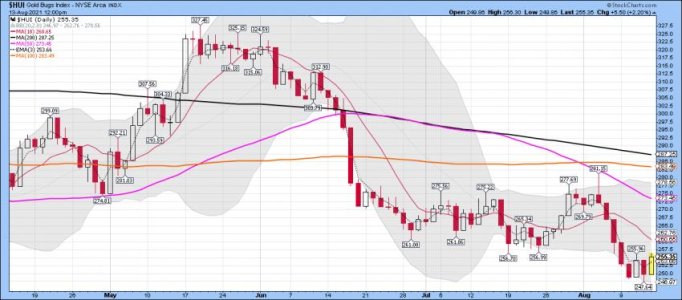
HUI daily:
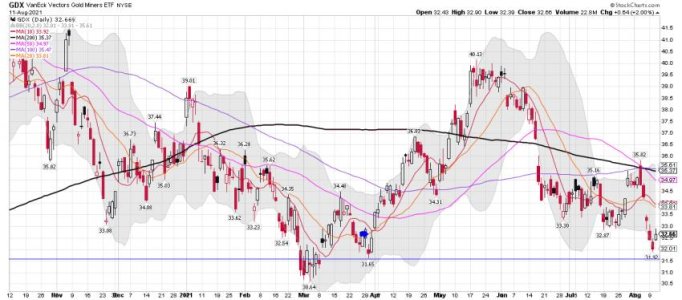
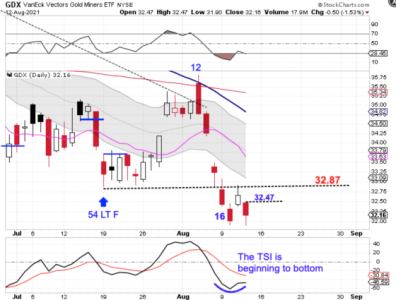
GDX daily:
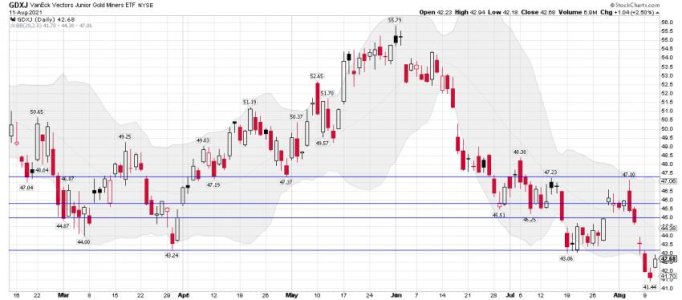
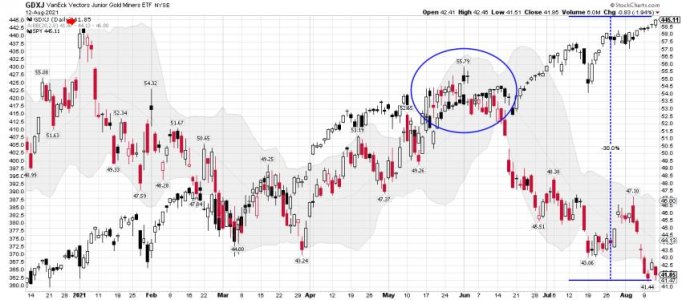
GDXJ daily: Long
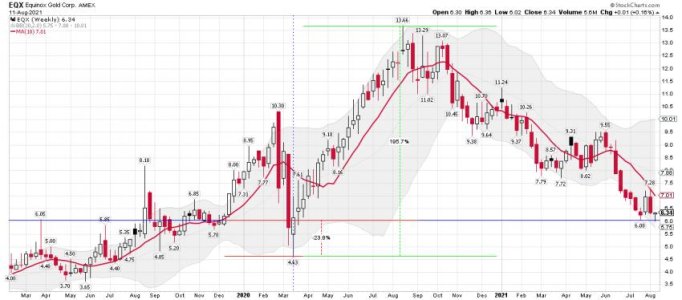
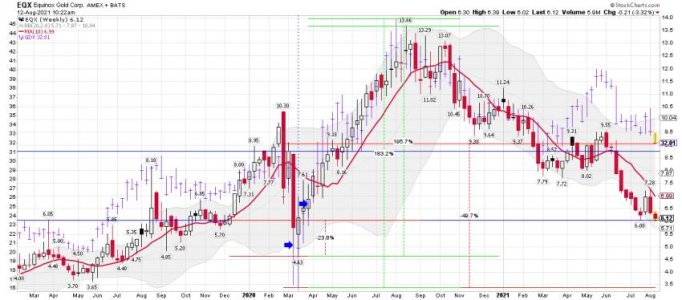
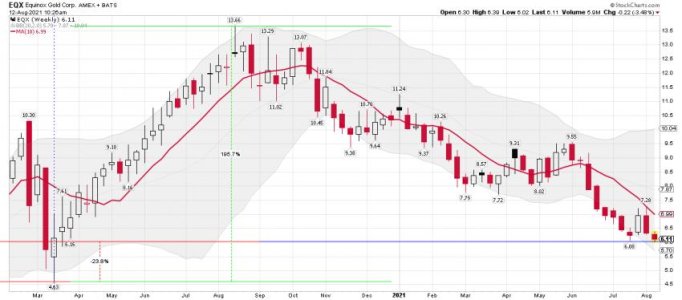
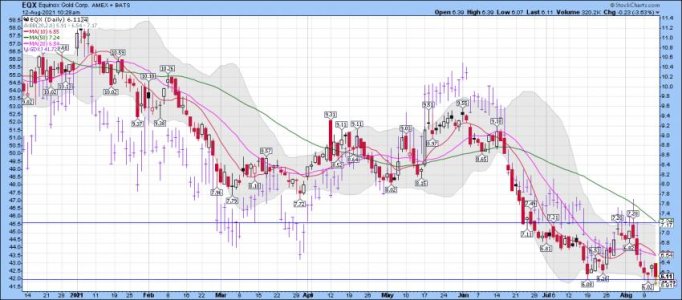
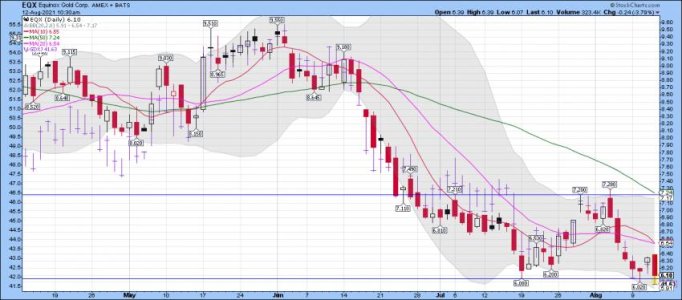
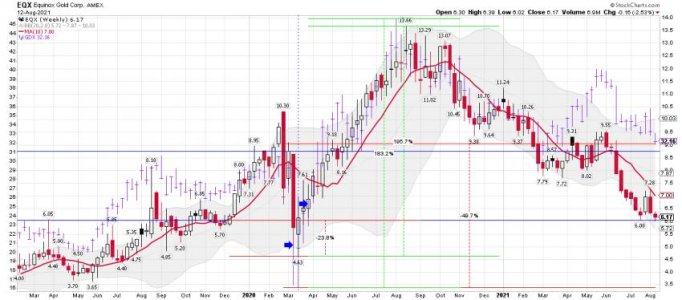
EQX daily: Long
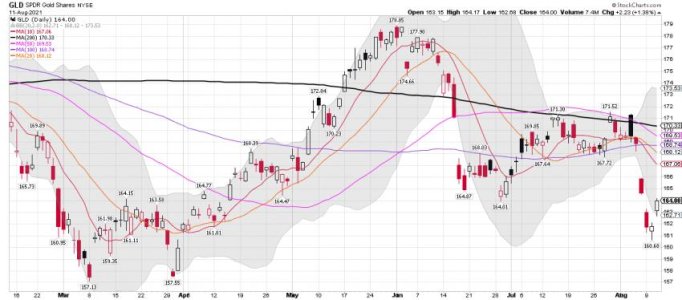
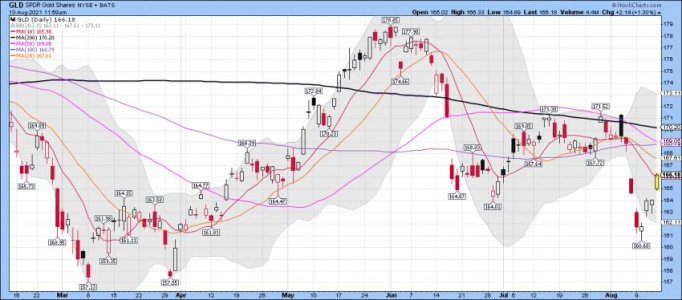
GLD daily:

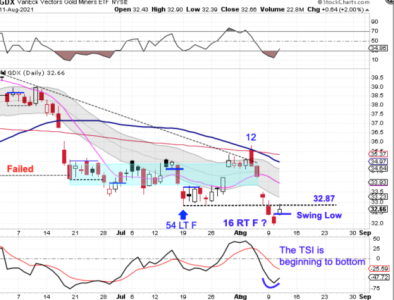
The Miners formed a swing low on Wednesday.
The Miners printed their lowest point on Tuesday, day 16 -- which is a bit early to expect a daily cycle low to form. However, Wednesday's swing low indicates that day 16 may be an early DCL. If the Miners can deliver bullish follow through and close above the previous daily cycle low of 32.87, increases the odds that day 16 was the DCL.
And if day 16 turns out to be the daily cycle low. It also has a chance to mark the intermediate cycle low.
https://likesmoneycycletrading.wordpress.com/2021/08/11/miner-swing-low-2/
 

Attachments

  • a.png
    a.png
    138.9 KB · Views: 63
  • a.jpg
    a.jpg
    66.5 KB · Views: 62
  • a.jpg
    a.jpg
    61 KB · Views: 61
  • a.jpg
    a.jpg
    53 KB · Views: 61
  • a.jpg
    a.jpg
    52 KB · Views: 62
  • a.jpg
    a.jpg
    54.3 KB · Views: 62
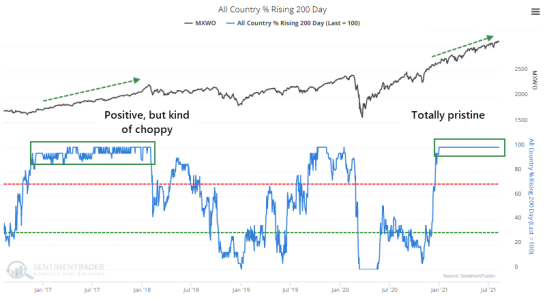
So just how good has this run been? Well, 2nd best in 35 years...... The move up continues!


This is the 2nd Best Streak of Global Trends in 35 Years
ver the past 50 years of data we have, this is now the 5th-longest streak of uninterrupted global uptrends and is creeping up on the longest in 35 years.

As we've seen with most momentum studies in recent months, there are few precedents.

The general pattern after the few times this occurred is shorter-term weakness but medium- to long-term strength. The MSCI World Index saw one double-digit pause following the 2009-10 recovery. The other three all saw consistent and impressive gains.

This has been a year like few others, and that has typically meant good things when viewed over a 6-12 month window.
https://www.sentimentrader.com/blog...l&utm_term=0_1c93760246-d96f896914-1271291994
 

Attachments

  • a.png
    a.png
    58.1 KB · Views: 54
If a gun is fired and NO ONE hears it is there sound?


Junk Bonds Just Fired a Warning Shot
Jeff Clark | Aug 12, 2021 | Market Minute | 2 min read
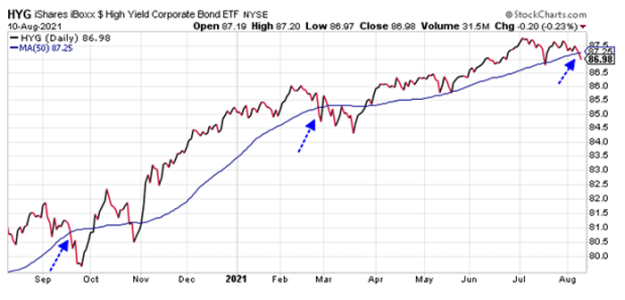
Over the past month, while the S&P 500 has been steadily grinding higher and recording a string of new all-time highs, the junk bond sector has been quietly falling.

This divergence is important because, as we’ve often pointed out, the action in high-yield bonds tends to lead the action in the stock market.

So, if junk bonds are breaking down, then the stock market is likely to follow.

And, this week, junk bonds just fired a warning shot…

Take a look at this chart of the iShares iBoxx High Yield Corporate Bond ETF (HYG)…

https://www.jeffclarktrader.com/market-minute/junk-bonds-just-fired-a-warning-shot/

My chart.....

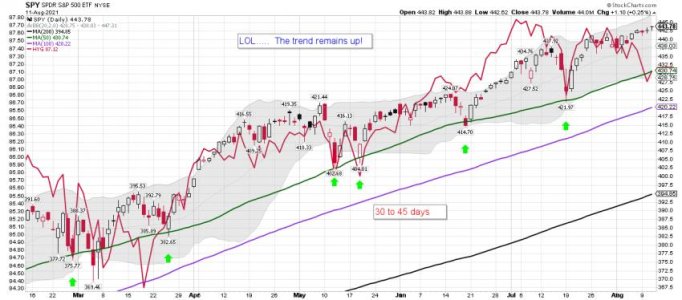
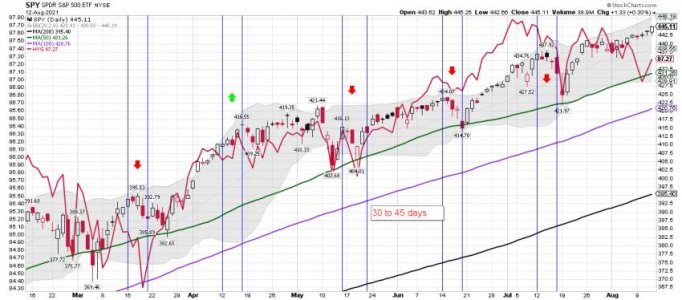
SPY/HYG daily: HYG is the thick red line on the SPY chart below. Is it a tell for next week's OPTX? We shall see!

Options Expiration Calendar 2021

https://www.marketwatch.com/optionscenter/calendar
 

Attachments

  • a.png
    a.png
    31.5 KB · Views: 59
  • a.jpg
    a.jpg
    62.2 KB · Views: 60

Attachments

  • a.jpg
    a.jpg
    61.3 KB · Views: 57
  • a.jpg
    a.jpg
    48.4 KB · Views: 57
  • a.jpg
    a.jpg
    67.5 KB · Views: 58
  • a.jpg
    a.jpg
    64.4 KB · Views: 58
Last edited:
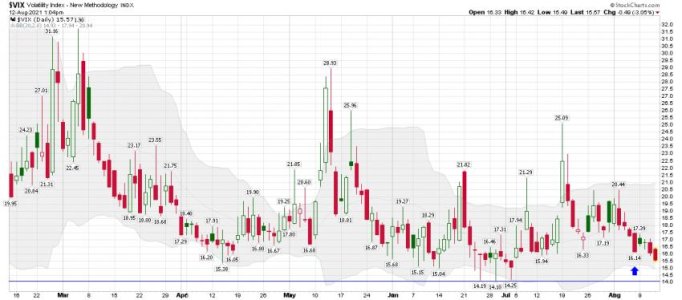
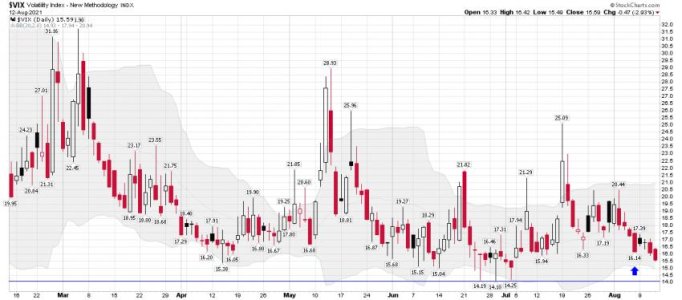
VIX daily: Getting closer to a lower BB tag.

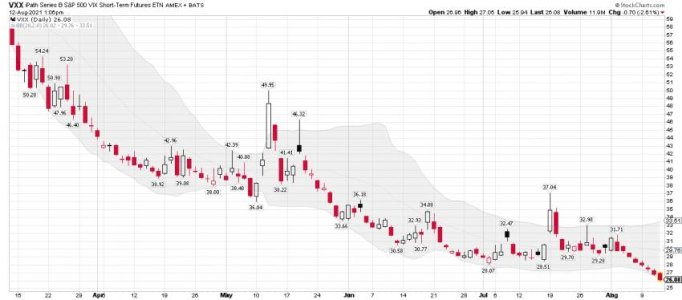
VXX daily: This is one you DO NOT want to position trade with. I follow someone that is..... AMAZING! Very few traders will have a position of VXX when it's really needed. Some use it as a hedge based on Risk Management data. Will, I do.....
 

Attachments

  • a.jpg
    a.jpg
    55.4 KB · Views: 52
  • a.jpg
    a.jpg
    47.7 KB · Views: 52
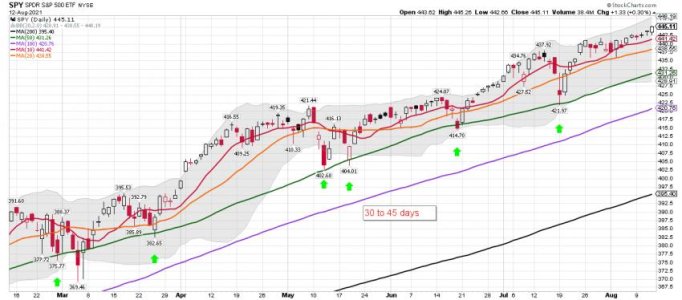
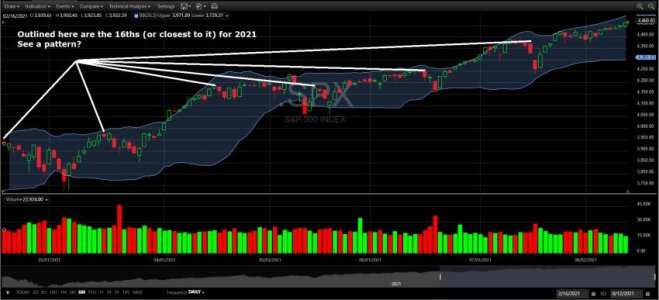
SPY daily: The pattern has been to buy on Thursday and sell on Monday..... I call it "Easy Money Monday". We also have Options Expiration next week....

https://www.marketwatch.com/optionscenter/calendar

So it's easy to see why the VIX was smashed down. We shall see how it plays out..... LOL.... A perfect setup for a pullback. Why spend money on protection.....

Bottom Line: The SPY trend remains up!
 

Attachments

  • a.jpg
    a.jpg
    58.3 KB · Views: 50
  • a.jpg
    a.jpg
    55.6 KB · Views: 49
GDXJ daily: How many guesses do read about the miners weekly? There are always lots of opinions. We shall see what happens to the divergence between the SPY and GDXJ in the weeks ahead.

EQX and GDXJ weekly/daily after the close:
 

Attachments

  • a.jpg
    a.jpg
    61.1 KB · Views: 53
  • a.jpg
    a.jpg
    65.2 KB · Views: 54
GDXJ daily: How many guesses do read about the miners weekly? There are always lots of opinions.

Bugs are always bullish. It has to be the most confirmation biased sector out there. Any little sign - an uptick in RSI, hourly candlestick reversal, or modified wave count is always interpreted as a sign that the eternal bottom is in and it's going up for infinity. After almost 15 years, I'm still waiting on those EW predictions of $5,000 gold to pan out.
 
Cycles daily: Back to the cycle drawing board..... I need to see a continued move above the 3 ema to start..... and then a move back above the 10 dma.....

HUI daily: No new trend confirmed yet!

The Miners printed a lower low on Thursday.

Thursday was day 18, placing the Miners in the early part of their timing band for a DCL. A swing low is required to mark the DCL. Printing a lower low on Thursday means that the earliest the Miners can form a swing low will be on Friday. A break above Thursday's low of 32.47 will form a swing low. As we discussed on Wednesday, the Miners need to close above the previous daily cycle low of 32.87 to increase the odds that DCL has formed.
https://likesmoneycycletrading.wordpress.com/2021/08/12/miners-print-lower-low/
 

Attachments

  • a.png
    a.png
    123 KB · Views: 52
  • a.jpg
    a.jpg
    61.5 KB · Views: 51
SPY daily: Options Expiration week data on my SPY chart below - 5 of the last 6 months during Options Expiration week they were down. (See my chart below) The week that was up, the following week was down. We shall see how the pattern does next week. This was a tool/pattern Sy Harding used in his use in his reports. I was a sub with him. So it's just something I still track. Options Expiration weeks are inside the blue vertical lines.

https://www.marketwatch.com/optionscenter/calendar

For those that didn't know him:

Sy Harding's Seasonal Timing Strategy (STS)

Sy Harding, applied the Moving Average Convergence Divergence indicator, or MACD, to the Dow after the average best time to leave the market, April 20, following the "sell in May and Go away" strategy. Likewise, around the best days on average to enter the market, October 16, Harding's STS looks for positive MACD to enter the market again.
Apr 30, 2015 - Sy L. Harding, 80, died on Tuesday, April 21, 2015 at the Florida Hospital in DeLand, FL, after a sudden illness.


For example. Sy waits for the MACD to turn positive after October 16, the average best day to enter the stock market based on the "Seasons in the Sun Strategy." Harding writes:
The idea is that if a rally is underway when the October 16 calendar date for seasonal entry arrives, as indicated by the MACD indicator, we will enter at that time. However, if the MACD indicator is on a sell signal when the October 16 calendar date arrives, indicating a market decline is underway, it would not make sense to enter before that decline ends, even though the best average calendar entry date has arrived. Instead, our Seasonal Timing Strategy simply waits to enter until MACD gives its next buy signal, indicating that the decline has ended.


In the Spring, Harding uses the same MACD indicator to look for the favorable exit point from the market any time after April 20, the average best day to exit the market based on the "Seasons in the Sun Strategy." We use the same method to better pinpoint the end of the market's favorable period in the spring. If MACD is on a sell signal when the calendar exit day of April 20 arrives, we exit at that point. However, if the technical indicator is on a buy signal, indicating the market is in a rally when April 20 arrives, it makes no sense to exit the market just because the calendar date has arrived. So our Seasonal Timing Strategy's exit rule is to simply remain in the market until MACD triggers its next sell signal indicating the rally has ended.


In a nutshell. STS looks for daily MACD to give signals on or after the average best days to enter and leave the market using the seasonal strategy.

The average best day to exit the market is April 20
The average best day to enter the market is October 16

IF MACD is negative on April 20, then you exit the market that day. If MACD is positive, then you wait for it to turn negative to exit the market.

Likewise, if MACD is positive on October 16, then you enter the market on that day. If MACD is negative, then you wait for it to turn positive to enter the market..
https://www.forbes.com/sites/sharding/?sh=524242c93285

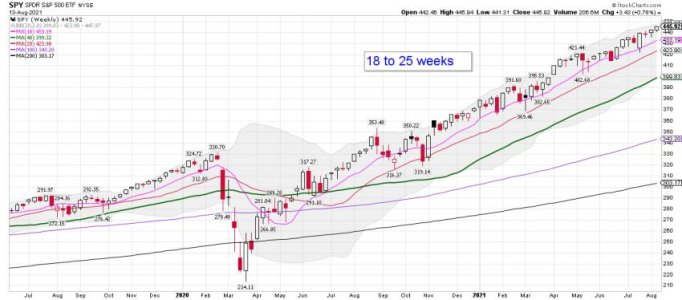
For the record: I just trend trade these days. The price action has continued to drift higher since the 2020 March low, after short-term tags down to the 50 dma.

So will next week be up or down? LOL....

Bottom Line: The SPY trend remains up!

May 23, 2014,03:31pm EDT
What? Some Proven Investment Strategies Are Too Simple To Accept?


Sy HardingContributor
Investing
I cover being street smart about the stock, bond and gold markets
https://www.forbes.com/sites/shardi...ies-are-too-simple-to-accept/?sh=86c5ed17c727
 

Attachments

  • a.jpg
    a.jpg
    65.9 KB · Views: 46
  • a.jpeg
    a.jpeg
    13.4 KB · Views: 45
Last edited:
QUICK GOLD UPDATE
Posted on August 13, 2021 by admin

Gold prices stabilized after spiking below $1700 early in the week. A close on Friday above $1760 could trigger a bullish reversal and a potential double bottom.


Before we jump into the weekend, I wanted to mention the weekly chart of gold.

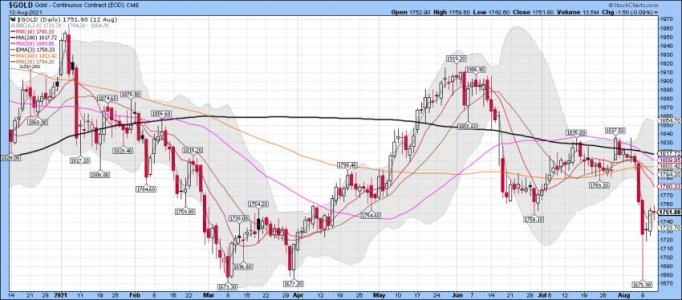
Gold daily: Not an easy sector to trade!

GOLD WEEKLY: A close above $1760 on Friday would create a bullish hammer and a potential Double Bottom. Upside follow-through above $1800 next week would promote an intermediate low with a breakout above $1920 required to confirm the next bull market advance.

https://goldpredict.com/archives/31166

Bottom Line: They all LOOK like they are trying to bottom. We shall see how it plays out.
 

Attachments

  • a.jpg
    a.jpg
    67.4 KB · Views: 44
  • a.jpg
    a.jpg
    59.9 KB · Views: 43
  • a.jpg
    a.jpg
    61.8 KB · Views: 43
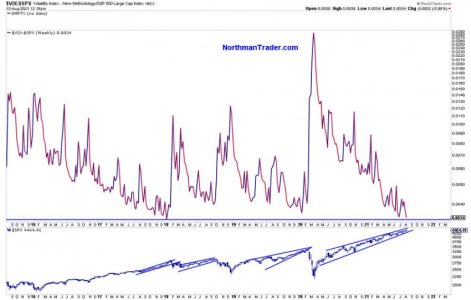
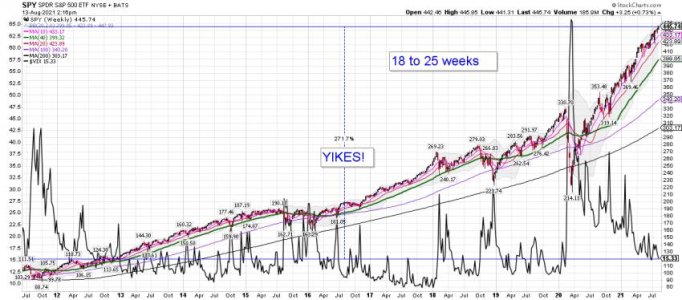
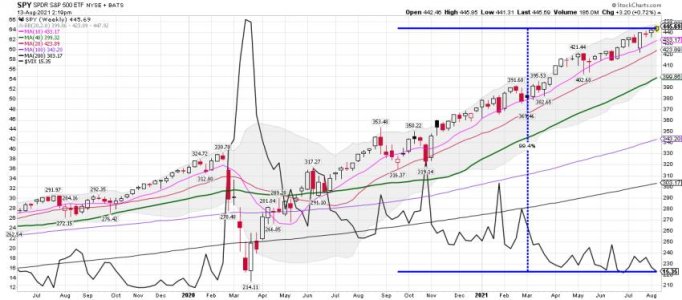
VIX and the SPY weekly ratio: I have pointed this out before. I will post on my chart..... It's been an amazing run, and the trend remains up for the SPY and the VIX contiunes to move lower..... The current divergence is next to the YIKES! LOL..... NO FEAR..... It's the ratio we are looking at here between the two prices.

Sven Henrich
@NorthmanTrader

1h
$VIX $SPX ratio lowest since January 2018 which was the lowest on record at that point.
https://twitter.com/NorthmanTrader
 

Attachments

  • a.jpg
    a.jpg
    50 KB · Views: 40
  • a.jpg
    a.jpg
    71.9 KB · Views: 39
SPY and the VIX ratio: A closer look, and it doesn't matter until it does.

Bottom Line: The divergence continues and the trend for the SPY remains up!
 

Attachments

  • a.jpg
    a.jpg
    61.4 KB · Views: 40
Hmmmm...... A few things to think about. However, I just trade the trend and the price action. So I wouldn't think about this data to much.

Bottom Line: The SPY trend continues higher.

A few tweets from Jesse

Jesse Felder
@jessefelder

Aug 12
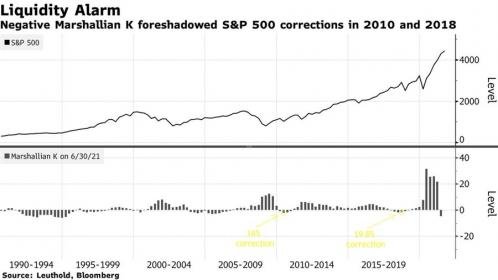
A measure of U.S. financial liquidity whose declines foreshadowed two of the decade’s worst equity routs is flashing alarms even before the Federal Reserve embarks on its planned winding down of asset purchases.'

https://twitter.com/jessefelder
https://bloomberg.com/news/articles...fore-the-fed-taper-hits-markets?sref=qpbhckVU
 

Attachments

  • a.jpg
    a.jpg
    18.7 KB · Views: 40
  • a.jpg
    a.jpg
    27.3 KB · Views: 42
  • a.jpg
    a.jpg
    21.3 KB · Views: 40
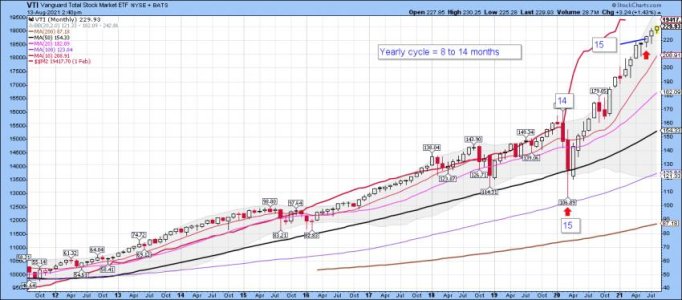
The total stock market and the M2 (VTI): LOL..... I guess he is talking about that little downturn in June. Not that it matters until we see a Trend Change. Month 17 of the yearly cycle. Is cycle low coming? One would think so, but in this market who can say. I say stay nimble and trade smaller.... Who cares about COVID 19 and Delta. Well, I do! There are two really huge states that their leadership really don't seem to care right now. This could cause some big problems in the weeks ahead if they can't get ahead of this surge. It could be a possible earlier warning signal of a possible recessionary warning if folks stop going out again. I'm sure not going out or spending as much as I was several weeks ago. However, I live in Texas. Some states are doing great.

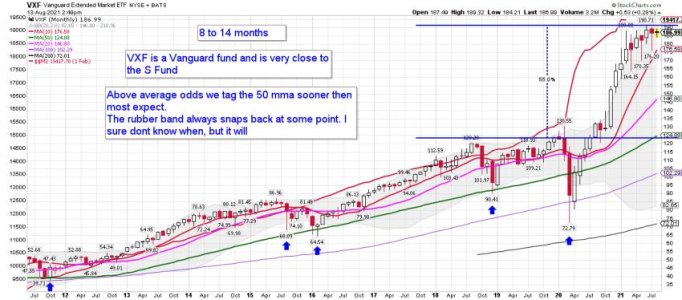
VXF monthly: The S Fund
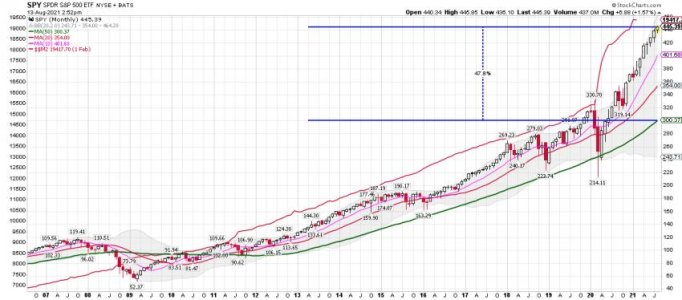
SPY monthly: The C Fund

David Rosenberg
@EconguyRosie

Aug 9
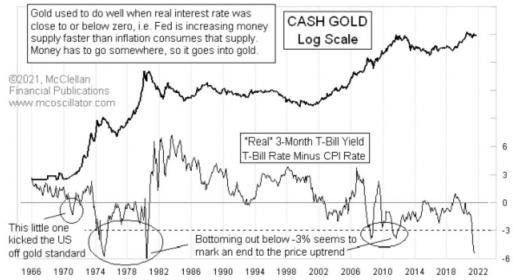
This has received very little play, but the money boom just ran out of gas. M2 stagnated in June for the first time in 3 years and real M2 contracted 0.8% — the history books suggest this could be a recessionary signal.
https://twitter.com/EconguyRosie?lang=en
 

Attachments

  • a.jpg
    a.jpg
    61.8 KB · Views: 45
  • a.jpg
    a.jpg
    72.2 KB · Views: 49
  • a.jpg
    a.jpg
    58.4 KB · Views: 49
Last edited:
I don't think facts or data matter right now. Maybe someday they will again. The truth is the market continues its melt -up! Maybe we will see some increased action next week.

Bottom Line: The SPY remains in its uptrend.

As Bob Farrell teaches us, there are no new eras or paradigms and excesses are never permanent.
Throughout history, markets reflect the balance between risk and reward.
But it seems we are in this New World faith where there is no risk and the rewards are easy to obtain.
I’m not short enough.
Code red.
--Doug Kass, "Doug Kass: Can You Handle the Truth About This Market?", July 17, 2021.


https://whatsnew2day.com/kass-can-you-handle-the-truth-about-this-market/
 

Attachments

  • a.jpg
    a.jpg
    23.7 KB · Views: 38
  • a.jpg
    a.jpg
    53.2 KB · Views: 42
Last edited:
LOL..... its been there for a longtime in my opinion. But the tweets keep coming from this birdie..... Can you hear them?

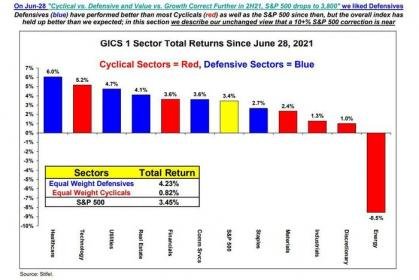
When is the querstion? Maybe it starts next week...... The setup is sure there...... ( Play defense!) I say just stay nimble and keep it small is how I play defense..... Small ball - base hits folks!

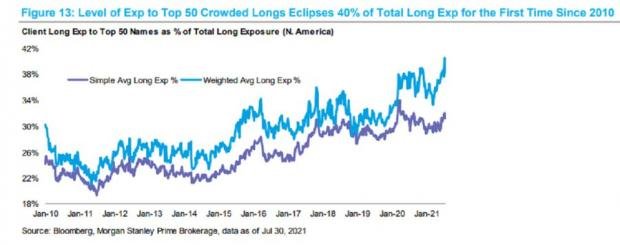
Dizzy at these heights? Our call of the day from the equity trading desk of investment bank Stifel, led by Barry Bannister and Thomas Carroll, may confirm that as they double down on their expectations for a 10%-plus stock market pullback.
This canary in the coal mine shows a 10% S&P 500 correction is getting closer. Play defense, say strategists.

https://www.marketwatch.com/story/t...nse-say-strategists-11628681464?mod=home-page
 

Attachments

  • a.jpg
    a.jpg
    21.7 KB · Views: 42
Back
Top