Bear Cave 2 (Bull Allowed)

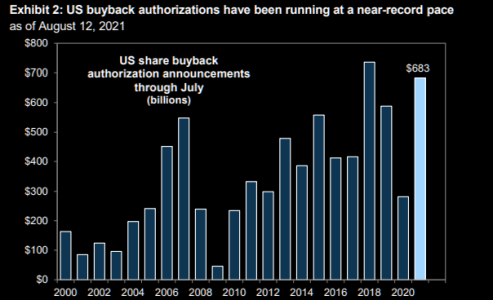
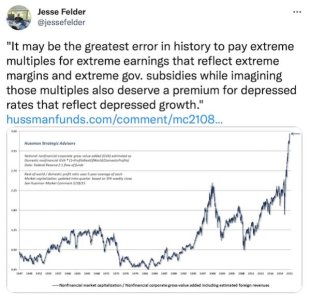
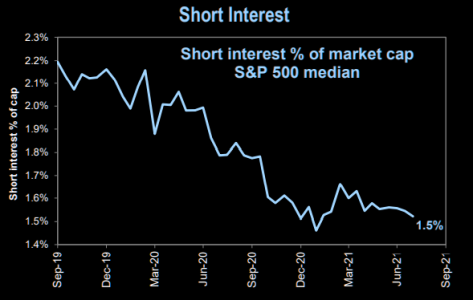
Buy Backs! The insiders are selling their shares at historical records and using share holders money to do Buy Backs.

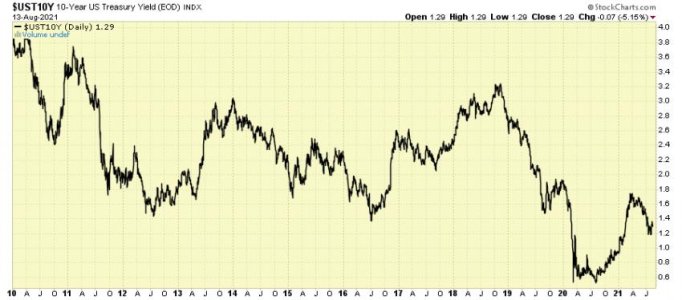
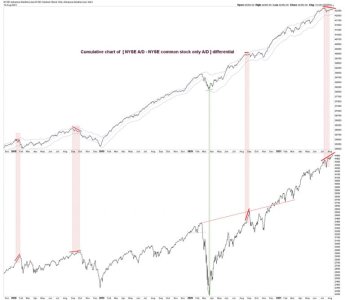
Kostin: "Repurchases totaled more than $200 bn in 2Q and buyback announcements through July equaled $683 bn. Previously-announced deals should drive nearly $250 bn of cash M&A spending in 2H 2021, joining a potential $460 bn of buybacks if the recent pace continues. This demand should easily outweigh equity supply from IPOs, follow ons, SPACs, and convertibles as well as potential selling from upcoming IPO lock-up expiries. The 4-quarter S&P 500 shareholder yield of 2.5% (1.2% net buyback, 1.3% dividend) registers 357 bp above the real 10-year UST yield of -1.1%, a wider gap than average during the last 30 years"
https://themarketear.com/
 

Attachments

  • a.png
    a.png
    35.9 KB · Views: 41
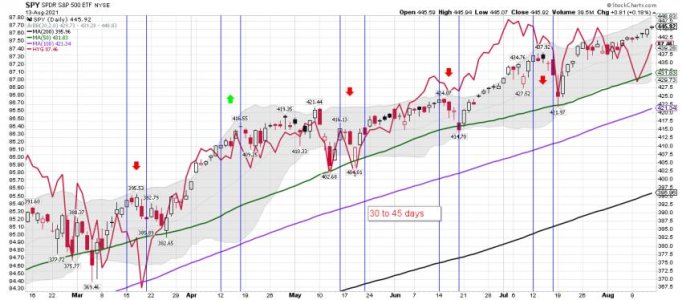
SPX cycle:

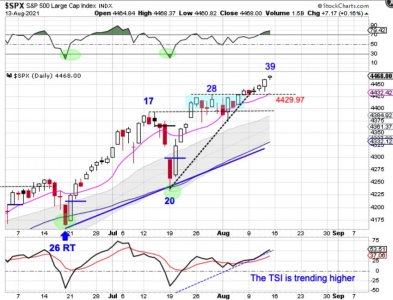
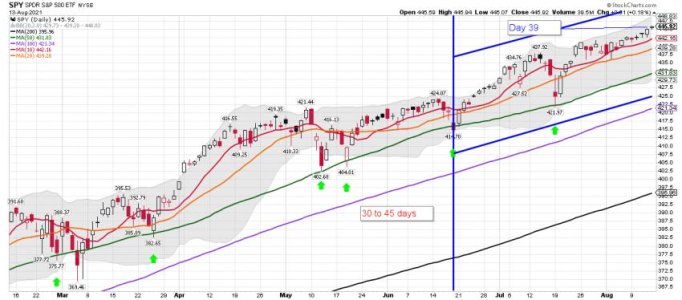
Stocks broke bullish out of consolidation the previous Friday and delivered bullish follow through this week.

Friday was day 39, placing stocks in their timing band for a daily cycle decline. At this point, this breakout will likely be given right back as stocks seek out their daily cycle low.

However, there is the potential for stocks to begin a melt-up phase. Therefore the trailing 10 day MA could now be used as the stop. Stocks are currently in a daily uptrend. They will remain in their daily uptrend unless they close below the lower daily cycle band.

https://likesmoneycycletrading.wordpress.com/2021/08/14/the-8-14-21-weekend-report-preview/
 

Attachments

  • a.jpg
    a.jpg
    88.7 KB · Views: 43
  • a.jpg
    a.jpg
    61.6 KB · Views: 42
Good interview with a Quant covering passive funds, re-balancing, risk and problems caused by ultra-low (or negative) rates. One example are market participation products. They buy a note to guarantee the principle and use the remaining funds to buy options. Your principle is returned in 5-10 years and you get extra if the market rises. Zero rates make these products unworkable as there is nothing left for options and commissions.

https://www.grant-williams.com/podcast/the-end-game-ep-3-mike-green/
 

Attachments

  • ust.jpg
    ust.jpg
    45.8 KB · Views: 33
Welcome to TSPtalk Brother.

I'm keeping a close eye on Bonds too - HYG mainly. A huge bounce last week as someone saved the day.( Red line behind SPY) HYG can be a tell for what is coming for SPY. Next week we could see some bigger moves for stocks and the miners..... I still think the SPY is due for another tag of the 50 dma very soon.

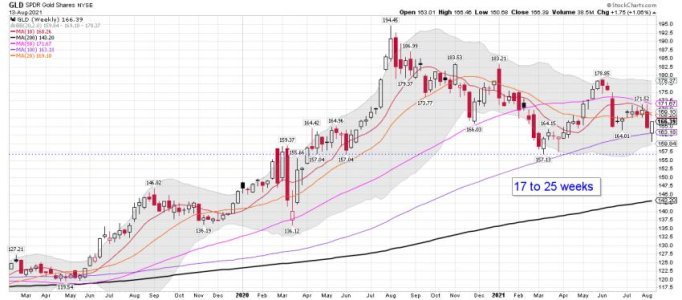
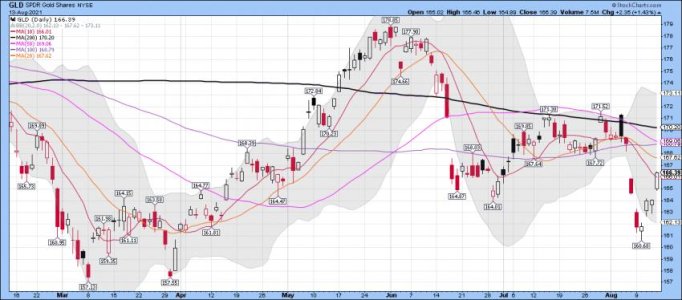
Bottom Line: Still to early to call a bottom for gold and the miners....... However, some good trading for ST trading.

Bob's latest free stuff....

Wheels Keep on Turning
August 15, 2021/in NewPublic /by Bob Loukas

https://thefinancialtap.com/2021/08/wheels-keep-on-turning/

This blog post is a copy of a premium member post from August 14th, 2021.
I hope you enjoy the video.

GLD weekly:
GLD daily:
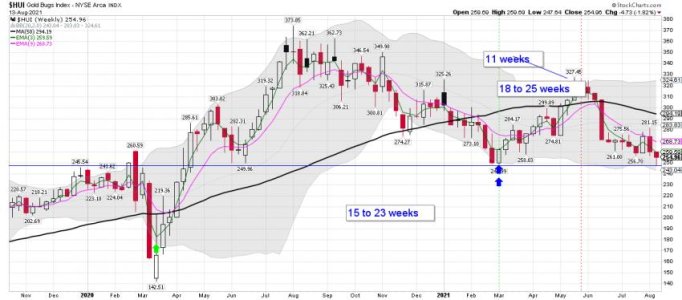
HUI weekly:
 

Attachments

  • a.jpg
    a.jpg
    66.3 KB · Views: 37
  • a.jpg
    a.jpg
    59.3 KB · Views: 38
  • a.jpg
    a.jpg
    59.9 KB · Views: 36
  • a.jpg
    a.jpg
    55 KB · Views: 36
  • a.jpg
    a.jpg
    69.6 KB · Views: 36
  • a.jpg
    a.jpg
    63.5 KB · Views: 37
  • a.jpg
    a.jpg
    67.1 KB · Views: 35
Last edited:
XAU daily:

Bottom Line: Stay nimble and trade small until the next major trend is confirmed.
 

Attachments

  • a.jpg
    a.jpg
    59.6 KB · Views: 36
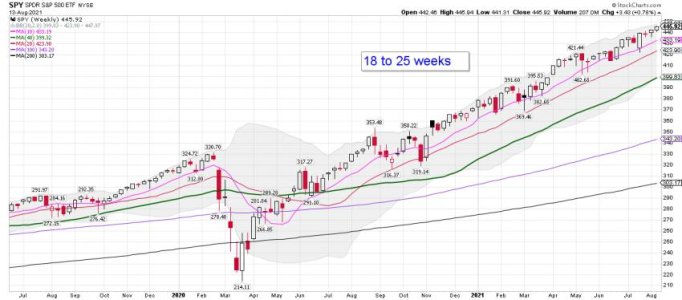
SPY weekly: Bob talks about the weekly cycle and the current melt up.....
 

Attachments

  • a.jpg
    a.jpg
    53.2 KB · Views: 38
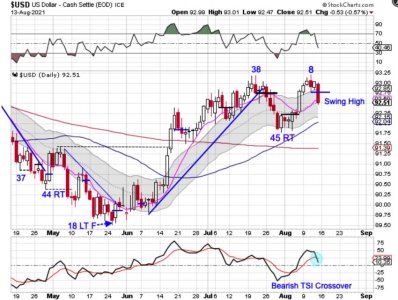
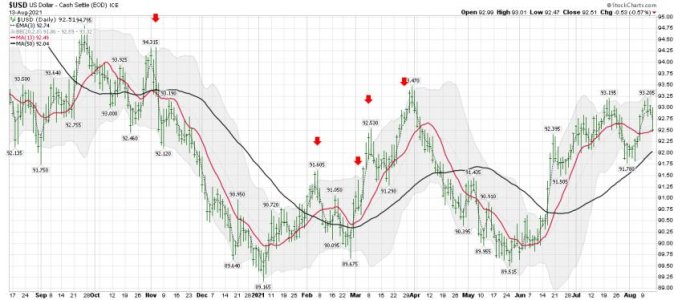
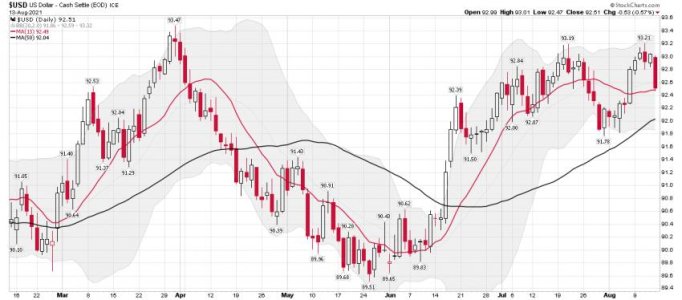
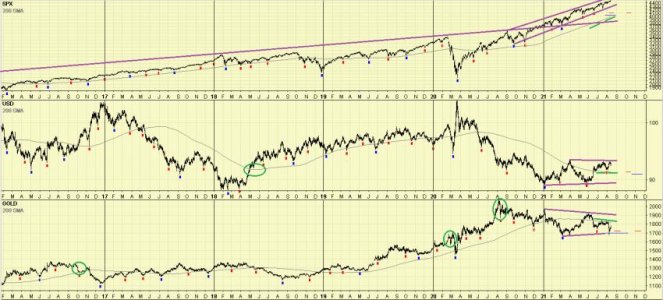
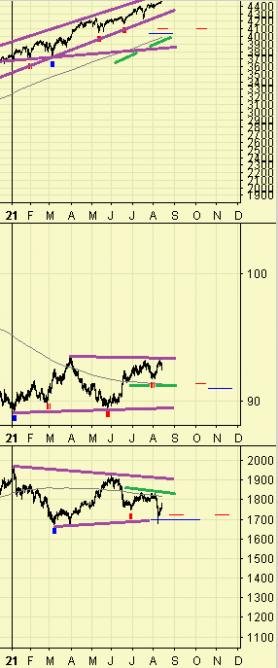
Stock, dollar and gold cycle chart with timing bands for future lows based on past cycle durations. Helps visualize the upcoming cycle lows that Bob is talking about. Red line = daily cycle low estimated date. Blue line = intermediate cycle low estimated date. 200 DMA for simple technicals. SPY 200 is up so buy the dips. Dollar 200 is turning up so buy the dips. Gold 200 is turning down so sell the rips (until the trend changes).
 

Attachments

  • 4FF4EFAB-6169-40B8-8549-6C5884F10B9A.jpg
    4FF4EFAB-6169-40B8-8549-6C5884F10B9A.jpg
    67.7 KB · Views: 49
Last edited:
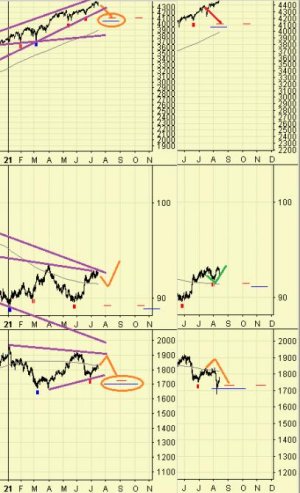
Cycle chart from a month ago compared to now. Not perfect but useful.
Projected SPX decline into DCL/ICL - nope.
Projected USD bounce off of 200 SMA and rise - yep.
Projected Gold bounce off of trend line and drop - kinda.
 

Attachments

  • 6458BADA-26AC-4386-ABC3-DE6F9ED2002C.jpg
    6458BADA-26AC-4386-ABC3-DE6F9ED2002C.jpg
    52.6 KB · Views: 46
thomas
@VolumeDynamics

Aug 14
We are setting up for a STRUCTURAL PULLBACK... the one that scares the hell out of everybody, and that includes most of the bears... and that's because the FedN'Friendz will not allow normal cyclical declines. it could happen next week or later this year.

https://twitter.com/VolumeDynamics

SevenSentinels
@SevenSentinels

Aug 13
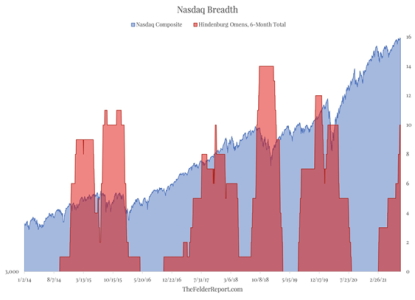
Today's Hindenburg Omen on the NASDAQ was the ELEVENTH in six months

SevenSentinels
@SevenSentinels


https://twitter.com/SevenSentinels?ref_src=twsrc^google|twcamp^serp|twgr^author
 

Attachments

  • a.png
    a.png
    80.3 KB · Views: 52
[FONT=&]Cycle chart from a month ago compared to now. Not perfect but useful.[/FONT]
[FONT=&]Projected SPX decline into DCL/ICL - nope.[/FONT]
[FONT=&]Projected USD bounce off of 200 SMA and rise - yep.[/FONT]
[FONT=&]Projected Gold bounce off of trend line and drop - kinda.[/FONT]

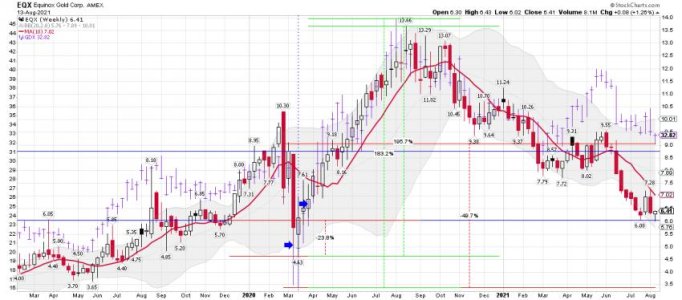
I'm keeping it small and staying nimble. I still have a small tranche of EQX. I remain fairly flat right now.
 

Attachments

  • a.jpg
    a.jpg
    61.2 KB · Views: 49
Just as soon as we become comfortable that these don't men anything... :poke:

Yes Sir! I just continue to trade the price action and I hate it right now. With all the warning signs I'm seeing for a 5 to 10% correction I remain mainly flat.
 
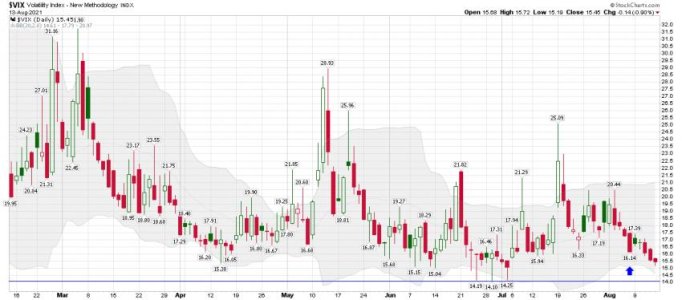
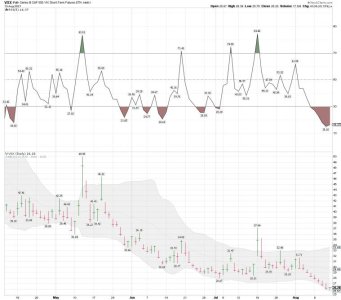
VIX/VXX

The Crystal Ball Is Flashing Once Again
Jeff Clark | Aug 16, 2021 | Market Minute | 3 min read
Here we go again…

The stock market’s “crystal ball” is flashing another warning sign.

Volatility Index (VIX) call options are much more expensive than the equivalent put options.

And, as we’ve seen a couple of times this year, whenever this condition exists, the broad stock market is vulnerable to a sharp and sudden decline…

The last time this happened was back in early June. The VIX call options were far more expensive than the puts, and the S&P 500 dropped over 100 points during the next few sessions.

We noted this same condition in late January. The S&P 500 fell nearly 200 points in the following week.
https://www.jeffclarktrader.com/market-minute/the-crystal-ball-is-flashing-once-again/
 

Attachments

  • a.jpg
    a.jpg
    55.4 KB · Views: 53
  • a.jpg
    a.jpg
    57.7 KB · Views: 53
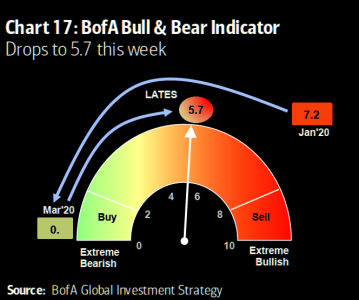
"Things That Make You Go Hmmm." Well, that's what I think when I look over this data..... Hmmmmm.....


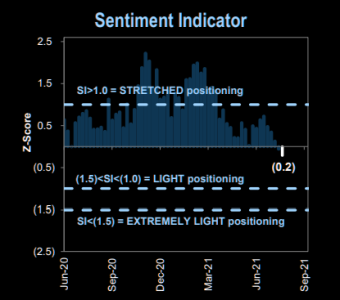
Sentiment: you cannot believe this
GS Sentiment indicator now actually printing negative. Pretty remarkable with stocks printing daily new all time highs
https://themarketear.com/
 

Attachments

  • a.png
    a.png
    37.2 KB · Views: 57
  • a.png
    a.png
    56.6 KB · Views: 60
  • a.png
    a.png
    45.1 KB · Views: 57
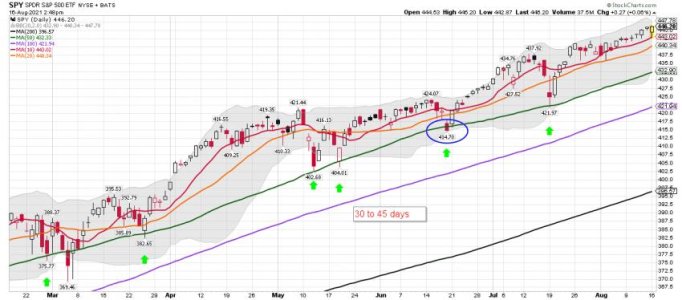
SPY daily: Easy money Monday is in play..... A nice bounce after tagging the 10 dma......

Bottom Line: The trend remains up! Nothing matters as the melt-up continues as money flows into the SPY!
 

Attachments

  • a.jpg
    a.jpg
    59 KB · Views: 50
Last edited:
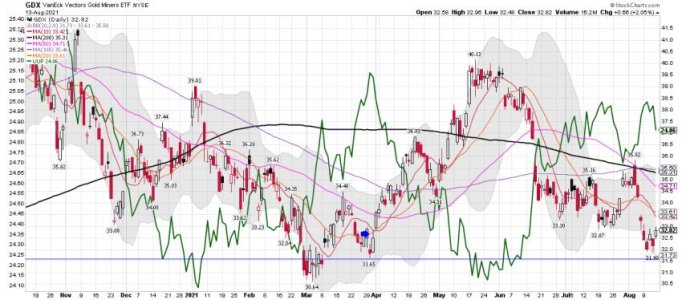
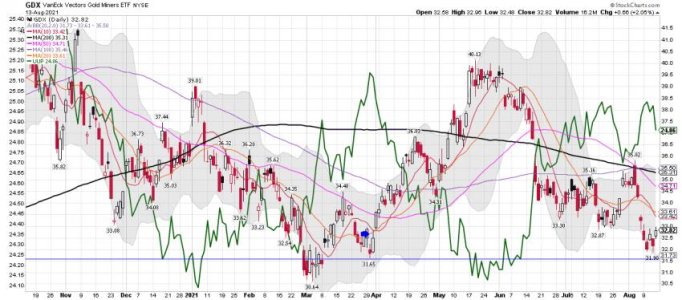
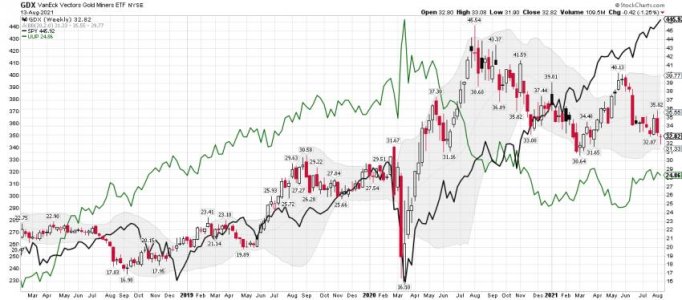
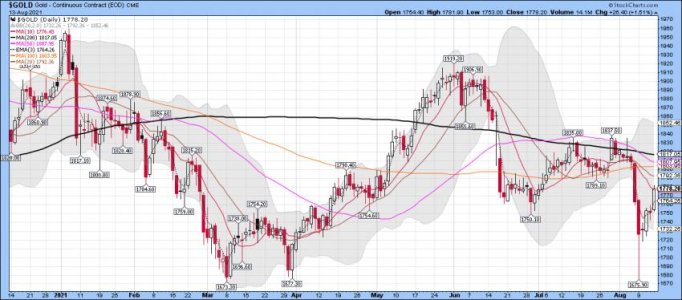
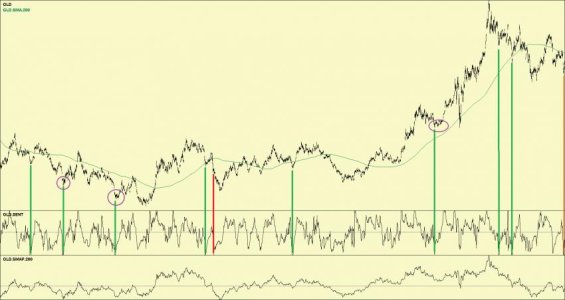
1) Zero sentiment usually marks a gold bottom (sometimes a sideways bottom).

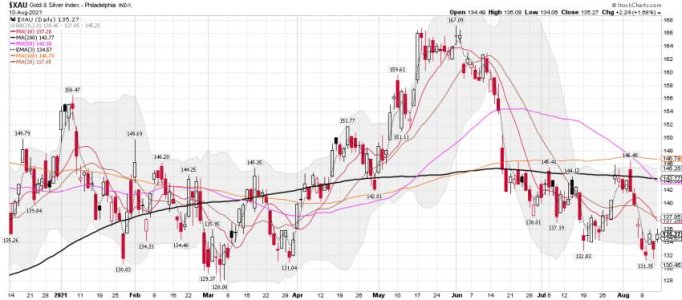
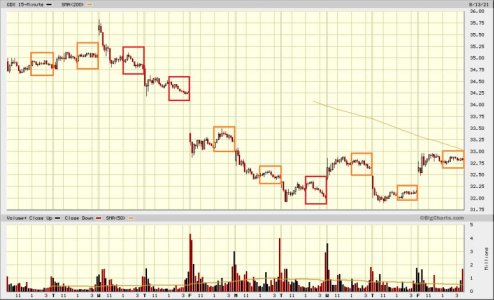
2) Dollar holding, gold rising and miners doing poorly - rising mining costs will cut into their profitability.

3) Retail moves in the morning and institutions move after lunch - big money has been flat or selling.

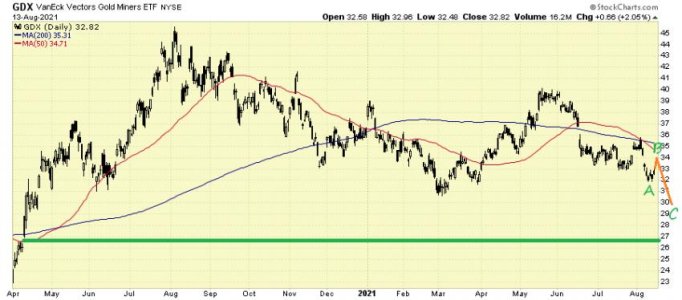
4) Too many people are on-board gold and miners (GDX). What would throw them off? An ABC off of the 200 DMA targets 30. There is also a GDX gap at 27. A drop below 32 would flush out the longs and a turn at 31 would leave the 27/30 dollar people behind.

5) Stocks and gold are also in their timing bands for ICL's so there could be a scary double washout that flushes everyone out.

P.S.

I want to save time so how can I upload multiple images in one interaction?
How do I delete old images so the attachment dialog isn't cluttered with stale images?
My narrow image got shoved to the right side - is there a way to force left alignment?
My posted images are blurrier than the originals - any way to sharpen them?
 

Attachments

  • sentiment.jpg
    sentiment.jpg
    45.6 KB · Views: 49
  • retail.jpg
    retail.jpg
    78.7 KB · Views: 50
  • miners suck.jpg
    miners suck.jpg
    47.3 KB · Views: 48
  • target.jpg
    target.jpg
    49.9 KB · Views: 48
  • icl.jpg
    icl.jpg
    35.8 KB · Views: 47
Last edited:
I’m on my IPad so I don’t post images or much of anything on this device. I will let you know once I get back home on my computer. I want to ensure I explain it correctly. If Tom stops by maybe he can tell you.

Are you trading the miners today?

Take Care!
 
Back
Top