Bear Cave 2 (Bull Allowed)

SAY WHAT! When is someday? I agree that one day traders will BTD and the market will keep moving lower and tag the 200 dma on the daily chart.

‘A Lot of Very Young People’ Are Going to Buy the Dip in Stocks

Every dip has been bought and immediately paid off: Frederick

Someday, the post-pandemic equities rally is going to end. When it does it will take a lot of newly christened stock bulls with it.

Their refusal to bend has been the signature fact of the stock market for at least 12 months, putting a floor under four other selloffs in 2021 alone that look just like the one that has sheared almost 3% off the S&P 500 Index since Thursday. Whether the devotion of retail investors is enough to turn the tide again is the biggest question in markets right now.
https://www.bloomberg.com/news/arti...ic&utm_content=billionaires&utm_medium=social
 
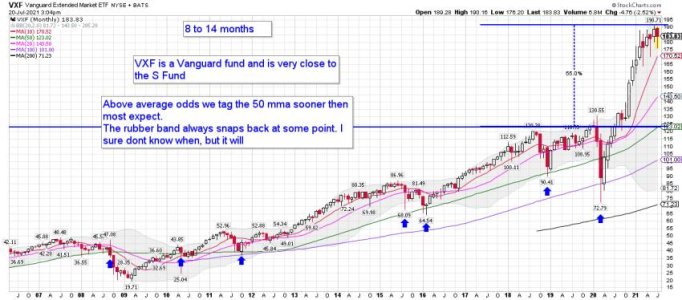
VXF monthly: Moving back up nicely, but it might end up being a lower high. We shall have to wait and see how it plays outs.
 

Attachments

  • a.jpg
    a.jpg
    70.3 KB · Views: 62
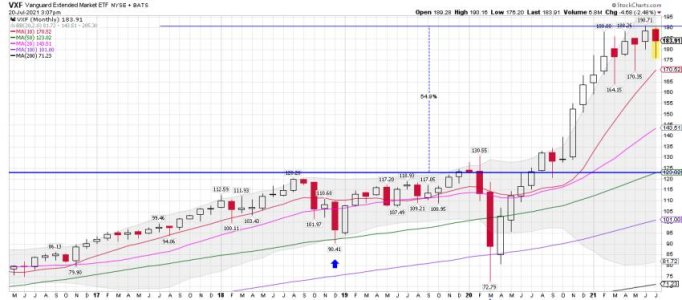
VXF monthly: A closer look at the current yearly cycle since the March 2020 low.
 

Attachments

  • a.jpg
    a.jpg
    56.9 KB · Views: 62
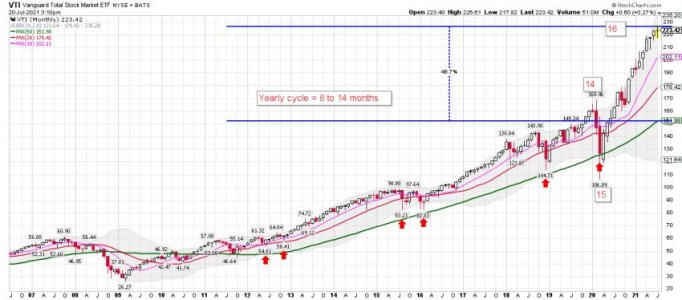
VTI monthly: A Total Stock Market index at Vanguard. Looks like another all time high is possible. This is month 16.....
 

Attachments

  • a.jpg
    a.jpg
    57.6 KB · Views: 63
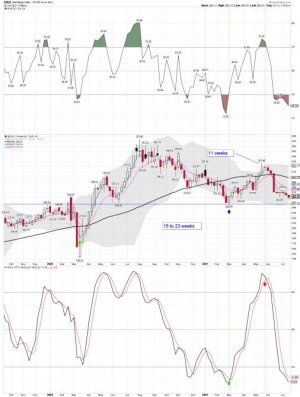
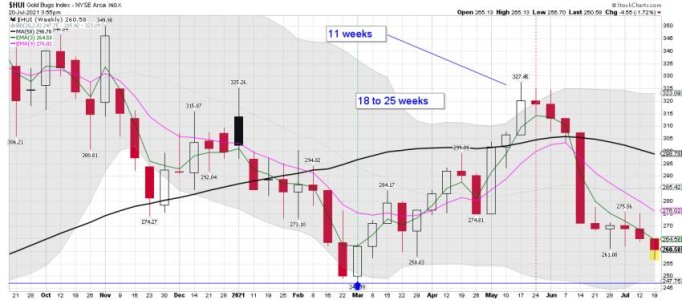
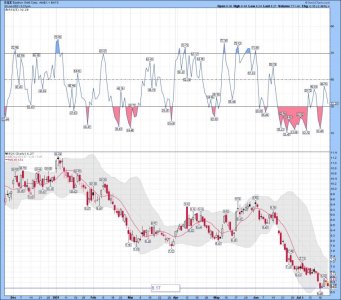
HUI weekly: HUI needs to get back above the 9 ema, but first it needs to close above the 3 ema. We shall see how it closes this week. We are getting deeper into this cycle.
 

Attachments

  • a.jpg
    a.jpg
    50.3 KB · Views: 68
HUI weekly: A closer look.... "MAYBE" a higher low is taking place now and a ICL.....
 

Attachments

  • a.jpg
    a.jpg
    54.9 KB · Views: 67
Last edited:
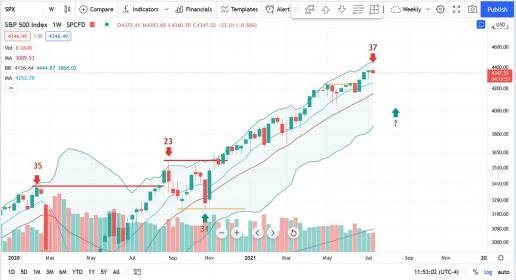
SPY weekly cycle data: Another cycle dude. ( 18 to 25 weeks)

Bob Loukas
@BobLoukas
37 Weeks since the last clear cut S&P Cycle Low, that's the biggest concern. Rarely goes this long without a decent selloff (6-10%+)

Weekly Cycle declines drag down risk assets in general.

Bob Loukas
@BobLoukas
37 Weeks since the last clear cut S&P Cycle Low, that's the biggest concern. Rarely goes this long without a decent selloff (6-10%+)

Weekly Cycle declines drag down risk assets in general.
https://twitter.com/BobLoukas/status/1416064024819732486/photo/1
 

Attachments

  • a.jpg
    a.jpg
    21.8 KB · Views: 66
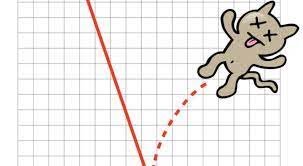
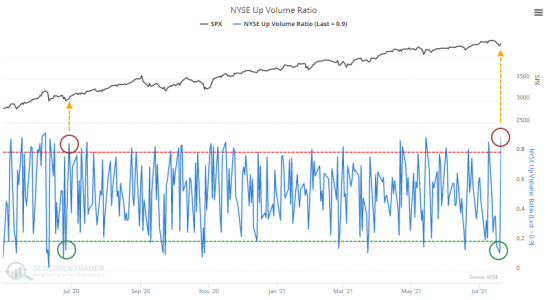
Is the bottom in...or is this just a dead cat bounce?
Do we declare that the bottom is in? The longer term outlook for stocks remains rosy according to JPM;

"Fed being active for at least another 9 months, strong corporate balance sheets, increasing buybacks, potential for M&A/Private Equity buyouts, and the healthiest consumer financial profile in our lifetimes should continue to support a move higher in Equities".

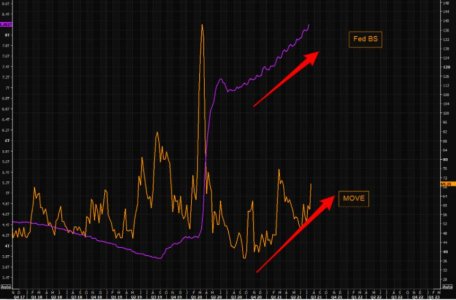
Let's go back to the Fed being active aspect. As we have been pointing out recently, despite Fed being active and the BS printing new highs every week practically, bond volatility, MOVE index, remains stressed. Note the last move in MOVE. Bond markets aren't buying the equities story and the MOVE vs VIX gap is becoming huge again (here).

So, do you trust equity people, or the more "stressed" bond people?

https://themarketear.com/
 

Attachments

  • a.jpg
    a.jpg
    52.3 KB · Views: 63
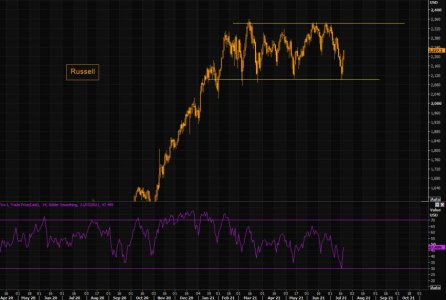
Russell - the "recovery" in frustration and max p/l pain
It was only 2 sessions ago we pointed out the extremely oversold conditions in Russell. We wrote;

"We are asking ourselves if Russell at range lows and RSI in full implosion mode could start reversing?"

Fast forward to today and Russell is +6% from the low print 2 days ago. This is the small cap index, not a small cap stock...

Given the poor liquidity and short gamma, all moves continue to be magnified as everybody chases everything higher they puked only a few sessions ago.

Russell remains in short gamma land, but levels are much smaller compared to the max short gamma we pointed out on Monday (here).

The perfect range continues to hold. Note we are moving into the middle of the range which is basically no trade zone for new positions.

Ranges are to be traded from a mean reversion point of view. It hurts to go against the crowd (both ways), but it is usually well rewarded...until the range break properly.

If you had the confidence to buy that beyond oversold Russell set up, booking profits is the prudent trade as we await the next set up...
https://themarketear.com/
 

Attachments

  • a.jpg
    a.jpg
    59.4 KB · Views: 74
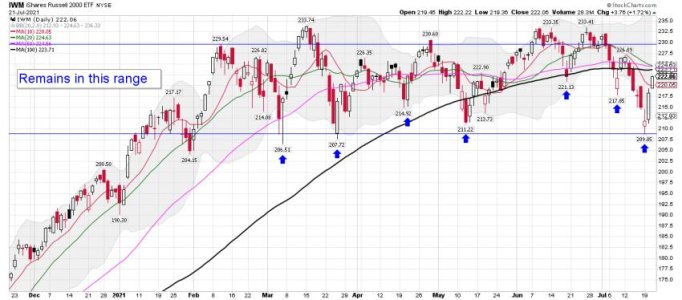
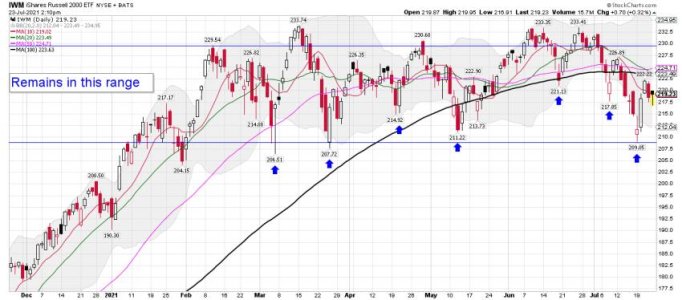
IWM daily: A look at my IWM daily chart. Hasn't done much since the Feb high, but for ST traders some very nice swings to trade! I'm sure some got whipsawed on these swings and others have made some nice money. Th trade was to wait to buy the lower BB and sell the upper. Worked on most trades.... Just wait a bit to BTD trade......
 

Attachments

  • a.jpg
    a.jpg
    60.3 KB · Views: 76
Last edited:
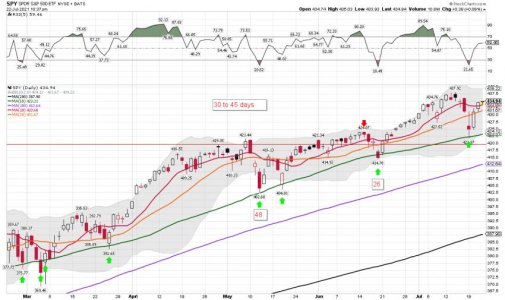
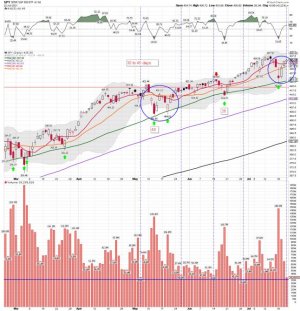
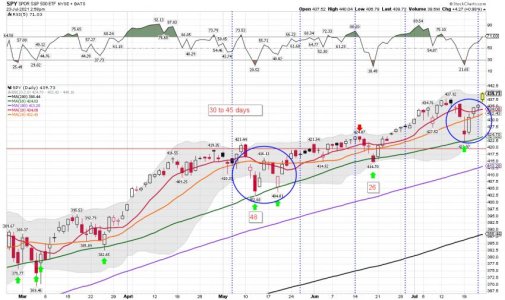
SPY daily: Back above the 10 dma after tagging the 50 dma..... Another good buy? So far it be looking that way..... Some think this be a kitty bounce..... I say we shall see!
 

Attachments

  • a.jpg
    a.jpg
    76.7 KB · Views: 82
I need to get one of these. See picture below....

Predictions? On the Market, They're Useless
If talking heads in financial media use their crystal ball enough, it's bound to be right sometimes, but wrong enough to do some harm. Let's look at this forecast from Thursday morning.

https://twitter.com/RevShark/
 

Attachments

  • a.jpg
    a.jpg
    15.3 KB · Views: 81
IWM: Ok..... good luck trying to short IWM unless you are trading the current pattern of the upper and lower BB swing tag. If you are you currently should be LONG based on the pattern. Trouble at the 10 dma? We shall see if the Bulls can paint the chart with a nice candle at the close. Looks like they will get that done. After all, Easy Money Monday be up next!

https://stockcharts.com/h-sc/ui?s=IWM&p=D&yr=0&mn=8&dy=0&id=p81656239996&a=996124683
SevenSentinels
@SevenSentinels

50m
IWM is an ETF for the Russell 2000 and it's an excellent reflection of what stocks are doing "on average" for any time period.

It's lower on the session, the week, the month, the quarter, and the latest six month period:
https://twitter.com/SevenSentinels?ref_src=twsrc^google|twcamp^serp|twgr^author
 

Attachments

  • a.jpg
    a.jpg
    61.2 KB · Views: 81
Last edited:
SPY daily: If you bought the 50 dma tag ( went long before the close) you are a happy BTDer so far. Isn't this easy to trade? "NOT" LOL...... The Bears were smashed again, and it's never easy in real time unless you keep the trades small. Then it's much easier to pull the trigger.

Another ATH for SPY!
 

Attachments

  • a.jpg
    a.jpg
    83.5 KB · Views: 87
Back
Top