Bear Cave 2 (Bull Allowed)

VXF weekly: A Vanguard fund that is close to the S Fund. In the past months a move down for 3 weeks has resulted in a nice bounce for the BTD crowd. We shall see how next week plays out.

Bottom Line: Closed below the 10 and 20 wma. We need to be on the lookout for an intermediate cycle decline.
 

Attachments

  • a.jpg
    a.jpg
    72.2 KB · Views: 64
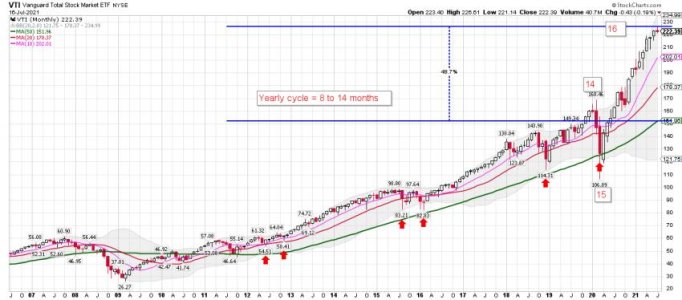
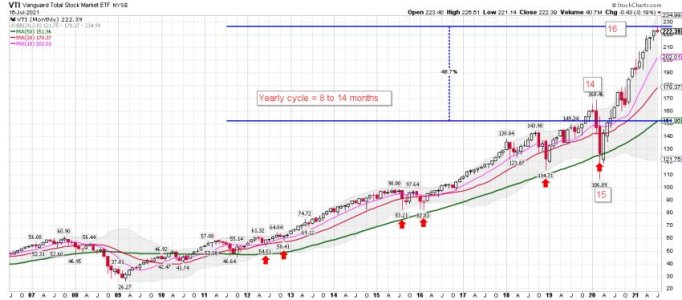
VTI monthly cycle and the yearly cycle: A possible move into the yearly cycle low could be getting very close now. One should stay nimble at this point of the cycle in my opinion. It has been a very nice run from the last YCL. VTI is the total stock market and is a fund at Vanguard. Above average odds we tag the 10 mma and more likely the 20 mma during the next YCL, because it is so stretched above the mean.
 

Attachments

  • a.jpg
    a.jpg
    57.4 KB · Views: 57
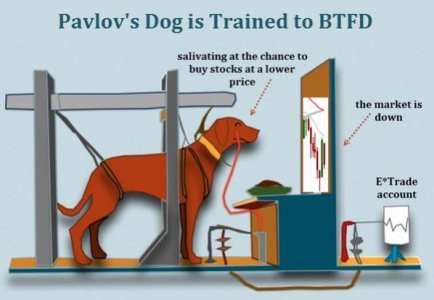
LOL.... I will keep posting until the BTD slows down.... The Fed remains in play.....


The Power of the Fed:
When COVID-19 struck, the Federal Reserve stepped in to try to avert economic crisis. As the country’s central bank continues to pump billions of dollars into the financial system daily, who is benefiting and at what cost?
https://www.pbs.org/wgbh/frontline/...rofthefed&mc_cid=c9dc0dfd70&mc_eid=5b348a9ca0
 

Attachments

  • dogbfrd.jpg
    dogbfrd.jpg
    31.1 KB · Views: 67
The big money question is - WHEN WILL IT END?

SevenSentinels
@SevenSentinels
·
20h
"How will this end?" has never been in doubt. Only the "when?" had been yet to be revealed.

We finally have that critical question answered with a resounding "now!"

We'll Examine The Overwhelming Evidence in the Regular Weekly Article Here Tomorrow
 

Attachments

  • a.png
    a.png
    17.4 KB · Views: 75
Where is the BEEF?

Helene Meisler
@hmeisler

22h
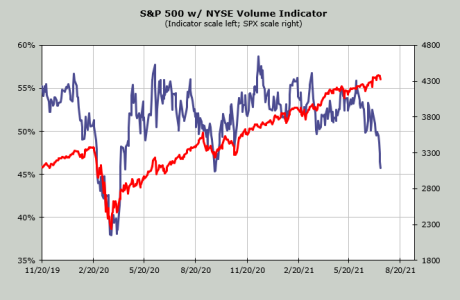
Volume Indicator (upside as % of total, 30 dma)

There is your deterioration in one chart.
 

Attachments

  • a.png
    a.png
    40.3 KB · Views: 79
Wow, so much doom and gloom out there right now. Hussman makes you want to bury your cash in the backyard. Can they all be right? The set up for a decline seems to be there, but will it be that easy for the bears who have been beaten to death for the last year?
 
Wow, so much doom and gloom out there right now. Hussman makes you want to bury your cash in the backyard. Can they all be right? The set up for a decline seems to be there, but will it be that easy for the bears who have been beaten to death for the last year?

The main reason I went to trend trading last year is so I could just ignore all the noise and just trade the price action.... I still ST trade the daily data, but for MT trading the weekly has worked well.

(I continue to trade what is happening not what I think will happen)

And that has not be easy at times. Many bears are just BTD these days, and the data shows it. I posted the (VTI) monthly data above and we are very stretched above the mean being this deep into the yearly cycle. With that said, the next YCL will probably just be another buying op, but for now that is just a guess. It seems the Fed will remain a player for now.


LOL..... This has been a historical run since the March 2020 low. The current setup is we have above average odds of tagging the 20 mma during the next YCL, and the data suggests that could be this year.

Bottom Line: Love it or hate it (VTI) remains in a uptrend.

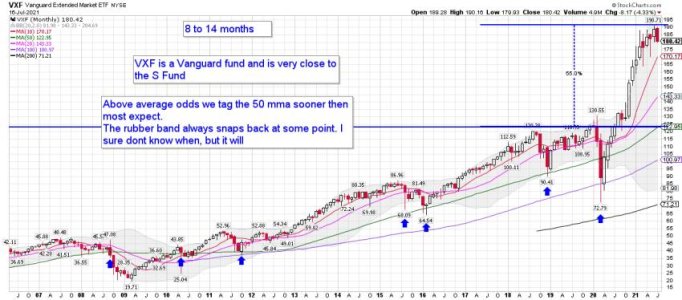
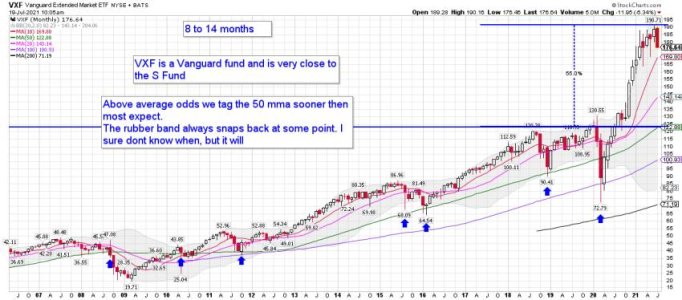
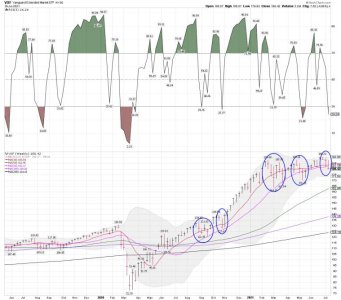
I'm posting a VXF monthly chart below. Another index I like to trade at Vanguard.

VXF - Product summary
Seeks to track the performance of a benchmark index that measures the investment return of stocks from small and midsize companies.
Provides a convenient way to match the performance of virtually all regularly traded U.S. stocks except those in the S&P 500 Index.
Passively managed, using index sampling techniques.
https://investor.vanguard.com/etf/profile/VXF
 

Attachments

  • a.jpg
    a.jpg
    70.2 KB · Views: 81
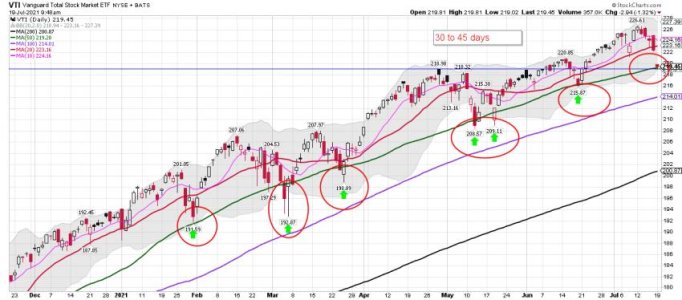
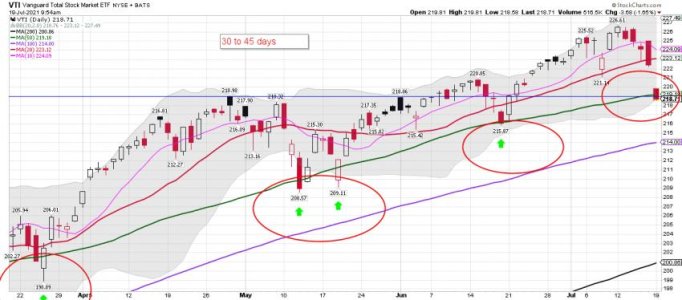
VTI daily: A closer look.... We shall see if VTI holds after the close or it moves down to the 100 dma. We can't rule out this is the start of the YCL..... I be watching and ST trading. As you can see on the chart the average move down on these pullbacks has been only 3 to 5 days. The index then continues on the current cycle or we start a new one.
Any tag of the lower BB has also been a nice buying op. We are already there.
https://stockcharts.com/h-sc/ui?s=VTI&p=D&yr=0&mn=4&dy=0&id=p24296618371&a=994300164
 

Attachments

  • a.jpg
    a.jpg
    59.1 KB · Views: 76
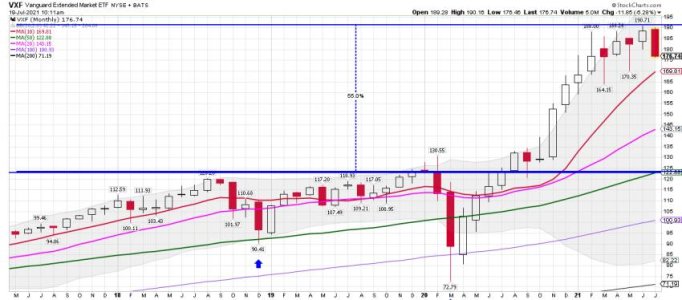
VXF monthly: This index is close to the S Fund. Is this the start of the YCL? We shall see! A ways to go just to get back closer to the mean.
 

Attachments

  • a.jpg
    a.jpg
    70.4 KB · Views: 76
Last edited:
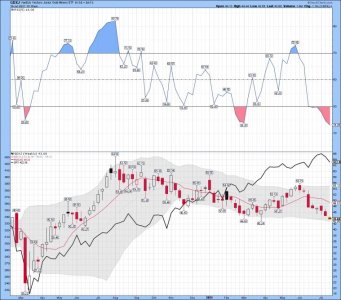
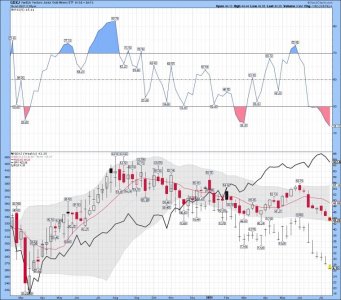
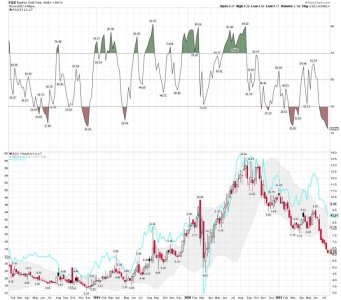
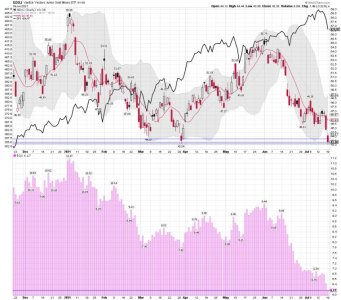
EQX weekly: Starting to scale in slowly on a few oversold gold miners. I have NO IDEA how much lower they might go, so keeping it small.

Buying some EQX..... LOL..... catching the falling knife and I don't normally buy during a downtrend. However, since my position will be small it will only be a scratch on my account if it's a loser. I will be holding and adding if we continue to move lower. I'm trying to catch the YCL early for some of the gold miners..... EQX moved up nicely with GDXJ after the last YCL. You can see that on the weekly chart below. I try and use the weekly data when trading the gold miners. Not sure if this company has problems, but I'm buying some small tranches.... There are lots of choices for oversold miners right now. Best to do your homework if you are a long-term investor. This is simply another trade for me.... Win, lose or draw!
https://finance.yahoo.com/quote/EQX/
 

Attachments

  • a.jpg
    a.jpg
    91.3 KB · Views: 80
Last edited:
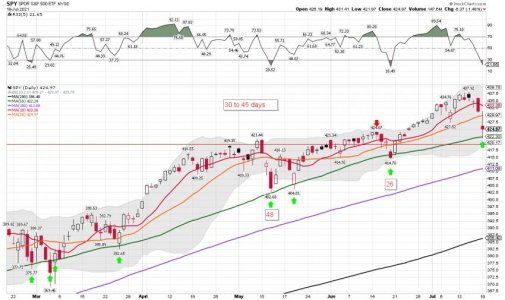
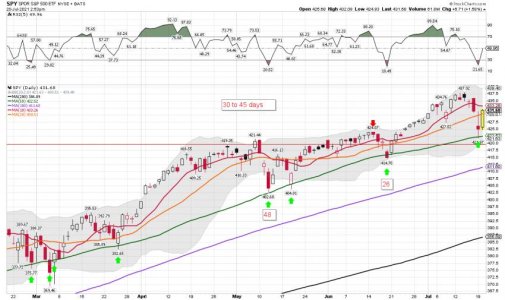
SPY daily: Just BTD..... So far a tag and go of the 50 dma...... Looks good so far..... We wait!
 

Attachments

  • a.jpg
    a.jpg
    76.7 KB · Views: 79
We shall see how it plays out! I have to agree that the chart and pattern does look good!

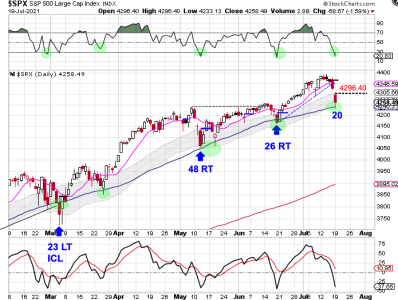
SPX daily cycle pattern:

3 Reasons To Buy The Dip
Reason #1– The 50 day MA. Since the March ICL the 50 day MA has been acting as support.

Reason # 2– RSI 05. Stocks are in an intermediate cycle advance that has been characterized by RSI embedding in overbought and having quick reversals once oversold. A quick bullish RSI reversal would indicate that stocks are resuming their intermediate cycle advance.

Reason # 3 – Cycle Band Buy Signal. Stocks are currently in a daily uptrend. If stocks form a swing low above the lower daily cycle band then stocks will remain in their daily uptrend and trigger a cycle band buy signal.
https://likesmoneycycletrading.wordpress.com/2021/07/19/3-reasons-to-buy-the-dip/
 

Attachments

  • a.png
    a.png
    53.8 KB · Views: 73
Hmmmm.... I will just be watching this morning, but might add some gold miners.....
 

Attachments

  • a.jpg
    a.jpg
    93.6 KB · Views: 67
  • IMG_1960.JPG
    IMG_1960.JPG
    24.3 KB · Views: 67
SPY daily: A nice bounce off the 50 dma.....AGAIN! Back above the 20 dma and the 10 dma be up next.
 

Attachments

  • a.jpg
    a.jpg
    76.8 KB · Views: 58
Back
Top