-
The Forum works well on MOBILE devices without an app: Just go to: https://forum.tsptalk.com
-
Please read our AutoTracker policy on the IFT deadline and remaining active. Thanks!
-
$ - Premium Service Content (Info) | AutoTracker Monthly Winners | Is Gmail et al, Blocking Our emails?
Find us on: Facebook & X | Posting Copyrighted Material
-
Join the TSP Talk AutoTracker: How to Get Started | Login | Main AutoTracker Page
You are using an out of date browser. It may not display this or other websites correctly.
You should upgrade or use an alternative browser.
You should upgrade or use an alternative browser.
Bear Cave 2 (Bull Allowed)
- Thread starter robo
- Start date
robo
TSP Legend
- Reaction score
- 471
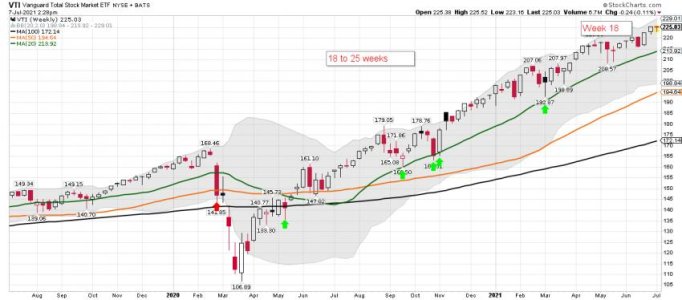
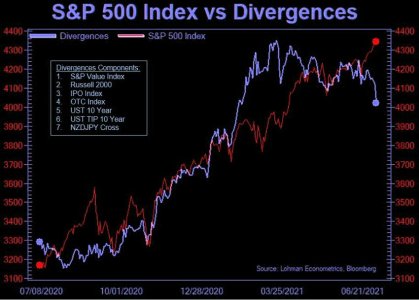
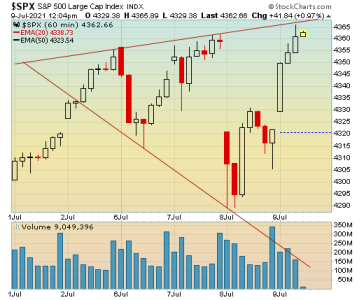
SPX divergence: Hmmmmm......
You can add this to the list!
SevenSentinels
@SevenSentinels
2h
Hint:
They've NEVER Been This Negative- EVER- not even in 1929!
Quote Tweet
SevenSentinels
@SevenSentinels
· 2h
9:45 PM, July 7, 2021
July 7, 2021- 100 Years of McClellan Oscillator Readings On The Top Day
https://twitter.com/SevenSentinels?ref_src=twsrc^google|twcamp^serp|twgr^author
Attachments
robo
TSP Legend
- Reaction score
- 471
nvestors Are Shoveling Money Into Stocks at a Record Pace
Jason Goepfert
Jason Goepfert
Published: 2021-07-08 at 07:35:00 CDT
Stocks keep hitting records, there hasn't been even a pullback for six months, and investors are feeling good. And what do investors do when they're feeling good? Why, they add to their bets, of course.
Through June, equity mutual funds and ETFs have taken in more than $122 billion in assets, according to Lipper. That's the best first half for flows in almost 20 years. The only first half that exceeds this flow, in or out, was the pandemic-inspired outflow last year.
https://www.sentimentrader.com/blog/investors-are-shoveling-money-into-stocks-at-a-record-pace/
Jason Goepfert
Jason Goepfert
Published: 2021-07-08 at 07:35:00 CDT
Stocks keep hitting records, there hasn't been even a pullback for six months, and investors are feeling good. And what do investors do when they're feeling good? Why, they add to their bets, of course.
Through June, equity mutual funds and ETFs have taken in more than $122 billion in assets, according to Lipper. That's the best first half for flows in almost 20 years. The only first half that exceeds this flow, in or out, was the pandemic-inspired outflow last year.
https://www.sentimentrader.com/blog/investors-are-shoveling-money-into-stocks-at-a-record-pace/
robo
TSP Legend
- Reaction score
- 471
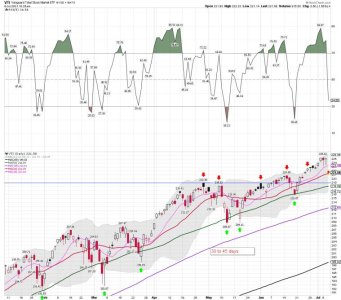
VTI daily: A gap down and a tag of the 20 dma. However, it is holding and a quick bounce so far. (BTD?) Someone is..... Why not..... It continues to work..... We shall see how we close today.
https://stockcharts.com/h-sc/ui?s=VTI&p=D&yr=0&mn=6&dy=0&id=p82401887732&a=983964944
https://stockcharts.com/h-sc/ui?s=VTI&p=D&yr=0&mn=6&dy=0&id=p82401887732&a=983964944
Attachments
robo
TSP Legend
- Reaction score
- 471
robo
TSP Legend
- Reaction score
- 471
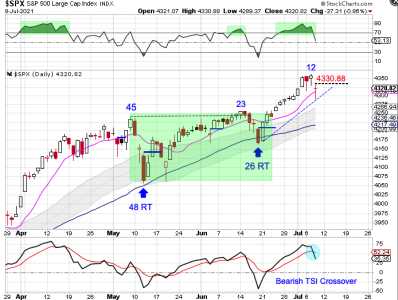
Stocks formed a daily swing high on Thursday.
Stocks did get a bit stretched above the 10 day MA on day 12. Thursday's swing high allowed the 10 day MA to catch up to price. Stocks have been in a daily uptrend that has been characterized by highs forming above the upper daily cycle band and lows forming above the lower daily cycle band. If stocks form a swing low above the lower daily cycle band then stocks will remain in their daily uptrend and trigger a cycle band buy signal. A break above 4330.88 will form a daily swing low.
https://likesmoneycycletrading.wordpress.com/2021/07/08/stops-triggered-still-bullish/
Attachments
robo
TSP Legend
- Reaction score
- 471
joblin,
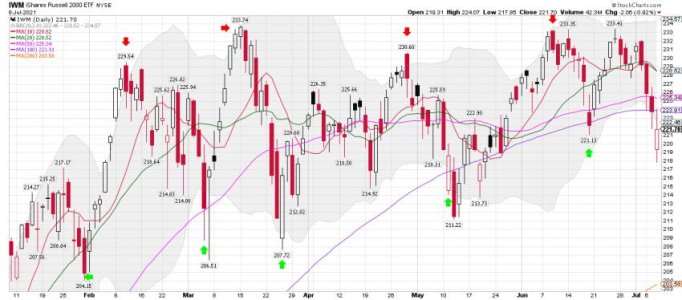
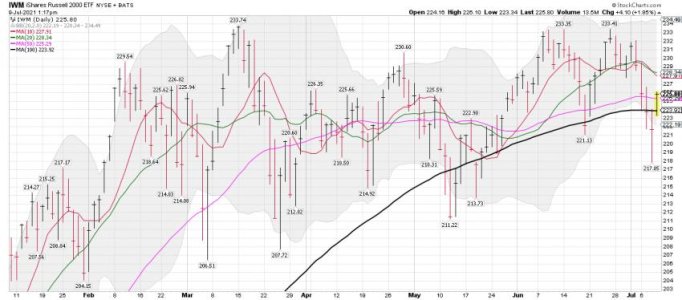
IWM daily: What index do I use to determine my buy and sell signals? It's important as many stock market indexes lead or lag the S&P 500. The SPY/SPX is the standard for most.
Look at this IWM chart. If you are using the moving averages for trading we have been on a sell signal for small caps. IWM is below the 10,20,50, and 100 dma. However, look at VXF ( S fund) and the SPY (C Fund). VXF is on a sell signal using my system and the SPY is on a hold long position based on the rules I'm using for trading.
Attachments
robo
TSP Legend
- Reaction score
- 471
Continuation:
joblin,
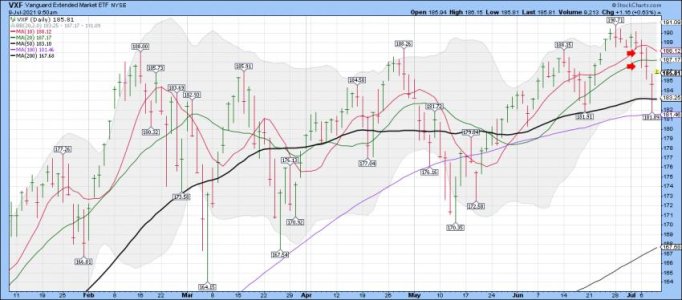
VXF daily: VXF is an index fund at Vanguard that is very close to the S Fund. I have said for many years to always have a ROTH IRA at Vanguard in a trading account. No Taxes, low costs overall, and we now have free trades, with unlimited moves - if your funds have cleared. It looks like we are going to a one day clearing system soon. We went from 3 days to 2 days and now we are headed to 1 day. You can also move your funds anytime during the trading day. So in my opinion, I like Vanguard over the TSP for trading, but the G fund is great for those that don't want to be in the stock market. This is not advice. I'm just telling you what I do since you asked me. Don't get me wrong, the TSP is great, but you should be putting the MAX in a ROTH IRA at Vanguard in my opinion. For couples that's a nice chunk of money every year. The rest goes into the TSP matching. Again, this is what I did and might not be right for you. I'm telling you this because you asked me about my trading system, and I COULD NOT use it all the time if all my funds were in a TSP account. Still, there are some here that do very well using limited moves and control risk/reward and Risk Management very well.
VXF is on a sell signal: It is below the 10, and 20 dma, but did find support at the 50 dma. I could talk about the MACD, RSI, TSI etc, but the bottom line for me is the MA's. I keep my trading system very simple and only use a few indicators. (The KISS system) There are much better systems, but this is what I use. I track insiders, fund flows, sentiment, and some other indicators, but the final trades come down to the ma's and which way the index I'm trading is trending.
For the record: I have tried and looked over MANY trading systems over the years, and what Tom and others do here are as good or better then most in my opinion. The Key to any trading system is following the rules of your system and taking the signals ( buy or sell) when they come. Sure, you will get whipsawed or wrong sometimes, but that is the nature of the markets. It is driven by fear and greed and is no more then a casino these days. My current trading is based on the current type of market we are in ( A trending market) and doesn't always work well in markets that is not trending well.
I'll post this in short comments until I have answered your question. I'm leading up to it.
Attachments
Last edited:
robo
TSP Legend
- Reaction score
- 471
Ok, I believe I have a better understanding now. I sure appreciate you input.
Bottom Line: I trade what is happening, and not what I think will happen. I never try and pick tops or bottoms, or try and guess what the market will do next. I currently just trade the trend using the MA's and I use cycle data for Risk Management. That could change down the road based on how this market changes in the years ahead.
Take Care and have a nice weekend!
robo
TSP Legend
- Reaction score
- 471
Does it matter? ( read tweets below) Only if you are using Risk Management..... This is a time to stay nimble in my opinion based on how deep we are into the yearly cycle.
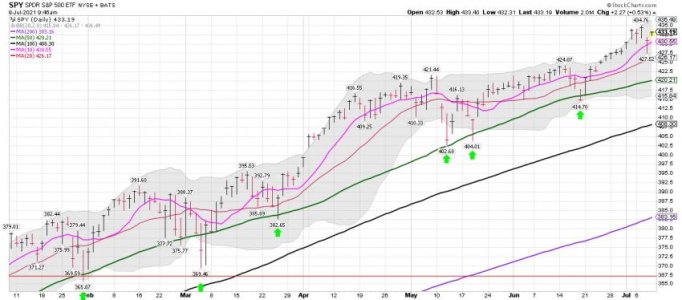
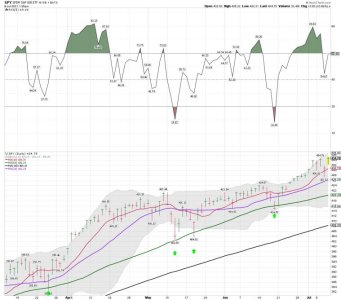
Bottom Line: The SPY remains above the 10, 20, 50, 100 and 200 dma's. ( Hold long positions at a reduced position size if you are using Risk Management C Fund.)
The trend remains up for this index, but small caps COULD be telling us something.
SevenSentinels
@SevenSentinels
13m
Appears to Be A Hindenburg Omen on NASDAQ and very Close To HO on NYSE
SevenSentinels Retweeted
Helene Meisler
@hmeisler
·
16h
First day with more new lows than highs for Naz in almost two months.
SevenSentinels Retweeted
xTrends
@xtrends
·
12h
Largest daily moves and market crashes usually occur when McClellan oscillators are very oversold (internally collapsed markets)
Attachments
robo
TSP Legend
- Reaction score
- 471
VXF daily: Remains on a sell signal based on my trading system, but is trying to come back (BTDer's in play) We shall see how we close. VXF COULD go right back to a buy signal. (That would be a whipsaw and some would call it a shakeout of the weak hands.) That always makes me laugh. The BOTS do produce these patterns to get traders to sell just before going higher, or buy just before going lower. Lots of TA dudes are using the same ma's I'm using. However, I follow what I see happening not what I think will happen.
Bottom Line: VXF Remains below the 10, 20 dma, but made a nice bounce (found support as buyers came in) at the 50 and 100 dma. I will remain flat using VXF as I wait to see if it can recover. I use the daily closing price, but often trade ST during the trading day. VXF is making a nice move up for sure because you always go long for Friday's and sell after EASY Money money has completed. Well, that has been the pattern with a high win rate for sometime now.
https://stockcharts.com/h-sc/ui?s=VXF&p=D&yr=0&mn=6&dy=0&id=p15087995488&a=988616594
Attachments
Last edited:
robo
TSP Legend
- Reaction score
- 471
The bears are saying - oh ****, Not again! The Bulls are saying - I told you so. That is why I don’t guess.
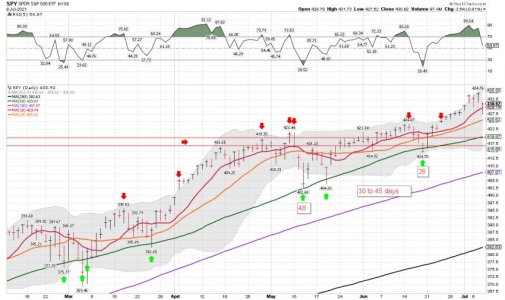
SPY daily: Remains in a uptrend, and we shall see if VXF can recover and generate another buy signal. Looking good so far.... I post my data charts after the close.
Good trading and the BTD remains an excellent trading strategy for the SPY/SPX. Well, until it’s not. I would make a guess for you, but I don’t trade using only opinions. There are indicators that tell me a 10% long position is all I want in a market like this one. I normally keep all my trades under 10% unless we are coming out of an extreme and just starting a new cycle. The yearly cycle low is coming, but I sure don’t know when. Will it be a Bear Market? Lol..... That depends on whom you ask.
I say stay nimble!
Last edited:
robo
TSP Legend
- Reaction score
- 471
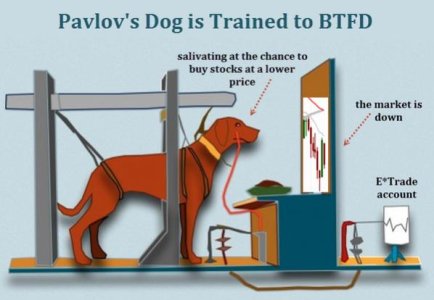
BTFD: LOL.... we shall see! See tweet below..... A very good trader I follow on twitter.
IWM daily: Are you trading IWM? I still have it on a sell signal, but back above the 100, and 50 dma..... The 20 and 10 dma be up next! Some nice swings trades lately for those that are (ST) short-term trading. I'm just watching the whipsaws!
https://stockcharts.com/h-sc/ui?s=IWM&p=D&yr=0&mn=6&dy=0&id=p79440434224&a=988734483
thomas
@VolumeDynamics
1h
BTFD Training is now complete... The next big pullback literally everyone is going to throw in the towel and go long...
https://twitter.com/VolumeDynamics
Attachments
robo
TSP Legend
- Reaction score
- 471
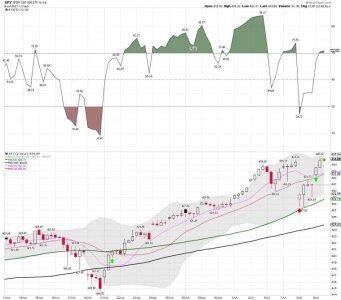
I use the SPY 2 hour chart for short term trading, not the 1 hour: What I see is a continuation of the trend after tagging the 50 dma on the 2 hour. This index has been trending up since the June low. You can see the ma's I'm using. A quick whipsaw and sell signal and right back to the uptrend. The daily never did go to a sell signal.
https://stockcharts.com/h-sc/ui?s=SPY&p=120&yr=0&mn=0&dy=20&id=p50439579383&a=988741151
Many traders got taken out during the gap down on the morning of the 8th. A nice stop run for sure. Easy money for the BOTS.... LOL... this market has nothing to do about investing anymore.
thomas
@VolumeDynamics
42m
Somebody is sitting here today out of the market, looking at all his positions that got liquidated by the brokers the last 2 days return to the values before the liquidation... must be horrible.
https://twitter.com/VolumeDynamics
Attachments
Last edited:

