-
The Forum works well on MOBILE devices without an app: Just go to: https://forum.tsptalk.com
-
Please read our AutoTracker policy on the IFT deadline and remaining active. Thanks!
-
$ - Premium Service Content (Info) | AutoTracker Monthly Winners | Is Gmail et al, Blocking Our emails?
Find us on: Facebook & X | Posting Copyrighted Material
-
Join the TSP Talk AutoTracker: How to Get Started | Login | Main AutoTracker Page
You are using an out of date browser. It may not display this or other websites correctly.
You should upgrade or use an alternative browser.
You should upgrade or use an alternative browser.
Bear Cave 2 (Bull Allowed)
- Thread starter robo
- Start date
robo
TSP Legend
- Reaction score
- 471
Cycle data:
The 7/10/21 Weekend Report Preview
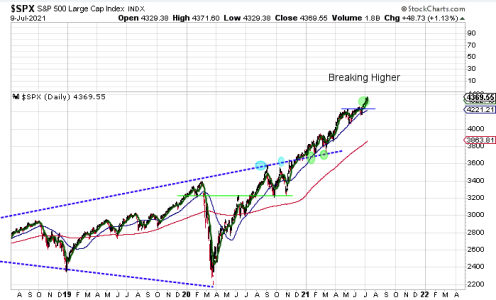
Stocks appear to be entering a melt-up phase.
https://likesmoneycycletrading.wordpress.com/2021/07/10/the-7-10-21-weekend-report-preview/
The 7/10/21 Weekend Report Preview
Stocks appear to be entering a melt-up phase.
https://likesmoneycycletrading.wordpress.com/2021/07/10/the-7-10-21-weekend-report-preview/
Attachments
robo
TSP Legend
- Reaction score
- 471
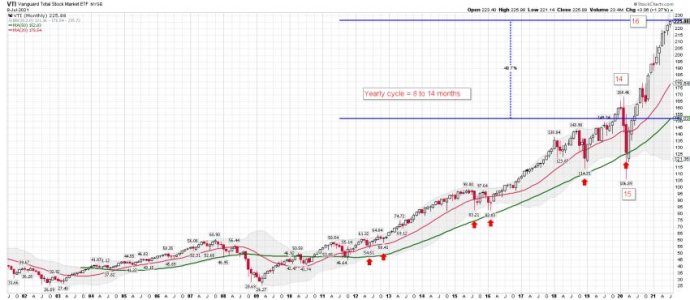
VTI monthly: My monthly chart below of the Total Stock Market at Vanguard. I use it to track the yearly cycle data. We are in month 16. Also, I find the word "starting" a melt-up phase as funny......However, I will continue to trade what is happening and the trend remains up!
Attachments
robo
TSP Legend
- Reaction score
- 471
Not that anyone even cares anymore.....
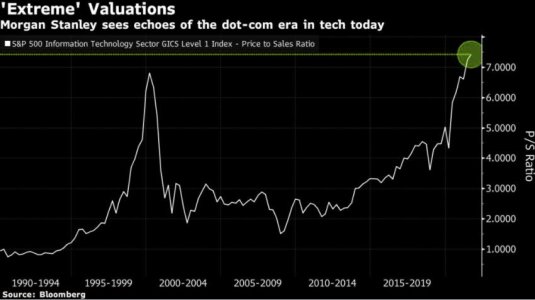
S&P - cheap or expensive?
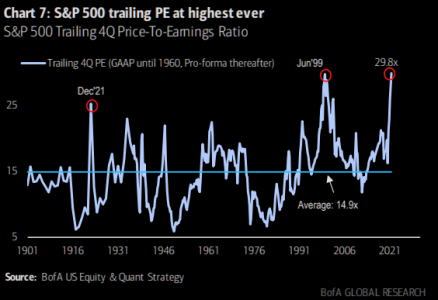
You decide, but S&P500 trailing PE is currently at 30x,m highest in 100 years and the average is around 15x.
Some mean reversion anyone?
We know of very few bears, and even less people short stocks and long bonds. According to BofA Q3 pain trade is SPX sub 4000 led by tech...
Imagine the pain, just in time when people have been forced to chase tech longs during the past month.
https://themarketear.com/
Attachments
robo
TSP Legend
- Reaction score
- 471
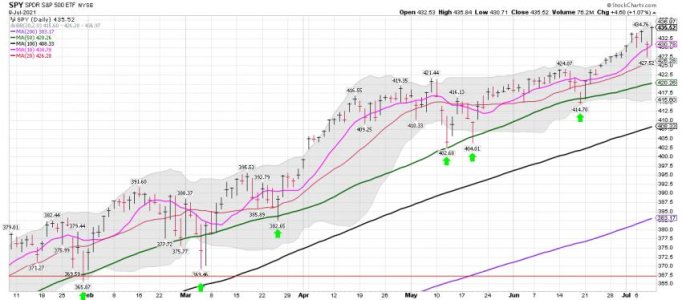
One of the many tools that can help you trade is moving averages. I like to use the KISS system so this is one of the tools I use. The 3 ema and the 9 ema was my preferred choice for ST trading and I still use them for ST trading now. They help me guess at turns or trend changes. Note I said GUESS! Those moving averages are explained in the video below. I went to the 10, 20, 50, and and 200 day moving averages, because the cycle dudes use them.
I very simple video on this subject. There are hundreds of them out there. Understanding how to use them and then trading (buying and selling) in real-time with a 100k is different.
Keep in mind it's Risk Management that keeps me in the game. This market has been easy to trend trade, but that could change in the months ahead. When it does so will I.
How to Use Moving Averages for Stock Trading
https://www.youtube.com/watch?v=r3Ulu0jZCJI
The daily chart below has the 10,20,50,100 and 200 dma's on it. Back test them and see if it would have helped you with your trading. I use the daily closing for MT signals.
Attachments
robo
TSP Legend
- Reaction score
- 471
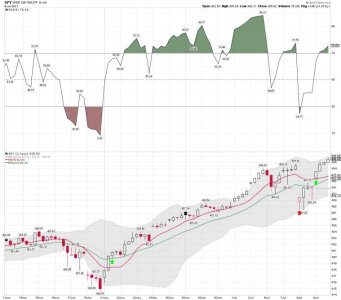
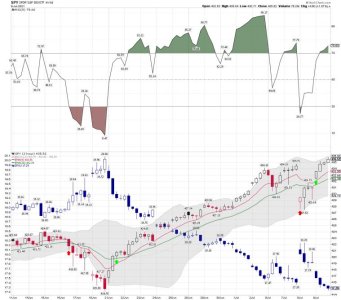
This is what I will be using next week for trading based on the current market conditions and where we are in the current cycle. The 9 ema and the 20 ema on the 2 hour chart. Back test it yourself and see where you would ST trade ( buy and sell signals). I use a mix of ma's and so should you based on what type of trading you are doing. Some investors use the weekly charts, and trade the MT trends. I will post one after the 2 hour chart I will be using next week.
A sell on the 2 hour chart does "NOT" always mean a sell on the daily. But I could be trading a small position using leverage on the 2 hour and I use the closing price on the daily for MT trading. Again, I have my own system and this data is used differently by traders, and some don't use it at all.
A sell on the 2 hour chart does "NOT" always mean a sell on the daily. But I could be trading a small position using leverage on the 2 hour and I use the closing price on the daily for MT trading. Again, I have my own system and this data is used differently by traders, and some don't use it at all.
Attachments
robo
TSP Legend
- Reaction score
- 471
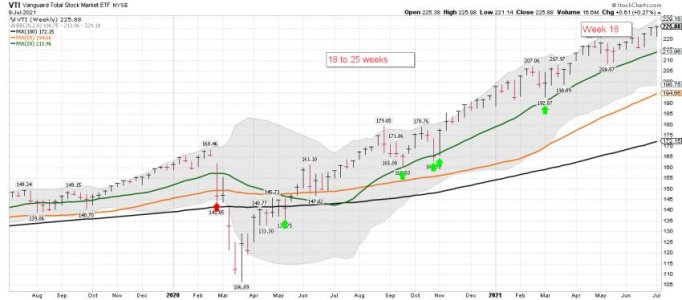
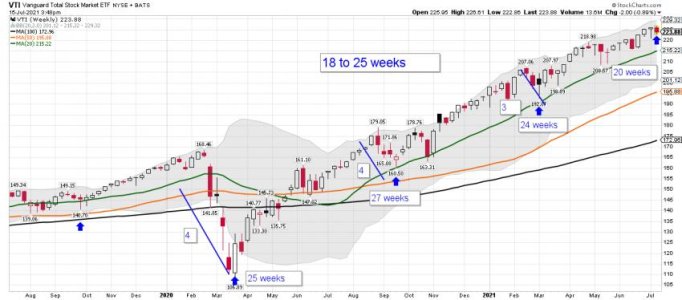
VTI weekly: If you are using the weekly and the 20 wma you have done well this run. However, this late in the cycle my system takes profits on the MT position. Just because I'm long on the weekly doesn't mean I'm not short on the 2 hour chart trading other sectors. Back test it for yourself.... I use the daily or less for trading, and the weekly and monthly to help me keep track of where we are in the current cycle. My system would NEVER be all in this late in the weekly cycle. The easy money is coming out of a cycle low.
How many sell signals do you see on the weekly chart? If you are trend trading using the 20 wma none since the first buy signal. I'm using the closing weekly price? Count them and back test them for yourself. However, it's not always this easy!
Anyway, I was asked about my signals and this covers some of the tools I use for trend trading. I will post some import rules I use some other time, and YES I lose money and get whipsawed. However, the idea is to catch major trend moving up and miss them moving down. The goal is to gain 80% of a new MT cycle, and miss part of MT or YCL's.
I use some different tools coming out of an extreme or a cycle low for my buy signals, and will scale in when adding.
Attachments
Last edited:
robo
TSP Legend
- Reaction score
- 471
Trend Trading: I have posted this link before. Risk Management comes in when "YOU" must determine how much of your account do you use on any single trade based on a buy signal.
Weekly Report from the Fibtimer Stock Market Timing Services
Aiming For The Moon!
Trend traders do not try to catch exact tops. Nor do we try to catch exact bottoms.
We do not believe that anyone can.
Of course with hundreds of different opinions available at any time, someone will always be lucky and call an exact bottom or top. The financial news media is quick to go with the hype.
But try and do it over and over and over.
So how do trend traders know when a trend and begun?
The answer is... "after" it has started. Using prices, which are the only measurement of the markets that can "always" be depended upon, we can create specific trading rules that define when we are in a trend.
We could say that if the market rises a specific percent from a low, that we are in an up trend. At that point, we can take a long, bullish position.
"as trend timers we aim for the moon. If a trend goes 200% we want to be on board it from our entry point, right to the 200% point. We want it all."But when do we exit? Do we exit after we have a 10% return? Or maybe set a goal of 20% and cross our fingers?
No... as trend timers we aim for the moon. If a trend goes 200% we want to be on board it from our entry point, right to the 200% point. We want it all.
But, then how do we know when to exit? The answer is simple...
Going For The Home Run
We exit "after" the trend has ended, and not until then. That means we stay until "after" the trend reverses.
When we start the trade, we go in looking for a home run. The sky is the limit.
We do not exit the trade until the market reverses and "prices" have moved far enough in the "opposite" direction to tell us a "new" trend has likely started.
That means we usually don't get in an exact bottom. It also means we usually don't get out at an exact top. It means that sometimes we take small losses when our requirement is met for a new trend, if the trend fails (and they do... remember the 20% of the time when the markets are NOT in a trend).
But most importantly, it means we "never miss" any substantial trends, and we ride every trend as far as it will take us! All identified trends are traded. All of them.
This is where market timers make their big profits. They do go through occasional boring sideways markets, but when the market does trend, they are "always" on board for the majority of that trend.
By always going for the home run, trend traders, like baseball players, may have some strike outs (small losses). But those strike outs are obliterated by the home runs which we ride for all they are worth.
https://www.fibtimer.com/subscribers_historical_reports/210704_fibtimer_commentary.asp
Last edited:
robo
TSP Legend
- Reaction score
- 471
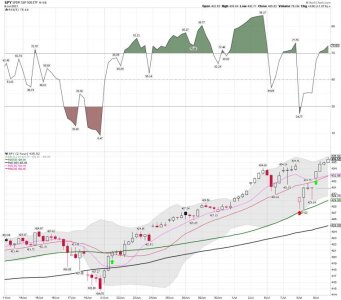
SPY 2 hour chart: Starting out the day/week from another ATH.
I will be using the 2 hour chart this week for trading.
https://stockcharts.com/h-sc/ui?s=SPY&p=120&yr=0&mn=0&dy=20&id=p22444349275&a=990042593
I will be using the 2 hour chart this week for trading.
https://stockcharts.com/h-sc/ui?s=SPY&p=120&yr=0&mn=0&dy=20&id=p22444349275&a=990042593
Attachments
robo
TSP Legend
- Reaction score
- 471
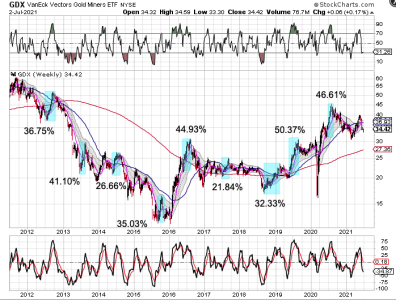
GDX: The chart below is a look at the last 9 years for the Miners. If history repeats it might be time to buy some shares..... Don't forget that today is easy money Monday! Watching to see how it plays out and I will be doing some ST trading only.
Highlighted are the rallies that began during the summer months (late May through early September).
https://likesmoneycycletrading.wordpress.com/2021/07/05/miner-expectations-3/
Highlighted are the rallies that began during the summer months (late May through early September).
https://likesmoneycycletrading.wordpress.com/2021/07/05/miner-expectations-3/
Attachments
Last edited:
robo
TSP Legend
- Reaction score
- 471
Attachments
robo
TSP Legend
- Reaction score
- 471
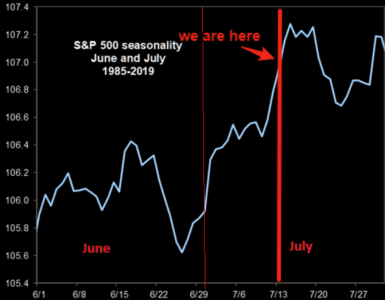
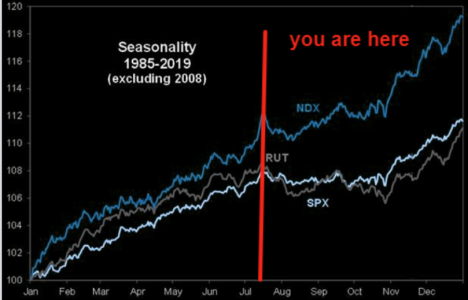
Seasonality: I track it and look it over with other Risk Management data, but don't use it for trading.
Bottom line: The trend remains up!
The two charts that matter
So far the seasonality has played out very well. We are in the late stage of the squeeze according to the seasonality chart and things should be fading soon.
You are here...but have you planned the next phase?
https://themarketear.com/
Bottom line: The trend remains up!
The two charts that matter
So far the seasonality has played out very well. We are in the late stage of the squeeze according to the seasonality chart and things should be fading soon.
You are here...but have you planned the next phase?
https://themarketear.com/
Attachments
robo
TSP Legend
- Reaction score
- 471
What Triggered the Crash?
Print Friendly, PDF & Email
John P. Hussman, Ph.D.
President, Hussman Investment Trust
July 2021
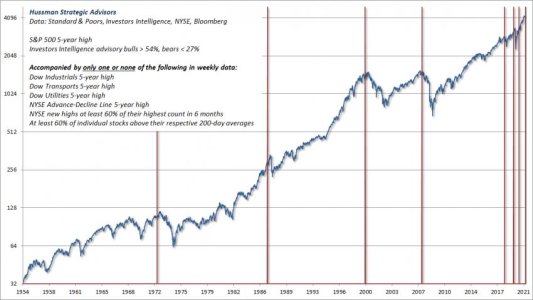
Our primary gauge of market internals is unfavorable here, but emerging divergences are also becoming evident in far more conventional gauges such as the Dow indices, leadership (new highs vs. new lows), breadth (advances vs. declines) and participation (the share of individual stocks joining a given market movement).
The chart below shows one of numerous syndromes we track, illustrating the sort of divergence we’re observing here. The latest instance of this particular set of conditions was in late-June. Before assuming that the most recent instances have been non-events, notice that the chart is on log scale. The late-2018 instance was followed by a market loss of nearly 20%. The 2020 instance was followed by a market decline of about 35%, and even the instance in September 2020 was immediately followed by a correction of nearly 10%. That said, this chart is intended as an illustration of current divergences, not as a “prediction.” Our discipline is to align our investment outlook with observable conditions (primarily valuations and internals) at each point in time. No forecasts are necessary.
https://www.hussmanfunds.com/comment/mc210715/
Attachments
robo
TSP Legend
- Reaction score
- 471
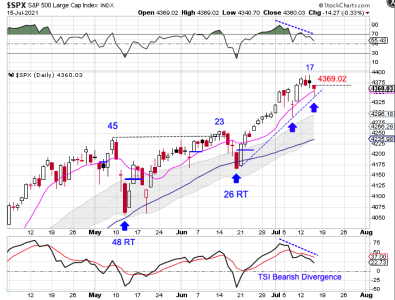
SPX daily cycle: Stocks formed a swing high on Thursday.
The intermediate equity cycle is normally comprised of 2 – 3 daily cycles. Stocks are currently on their 3rd daily cycle. So we need to be alert to the swing high potentially sending stocks into a daily cycle decline. However stocks have been in a daily uptrend characterized by highs forming above the upper daily cycle and — since the June DCL — lows forming above the the upper daily cycle band. Stocks formed a bullish reversal off the tend line support on Thursday. If stocks form a swing low, that will indicate a continuation of the daily uptrend and trigger a cycle band buy signal. A break above 4369.02 will form a daily swing low.
https://likesmoneycycletrading.wordpress.com/2021/07/15/trend-line-support/
Attachments
robo
TSP Legend
- Reaction score
- 471
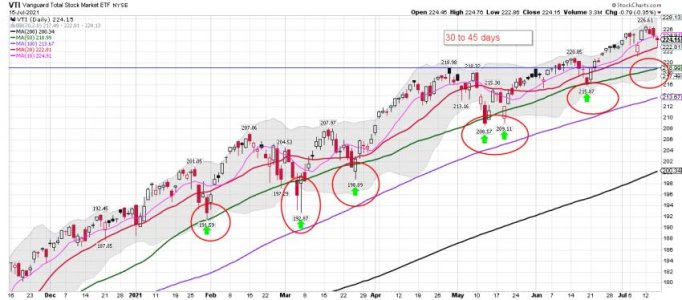
VTI daily: The daily pattern has been for pullbacks to tag the 50 dma or a lower BB tag. After that VTI has continued its move higher. Next week should be interesting as the BTD crowd continues to buy. And why not? It continues to work..... However, a few additional headwinds next week. We shall see how it plays out!
Attachments
robo
TSP Legend
- Reaction score
- 471
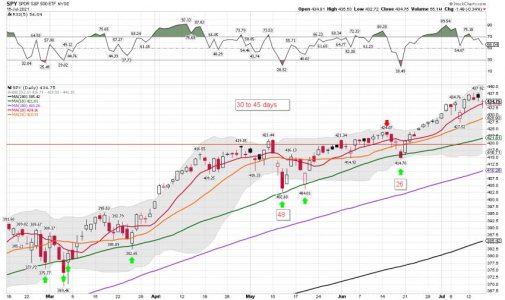
SPY daily: Not much to say as the trend remains up. We "COULD" see some increased selling pressure next week, but for now the trend remains up.
Bottom Line: Trending up nicely above the 10 dma and the 20 dma. LOL..... The BTD continues for some indexes, but not all!
Bottom Line: Trending up nicely above the 10 dma and the 20 dma. LOL..... The BTD continues for some indexes, but not all!
Attachments
robo
TSP Legend
- Reaction score
- 471
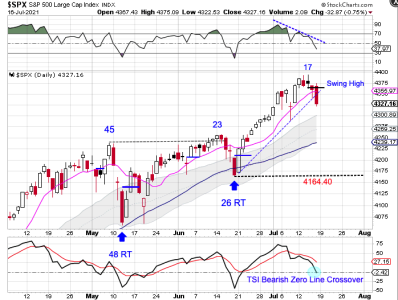
SPX daily cycle: Stocks Deliver Bearish Follow Through
Stocks formed a swing high on Thursday then delivered bearish follow through on Friday.
Fridays’ bearish follow through closed below both the 10 day MA and the daily cycle trend line to indicate the daily cycle decline. A peak on day 17 could still result in a left translated daily cycle formation. And with stocks on week 19, this could result in an intermediate cycle decline. Typically we see a failed daily cycle in an intermediate cycle decline. A break below 4164.40 will form a failed daily cycle. Stocks are currently in a daily uptrend. They will remain so, unless they close below the lower daily cycle band.
https://likesmoneycycletrading.wordpress.com/2021/07/17/stocks-deliver-bearish-follow-through-3/

