Bear Cave 2 (Bull Allowed)

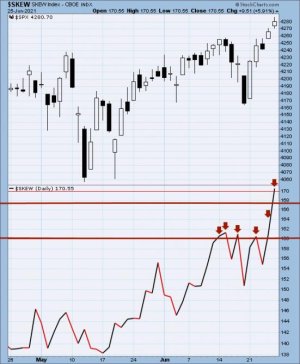
His point is the record we are hitting (a extreme of 170.55), but the market just doesn't seem to care right now.

SevenSentinels
@SevenSentinels

12h
SKEW Closed Today (Friday) at an inconceivable 170.55.

We'll explain the significance of this over the weekend.

Hint: It ain't bullish!

https://twitter.com/SevenSentinels?ref_src=twsrc^google|twcamp^serp|twgr^author

$SKEW = Uses options pricing of the S&P 500 to determine investor sentiment and short-term volatility, by assessing tail risk (the risk of future prices being 2 or more standard deviations below the current price). Calculations are based on a 1-month period. Values typically range between 100 and 150, with 100 indicating lower risk/volatility.
 

Attachments

  • a.jpg
    a.jpg
    54.1 KB · Views: 87
People just can't get enough of their call buying. Guy I work with was telling me all the long shot bets he has pending on usual suspects and a few biotech companies nobody has ever heard of. He only puts up some $300-$400 a "bet", but if it doesn't pan out it's a total loss. He said he was up something like 5,000% in GME but held instead of selling the open and watched his gains almost completely evaporate. I think this ending is more common than someone exiting with massive gains, but the fact that they only need to put up a couple hundred bucks to make life changing money is compelling for some. I'm glad I'm not in a situation where my future depends on outsize risk.
 
People just can't get enough of their call buying. Guy I work with was telling me all the long shot bets he has pending on usual suspects and a few biotech companies nobody has ever heard of. He only puts up some $300-$400 a "bet", but if it doesn't pan out it's a total loss. He said he was up something like 5,000% in GME but held instead of selling the open and watched his gains almost completely evaporate. I think this ending is more common than someone exiting with massive gains, but the fact that they only need to put up a couple hundred bucks to make life changing money is compelling for some. I'm glad I'm not in a situation where my future depends on outsize risk.

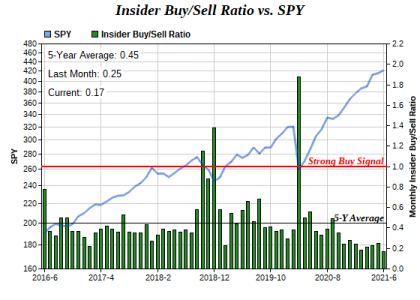
LOL..... Amazing how much impact these traders are having on the market. All I can say is the insiders continue to sell shares to retail investors, and insiders are using Buy Backs to increase share prices. They are using company money. So they are selling their shares while doing a buy back with company money. They should stop ALL this buy back crap. Amazing.....

"Just as we had elevated buy-to-sell insider behavior at all important buying points in recent years, we just set a new record for the total U.S. dollar value of insider selling relative to insider buying:"
 

Attachments

  • a.png
    a.png
    27.1 KB · Views: 82
Technically Speaking: Slowly At First, Then All At Once
Written by Lance Roberts | Jun 15, 2021

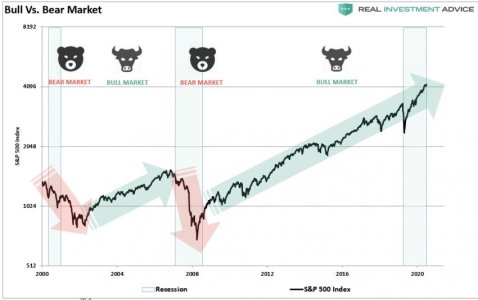
Defining Bull & Bear Markets
So, what defines a “bull” versus a “bear” market.

Let’s start by looking at the S&P 500.

Bull and bear markets are evident with the benefit of hindsight.

The problem, for individuals, always comes back to “psychology” concerning our investing practices. During rising or “bullish,” markets, the psychology of “greed” keeps individuals invested longer and entices them into taking on substantially more risk than realized. “Bearish,” or declining, markets do precisely the opposite as “fear” overtakes the investment process.

Most importantly, it is difficult to know “when” the markets have changed from bullish to bearish. Over the last decade, several significant corrections have certainly looked like the beginning of turning from a “bull” to a “bear” market. Yet, after a short-term corrective process, the upward trend of the market resumed.

So, while it is evident that missing a bear market is incredibly important to long-term investing success, it is impossible to know when the markets have changed.

Or is it?

Conclusion
Understanding that change is occurring is what is essential. But, unfortunately, the reason investors “get trapped” in bear markets is that when they realize what is happening, it is far too late to do anything about it.

Bull markets are lure investors into believing “this time is different.” When the topping process begins, that slow, arduous affair gets met with continued reasons why the “bull market will continue.” The problem comes when it eventually doesn’t. As noted, “bear markets” are swift and brutal attacks on investor capital.
https://realinvestmentadvice.com/technically-speaking-slowly-at-first-then-all-at-once/
 

Attachments

  • a.jpg
    a.jpg
    40.2 KB · Views: 89
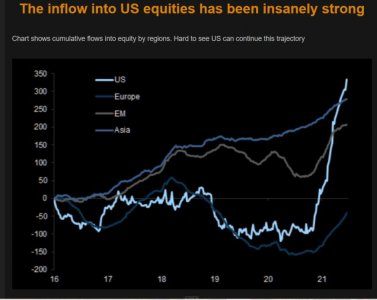
Never ever forget who rules markets
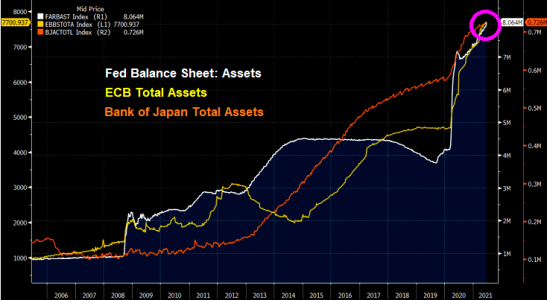
Never bet against the mighty central banks. As we reminded you of on Friday, CBs have bought some $900mn worth of financial assets every hour over the past 15 motnhs.

Nothing new, but worth a reminder...
https://themarketear.com/
 

Attachments

  • a.png
    a.png
    79.6 KB · Views: 84
This Led to Declines Every Time in the Past 93 Years
2021-06-28 | Jason Goepfert | Lite
There is some weird stuff happening under the surface of the market.

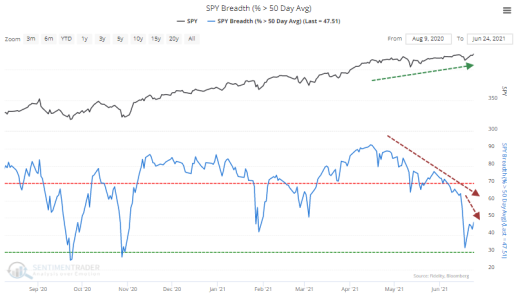
Early last week, the percentage of S&P 500 members above their 50-day moving averages had plunged, even while the majority were still above their 200-day averages. That has tended to be a good sign.

But...

The problem is what's happened in recent sessions. Despite a push to new highs in the S&P toward the end of the week, the percentage of its members above their averages
barely budged. In terms of divergences, this one is gonzo.


Going back to the mid-1920's, there have only been a handful of dates with breaks like this. It happened in 1929, 1959, 1963, 1972, 1998, and 1999, and all of them ended up preceding losses in stocks.

Several more days (or weeks) with this kind of behavior should trigger all kinds of risk warnings, the types of things we've been watching for since speculation reached its heights in February.
https://www.sentimentrader.com/blog/this-led-to-declines-every-time-in-the-past-93-years/
 

Attachments

  • a.png
    a.png
    56.9 KB · Views: 81
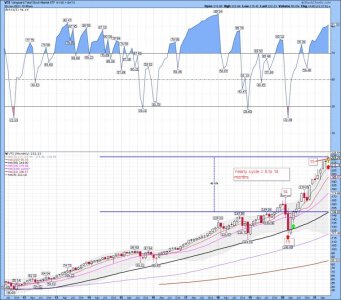
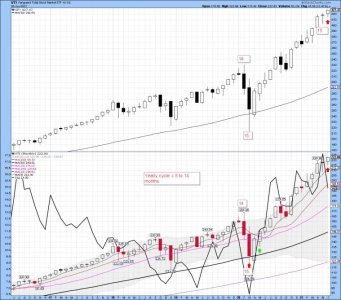
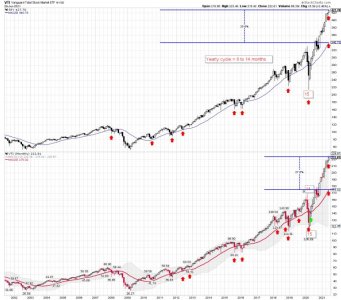
Yearly cycle: It continues higher, and we are on month 15. However, it be stretched above the mean 50 mma. (50 month moving average)

Stocks are getting very close to their timing band for a yearly cycle decline. A left translated daily cycle, could start a move into the YCL. So keep an eye on the current daily cycle and be careful about BTFD this late in the yearly cycle. We could move down much closer to the mean during the next pullback. This can be seen on any long term tracking chart.

Stay nimble and don't chase this move based on the Risk Management data.

Bottom Line: The trend remains up, but one should have reduced MT position sizes.
 

Attachments

  • a.jpg
    a.jpg
    89.4 KB · Views: 90
Ok, another easy money Monday is over..... I will post some charts later once I look over after hours trading.

Bottom line: The trend remains up!
 
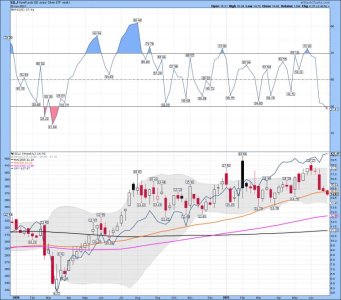
SILJ weekly: Watching..... Will SPY and SILJ bottom together again.....
 

Attachments

  • a.jpg
    a.jpg
    79 KB · Views: 89
VTI/SPY/SILJ monthly: Waiting on the next yearly cycle low.....
 

Attachments

  • a.jpg
    a.jpg
    91.6 KB · Views: 89
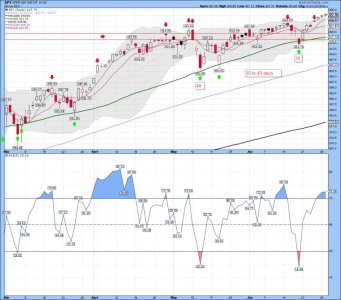
SPY daily: Is the end of the month buying now in play? The BTD ( Buy The Dip) sure remains in play.

Bottom Line: The trend remains up!
 

Attachments

  • a.jpg
    a.jpg
    81.5 KB · Views: 77
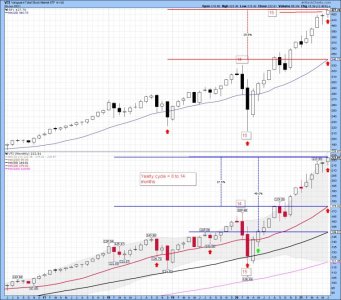
SPY/VTI monthly: Above average odds these two indexes tag the 20 mma during the next YCL. Red line for VTI..... VTI and SPY remain stretched above their 20 month ma. The Buy the dippers should get a scare during the next YCL. Especially the new ones that just started trading this year with the free money they received. Some needed it badly and others didn't. So they have been trading with the MO MO crowd. Note the historical data that these indexes stay a tad closer to the 20 mma. I will another chart with only the 20 mma.
 

Attachments

  • a.jpg
    a.jpg
    90.4 KB · Views: 81
Last edited:
VTI/SPY 10 year chart and the 20 mma. Remains a tad stretched and the YCL be getting closer. LOL..... unless it's different this time..... maybe it will be, but I'm sure not going to have a large stock position this late in the monthly cycle.
 

Attachments

  • a.jpg
    a.jpg
    81.8 KB · Views: 80
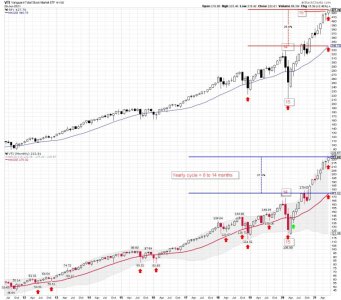
VTI/SPY monthly: A 20 year chart and the 20 month moving average. When will it move back closer to the mean? LOL.... For me it's all about risk management. How big is your stock position this late in the yearly cycle? For me NO MORE then 10%. I like to buy big at cycle lows and reduce on the way up..... LOL.... yes I'm sometimes early, but during a Bull Market that is ok. During a Bear Market it's very bad!
 

Attachments

  • a.jpg
    a.jpg
    83.6 KB · Views: 80
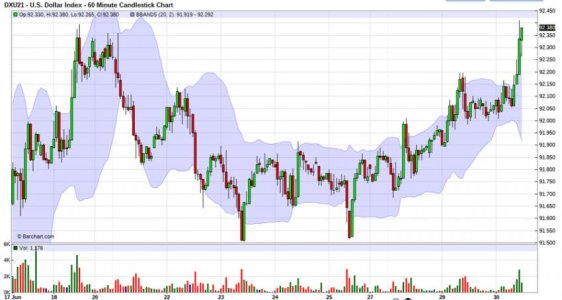
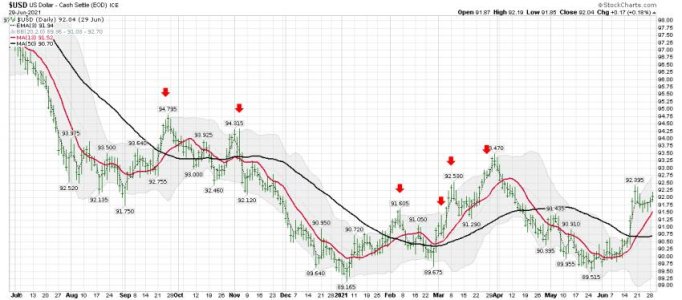
UUP daily: Let's see where it take us next.....

thomas
@VolumeDynamics

1h
$DX BREAKOUT - 92.42
 

Attachments

  • a.jpg
    a.jpg
    59 KB · Views: 71
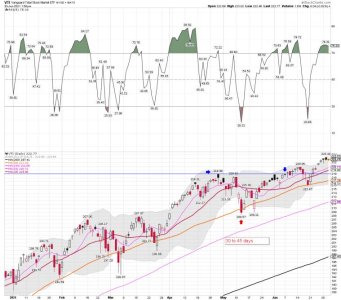
VTI daily: Yes SIR! Starting to look tired again..... Not that buyers care..... just - (BTD) I be holding, not chasing, and watching the show. VTI be trending above the 10 and 20 dma which keeps my system on a hold long positions. In my opinion one should stay nimble here. For me - that means currently holding a smaller position, and be cautious about adding shares (BTD) to early on the next pullback. I'm using a mechanical trading system and opinions are not used. However, I use Risk Management data and that sometimes keeps me holding a much smaller position based on the Risk Reward setup. I'm almost 70 now and my RISK TAKING, is much lower these days. We have to be early in a daily, weekly, monthly, yearly cycle for me to place a big bet. Some call it investing, but we are trading in VEGAS right now in my opinion, but without the free drinks!

https://stockcharts.com/h-sc/ui?s=VTI&p=D&yr=0&mn=6&dy=0&id=p69524672549&a=958898803
Bottom Line: The trend remains up, and my system remains on a hold long positions. Above the 10 and 20 dma and still early in the daily cycle. Still, we be looking weak!

SevenSentinels
@SevenSentinels
·
8m
1:45

Persistent Buyers Hold The Line

https://twitter.com/SevenSentinels?ref_src=twsrc^google|twcamp^serp|twgr^author
 

Attachments

  • a.jpg
    a.jpg
    79 KB · Views: 82
Last edited:
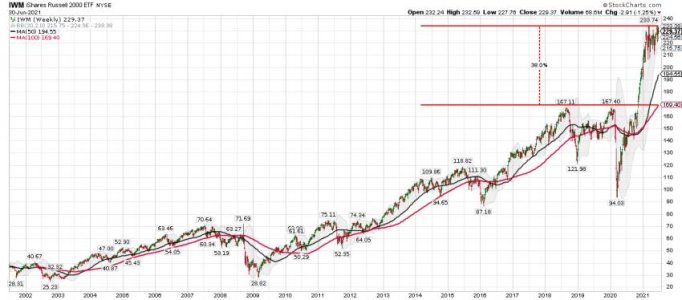
IWM weekly: If you use the 100 wma as a mean, what do you think about this data? A tad above the 100 wma one would think. LOL...not that most of these new traders/investors even care about the mean on a weekly chart....
 

Attachments

  • s.jpg
    s.jpg
    52.8 KB · Views: 77
Back
Top