-
The Forum works well on MOBILE devices without an app: Just go to: https://forum.tsptalk.com
-
Please read our AutoTracker policy on the IFT deadline and remaining active. Thanks!
-
$ - Premium Service Content (Info) | AutoTracker Monthly Winners | Is Gmail et al, Blocking Our emails?
Find us on: Facebook & X | Posting Copyrighted Material
-
Join the TSP Talk AutoTracker: How to Get Started | Login | Main AutoTracker Page
You are using an out of date browser. It may not display this or other websites correctly.
You should upgrade or use an alternative browser.
You should upgrade or use an alternative browser.
Bear Cave 2 (Bull Allowed)
- Thread starter robo
- Start date
robo
TSP Legend
- Reaction score
- 471
Gotcha, thank you so much. I have been learning daily, there is so much information to try and understand.
No Problem, and good luck. Always remember - cash is a position ( G fund) and you don't always have to be fully invested or chasing moves....
robo
TSP Legend
- Reaction score
- 471
Some Tweets: From a few I track daily
3 PM
Negative Breadth Rally
https://twitter.com/SevenSentinels?ref_src=twsrc^google|twcamp^serp|twgr^author
27m
"Now we've been telling you for a few weeks about this RUSSELL REBALANCE and CYCLE HIGHS due at the end of the month... our assessment...that these stocks would continue to at least "hold up" and could actually surprise a VERY DIVERGENT market by soaring to new ALL TIME HIGHS.."
Well, it might interest you to know that we forecast NEW ALL TIME HIGHS for this week in the $NASDAQ and select other indices... I can walk and chew gum.
https://twitter.com/VolumeDynamics
1h
The S&P 500 Info Tech sector is on track for a record close today.
Fewer than 50% of its members are above their 10-day moving averages. Fewer than 60% are above their 50-day averages [per Bloomberg].
This has happened on 2 other days in 32 years: Oct 26 and 29, 2007.
https://twitter.com/jessefelder
24m
Since the Fed meeting Powell had one job: Avoid a taper tantrum, minimize any market downside & assure markets there won't be any change to the Fed's QE program and/or rate hike expectations.
And he succeeded.
Markets bought it hook, line and sinker.
For now.
https://twitter.com/NorthmanTrader
Tom McClellan
@McClellanOsc
5m
About to join
@CNBCClosingBell
to talk about the dip just behind us and the rally ahead for the stock market.
The chart is from Bob:
Bob Loukas
@BobLoukas
1h
Pretty strong bounce back for #stocks. I'm looking for a rejection in this area.
$SPY $QQQ
Attachments
Last edited:
robo
TSP Legend
- Reaction score
- 471
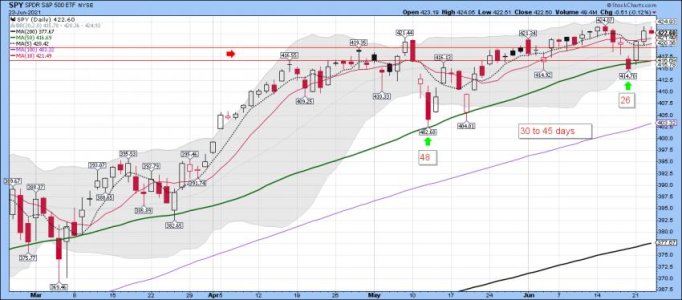
Daily cycle: Looks like the start of a new daily cycle......
Bullish Response
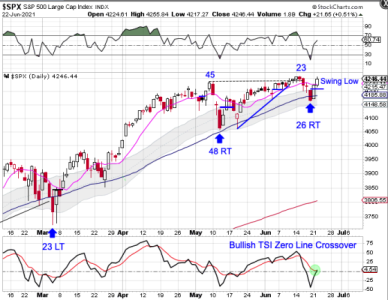
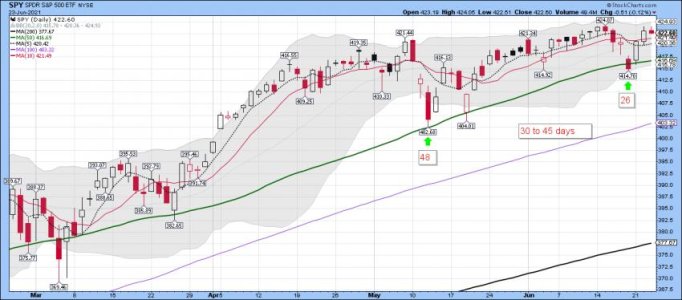
Stocks formed a swing low on Monday to signal a new daily cycle.
Stocks responded bullishly on Tuesday by closing above the 10 day MA so we will label day 26 as the DCL.
https://likesmoneycycletrading.wordpress.com/2021/06/22/bullish-response/
Bullish Response
Stocks formed a swing low on Monday to signal a new daily cycle.
Stocks responded bullishly on Tuesday by closing above the 10 day MA so we will label day 26 as the DCL.
https://likesmoneycycletrading.wordpress.com/2021/06/22/bullish-response/
Attachments
robo
TSP Legend
- Reaction score
- 471
robo
TSP Legend
- Reaction score
- 471
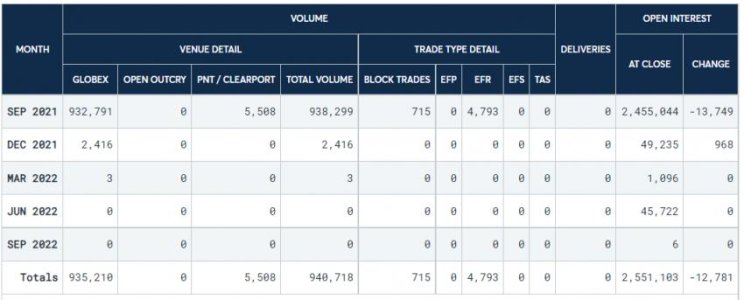
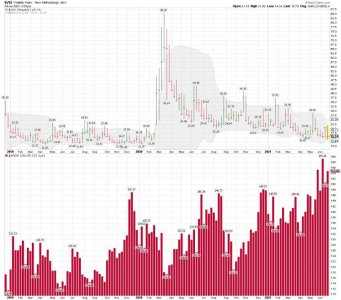
LIQUIDITY: Keeping my eye on this..... When the LIQUIDITY drys up the music stops so be ready to grab a chair quickly. However, whats not to like as we continue to move higher..... Thses runs are amazing....
thomas
@VolumeDynamics
$ES Futures Open Interest continues to dry up...
https://twitter.com/VolumeDynamics/status/1408038042984538115/photo/1
thomas
@VolumeDynamics
$ES Futures Open Interest continues to dry up...
https://twitter.com/VolumeDynamics/status/1408038042984538115/photo/1
Attachments
Last edited:
It is so tempting to jump in right now, FOMO maybe, or the continuation of the bull marketLIQUIDITY: Keeping my eye on this..... When the LIQUIDITY drys up the music stops so be ready to grab a chair quickly. However, whats not to like as we continue to move higher..... This runs are amazing....
thomas
@VolumeDynamics
$ES Futures Open Interest continues to dry up...
https://twitter.com/VolumeDynamics/status/1408038042984538115/photo/1
robo
TSP Legend
- Reaction score
- 471
It is so tempting to jump in right now, FOMO maybe, or the continuation of the bull market
I agree about the FOMO. I'm mainly in cash right now and just watching the show. The insiders continue to sell at record levels, and others are buying up their shares.
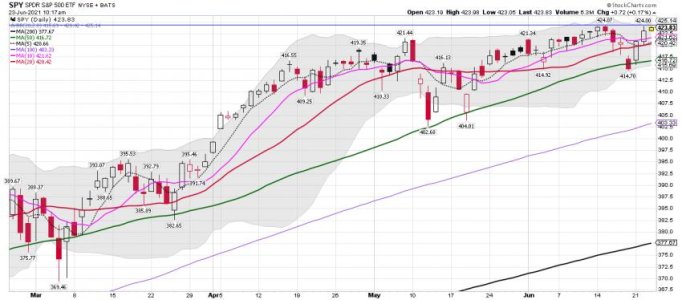
Bottom Line: My system remains on a buy signal, but I remain in cash. Good luck and good trading. I would stay nimble no matter what you decided. The SPY has basically gone sideways since the April highs....
https://stockcharts.com/h-sc/ui?s=SPY&p=D&yr=0&mn=4&dy=0&id=p61430624235&a=968265314
Attachments
Last edited:
robo
TSP Legend
- Reaction score
- 471
Warning: The Dollar's 'Pain 'Trade' is Higher
Jason Goepfert
Published: 2021-06-24 at 07:30:00 CDT
Following the Federal Open Market Committee's explanation of their thinking on the economy and interest rates, the U.S. dollar exploded to the upside. It followed through for a few days before pulling back this week.
Speculators have been short the dollar, suggesting that the pain trade is to the upside. A "pain trade" is a move that will seemingly hurt the most participants, usually when they've positioned too far in one direction or the other. This doesn't always work very well in the dollar or other trending currencies, but it seemed to have an impact over the past week.
Estimated Hedge Fund Exposure to the dollar is deeply negative. When it has been below 25%, the dollar's annualized return was +2.6%.
https://www.sentimentrader.com/blog/warning-the-dollars-pain-trade-is-higher/
robo
TSP Legend
- Reaction score
- 471
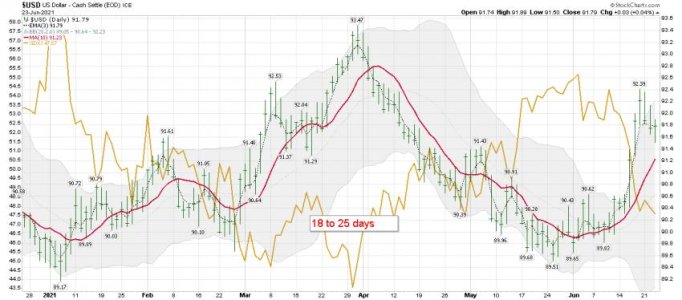
$USD daily: Remains in a Bullish uptrend on the daily, but many continue to short it. A Move back down to tag the 10 dma, after a huge short covering run. We shall see if it can hold and continue its current run once it tags the 10 dma again. It was way to stretched above it.
Attachments
robo
TSP Legend
- Reaction score
- 471
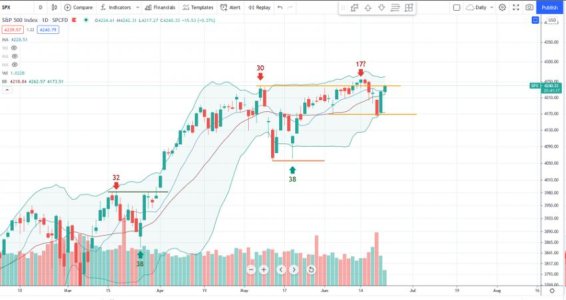
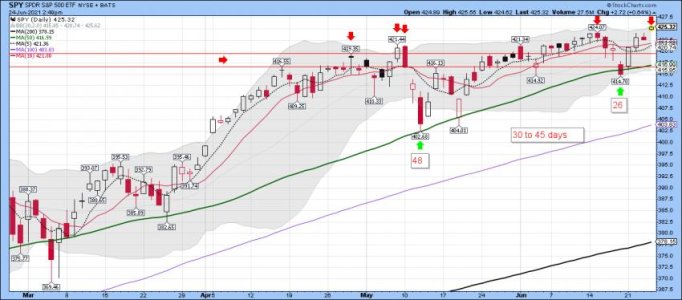
SPY daily: It better be different this time. So we have a new all time high, a gap up, and a tag of the upper BB. Since the April high the pattern has been that a tag of the upper BB is worth a ST trade using SDS. If you are long you would reduce position size today. Will we move back down to the 10 dma or lower? That is what will happened next if this pattern repeats again.... We shall see... I will ask the Magic 8 Ball again. LOL.... The question will be - Are we seeing a ST top today?
LOL.... The answer was NO....so good trading.
For the record: I don't use the Magic 8 Ball for trading.
LOL.... The answer was NO....so good trading.
For the record: I don't use the Magic 8 Ball for trading.
Attachments
robo
TSP Legend
- Reaction score
- 471
Indexes: daily data and non-confirmations - ATH SPX accompanied by the following non-confirmations:
SevenSentinels
@SevenSentinels
·
48m
ATH SPX accompanied by the following non-confirmations:
The ADL short of ATH
The DJ Trans far short of ATH
The NYA short of ATH
The Russell 2000 short of ATH
RSI under 61, & finally
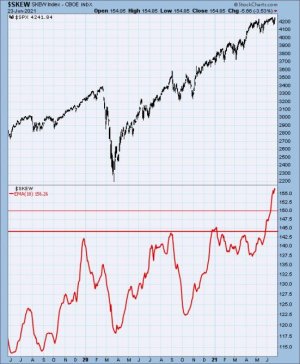
The 10-day ave of SKEW at a RECORD high over a stratospheric 156!
Patience
https://twitter.com/SevenSentinels?ref_src=twsrc^google|twcamp^serp|twgr^author
Attachments
robo
TSP Legend
- Reaction score
- 471
robo
TSP Legend
- Reaction score
- 471
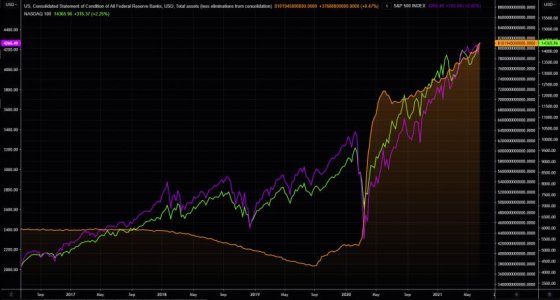
Trifecta all time highs
In case you are still confused of who is running the show. Mighty Fed first...and then the rest follows.
Fed's BS, NASDAQ and SPX all closing at all time highs...
https://themarketear.com/
In case you are still confused of who is running the show. Mighty Fed first...and then the rest follows.
Fed's BS, NASDAQ and SPX all closing at all time highs...
https://themarketear.com/
Attachments
robo
TSP Legend
- Reaction score
- 471
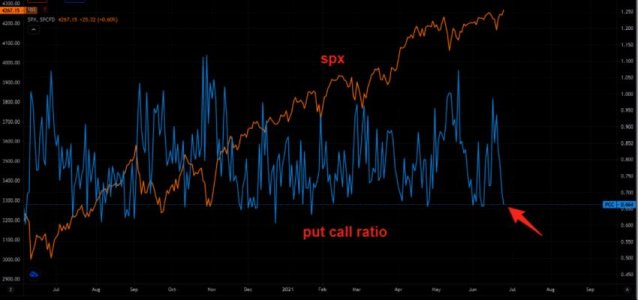
Put puke - mission accomplished?
Nothing new, but a reminder of that people love puts at market lows, and hate puts when market sits at highs.
This can go on for a while, but note the put call ratio now has reverted the entire FOMC move...
Everybody naked again...
https://themarketear.com/
Nothing new, but a reminder of that people love puts at market lows, and hate puts when market sits at highs.
This can go on for a while, but note the put call ratio now has reverted the entire FOMC move...
Everybody naked again...
https://themarketear.com/
Attachments
robo
TSP Legend
- Reaction score
- 471
There Has Never Been a Better Time to Lose Money
Jason Goepfert
Published: 2021-06-25 at 07:30:00 CDT
A rising tide lifts all boats in life and markets. And the rising tide of money has lifted the fortunes of many companies that otherwise would have sunk long ago.
All of this issuance amounted to more than $27 billion worth of offerings that have been priced. That, too, is a record amount dating back 40 years. As a percentage of the U.S. equity market, this is nothing more than a blip.
That's not really the point.
It's not about the amount of issuance; it's about a market environment that allows this to happen.
https://www.sentimentrader.com/blog/there-has-never-been-a-better-time-to-lose-money/
robo
TSP Legend
- Reaction score
- 471
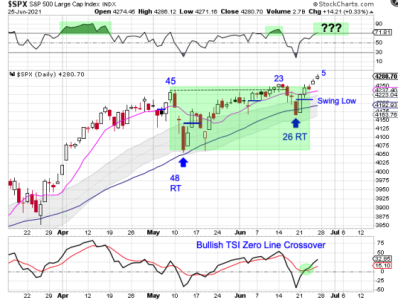
SPX daily: On a new daily cycle.
Stocks formed a swing low on Monday and continued higher into Friday, confirming the new daily cycle.
We need to be aware that stocks are late in their timing band for a yearly cycle decline. So at this point, a left translated daily cycle will likely lead to the YCL. RSI is approaching overbought. If it embeds in overbought then stocks will be resuming their yearly cycle advance. However, a bearish reversal would be a warning of a potential left translated cycle formation.
https://likesmoneycycletrading.wordpress.com/2021/06/26/the-6-26-21-weekend-report-preview/
Attachments
robo
TSP Legend
- Reaction score
- 471
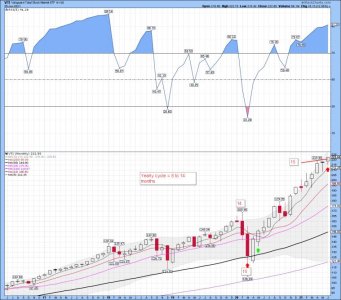
VTI monthly / Yearly cycle data: A closer look at the yearly cycle data using my VTI monthly chart. It be getting a tad long in the teeth.... Not that VTI ( The Total Stock Market) can keep going higher, but it's NOT a time to be chasing this move with a all in type position based on the Risk Reward data. However, some don't use Risk Management. In my opinion one should stay nimble here if you are long.
This be month 15 for the yearly equity cycle, placing stocks in their timing band for a yearly cycle decline.
This be month 15 for the yearly equity cycle, placing stocks in their timing band for a yearly cycle decline.
Attachments
Last edited:
robo
TSP Legend
- Reaction score
- 471
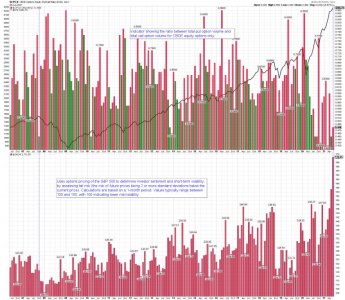
SKEW/CPCE monthly data: I know! It's telling us the Risk is much higher now, but the market just keeps going up!.. Still, risk management is in play here.
For the record: I track SKEW for risk management only.
Bottom Line: The trend remains UP!
A tweet about SKEW from a Pro below.
For the record: I track SKEW for risk management only.
Bottom Line: The trend remains UP!
A tweet about SKEW from a Pro below.

