Bear Cave 2 (Bull Allowed)

I'm tracking the weekly: Next chart....

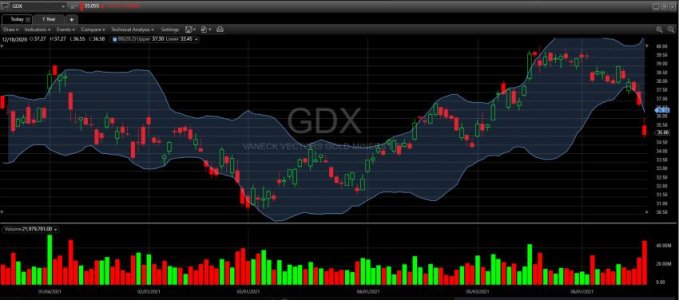
History suggests there could be at least one more day of trading UNDER the LOWER BB..
Quote Tweet
Tim Ord

With an hour to go to close: $GDX volume has already reached exhaustion levels. The previous four going back to last August all marked reversals and we expect this one to do the same. Friday's seems to mark most highs and lows. https://pic.twitter.com/QtSLkVfcmX
https://twitter.com/VolumeDynamics
 

Attachments

  • a.jpg
    a.jpg
    53 KB · Views: 56
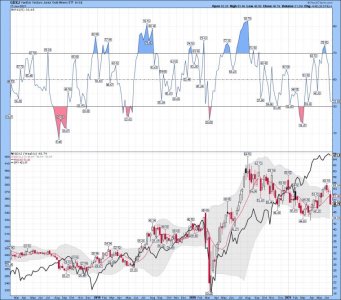
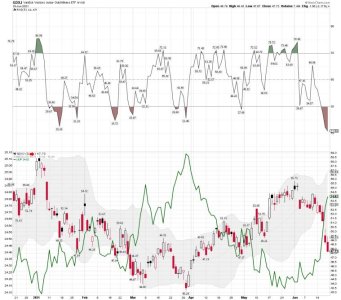
GDXJ weekly: A lower BB tag or maybe more? The dollar is in play here and one would think a ST bounce might happen soon.
 

Attachments

  • a.jpg
    a.jpg
    86.1 KB · Views: 57
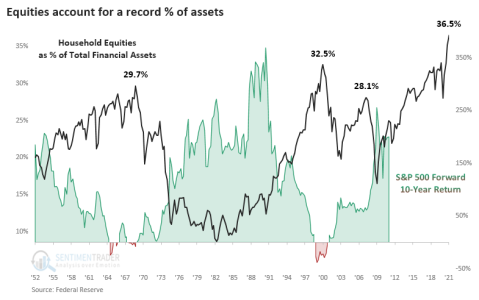
This Indicator Predicts Stocks Will Lose 36% Through 2023
Consumers are flush, and they've got a whole lot riding on markets.

The latest Federal Reserve data on household assets, just released with a delay for Q1, shows that once again, equities have pushed to a record relative to all household financial assets. At 36.5% of all assets, mutual funds and equities account for a greater share than any point since at least 1952.

The chart below shows this measure against the S&P 500's return over the next decade. There has been a clear negative correlation, meaning that as households allocate more of their assets to stocks, future returns on those stocks decrease.
https://www.sentimentrader.com/blog/this-indicator-predicts-stocks-will-lose-36-through-2023/
 

Attachments

  • a.png
    a.png
    75.1 KB · Views: 48
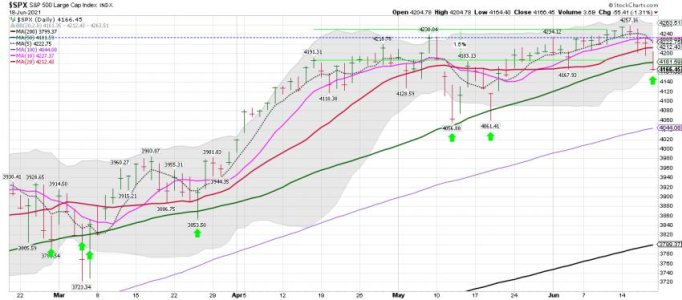
SPX daily: BTFD after tagging the 50 dma has been a winner this year. We shall see next week if that pattern continues....
 

Attachments

  • a.jpg
    a.jpg
    56.1 KB · Views: 49
GDXJ and the $USD: It's pretty clear how this works. One would think a ST bounce for GDXJ next week and a rest for the dollar move could happen soon. But unless you have a magic 8 ball I would stay nimble for now. The week after OPTX usually causes some additional selling pressure. I have a sell on GDXJ so other then ST trading with small positions I will just watch to take a MT position again. Tom's chart of historical data for June doesn't look good for next week. However, I trade the trade and I'm currently in cash waiting for the next buy signal. This could just be a 1/2 cycle low for stocks..... We shall see in the days ahead. GDXJ and the SPX pattern are linked closer then some think. See my chart below. The dollar is a big player right now in the ST data.
 

Attachments

  • a.jpg
    a.jpg
    77.5 KB · Views: 46
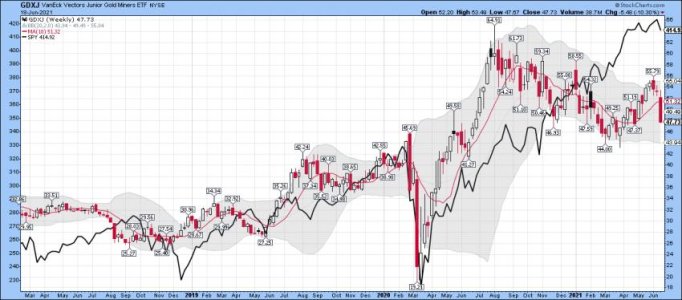
GDXJ and SPY weekly data: I'm watching the weekly and monthly data right now, and not doing to much trading. Looking for the next extreme to trade.
 

Attachments

  • a.jpg
    a.jpg
    61.9 KB · Views: 47
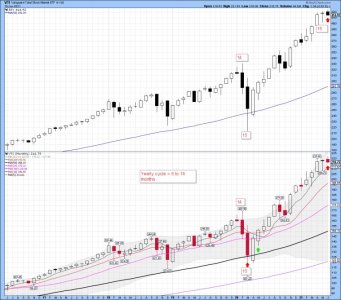
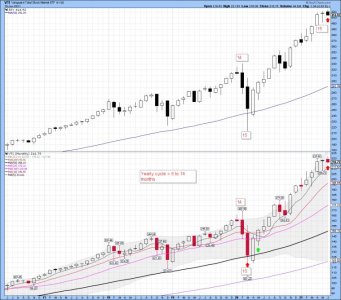
VTI/SPY monthly data: Still very stretched above the mean, and late in the yearly cycle. I'm not making a prediction here just pointing out the data.

Bottom Line: Remains in a uptrend if you are investing using the monthly data.
 

Attachments

  • a.jpg
    a.jpg
    85.6 KB · Views: 48
Many gold bulls were calling for a big breakout this week. I think most got blindsided, including "the Ord Oracle".

Though I exited my commodity stock trades with gains, I was stopped out this week so that trade is completely over with. Gap downs are not a good sign. My mind tells me some commodities will push higher, but I don't base trades on hope and nobody ever went broke taking a profit.

That 50 DMA has been a good buy point for months even when there were momentum divergences.

We shall see if this is the start of a bigger sell-off or just a 1/2 cycle low using the daily data. I will be ST trading waiting for the next yearly cycle low. Traded some SDS and VXX last week. Made some nice beer money, but sold all VXX Friday before the close. I don't like holding VXX over the weekend. I kept a small position of SDS. I would NOT recommend trading VXX to most traders.....

Have a nice weekend and take care Brother! I haven't posted in the other forum in some time....
 
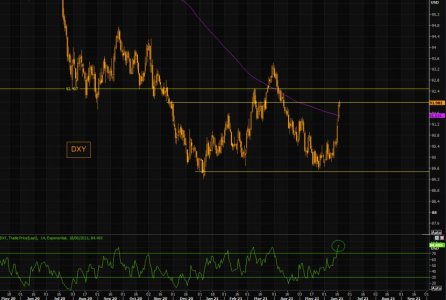
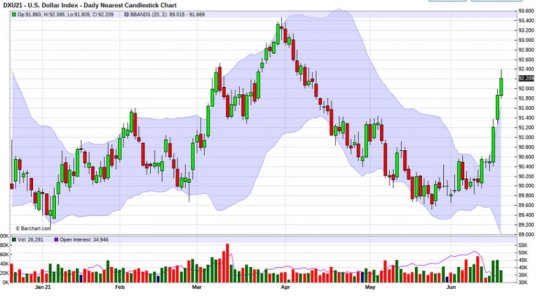
Mighty dollar - how high can you go?
Massively shorted dollar has had one of the more violent moves to the upside in a long time.

The DXY is printing the first big level at 92. Note we managed closing well above the 200 day yesterday.

Next big resistance is around the 92.4/92.5 area. RSI is getting very overbought, but overbought can stay overbought.

The dollar short has been huge and an extreme consensus view. Only some 10 sessions ago "pundits" were making fun of the DXY trying to push above short term trend lines. We have not heard back much from these guys lately...

Our general take on the mighty dollar remains intact; it remains stuck and we see it as a mean reversion trade, where you get involved at extremes. On June 3 we wrote;

"Pretty much all investment banks have been pushing the dollar breaking down story over past weeks...mean reversion is the way to trade this stuck asset.

Yes, mean reversion is painful, especially at turning points, but the potential squeezes/sell offs, are usually magnified as a "vacuum" is built around the range extremes.

The DXY is crushing the short term trend line since early April, putting in the biggest up candle we have seen in "forever"."

We all know how the dollar has gone since then, a massive squeeze, magnified by the "vacuum".

Momentum remains strong, but chasing the DXY here is for panic shorts only.

Our DXY logic worked out well, but here is "no mans land" trading. Time to move on to new opportunities...
https://themarketear.com/
 

Attachments

  • a.jpg
    a.jpg
    60.7 KB · Views: 66
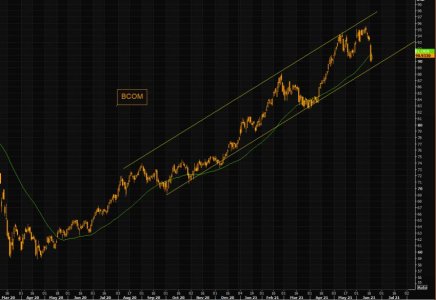
Commodities - just a shake out of weak hands?
BCOM is a massively crowded and loved long. The most recent sell off has taken the index from (almost) trend channel highs, to (almost) trend channel lows.

We saw it break below the 100 day yesterday. Despite the DXY squeezing further today, the BCOM is actually up, trading close to the 50 day.

The question is if this is just a "needed" pause in crowded BCOM longs where the weak hands are being shaken out?

Second chart shows how commodity market open interest rose to a record seasonal high...just in time for the puke.
https://themarketear.com/
 

Attachments

  • a.jpg
    a.jpg
    59.1 KB · Views: 67
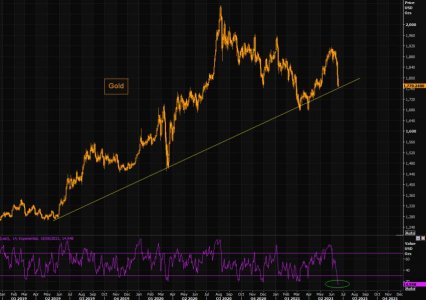
Gold - enough is enough?
The puke in gold has left many "smart bulls" scratching their heads.

Gold has crushed a lot of moving averages during this sell off, but note we are approaching the longer term trend line and RSI has not been this oversold in years.

Note the real yields vs gold chart potentially could be "indicating" gold has come down too much too fast.

For the tech geek, gold is putting in a huge inverted hammer today. The psychology of this type oif candle post big sell offs can often be powerful as a reversal signal, but we need a confirmation candle.

Last chart shows nothing new really to regular readers of TME; hated gold became loved in a few weeks and the crowd decided piling into the gold long logic.

Is the pain ebbing out here?
https://themarketear.com/

Goldman: Oversold gold is once again under-priced
Gold has sold off in line with rising real rates and a stronger dollar. Goldman does however see an upward price reversal in coming weeks. Goldman: "Gold is now pricing a Goldilocks scenario of strong growth without any inflation, implying limited demand for it as either a defensive asset or inflation hedge. This perfect scenario seems unlikely to materialize for two reasons. First, as our rates strategists noted, the current 10-year breakeven inflation rate is too low vs our economists projected inflation path - in fact it implies almost no inflation risk premium in coming years. Second, should the Fed's expectation of transient inflation materialize, higher rates will begin to act as an unnecessary headwind to the global recovery, damaging growth expectations, and raising gold's defensive value"
 

Attachments

  • a.jpg
    a.jpg
    63.2 KB · Views: 63
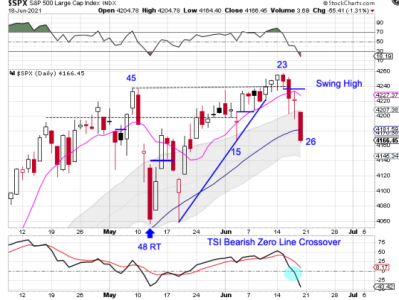
SPX daily cycle data:

The Weekend Report Preview
Stocks closed below the 10 day MA on Tuesday and the the 50 day MA on Friday to confirm the daily cycle decline.

Friday was day 26 for the daily equity cycle, which is still a bit early to expect a DCL. The peak on day 23 indicates a right translated daily cycle formation which aligns with stocks being in a daily uptrend. If stocks form a swing low above the lower daily cycle band that would signal a continuation of the daily uptrend and trigger a cycle band buy signal.
https://likesmoneycycletrading.wordpress.com/2021/06/19/the-weekend-report-preview-2/
 

Attachments

  • a.png
    a.png
    93.9 KB · Views: 61
Monthly cycle data: This is month 15 for the yearly equity cycle. It puts stocks in their timing band for a yearly cycle decline. We shall see how next week plays out. The pattern indicates we should bounce next week after tagging the 50 dma on the daily chart. A sell signal for ST traders on the daily chart.
 

Attachments

  • a.jpg
    a.jpg
    77.3 KB · Views: 58
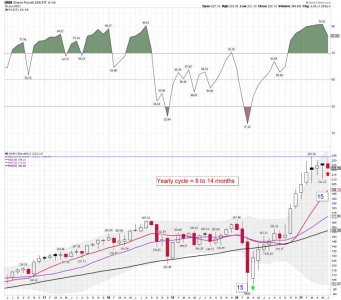
Monthly cycle data VTI and SPY: This is month 15, and we are stretched above the mean. I use the 200 dma on the daily for tracking that data and the 50 mma on the monthly.

Bottom Line: The monthly remains in a uptrend and NO SELL signal yet.
 

Attachments

  • a.jpg
    a.jpg
    85.6 KB · Views: 60
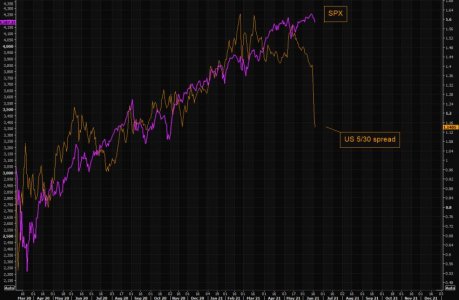
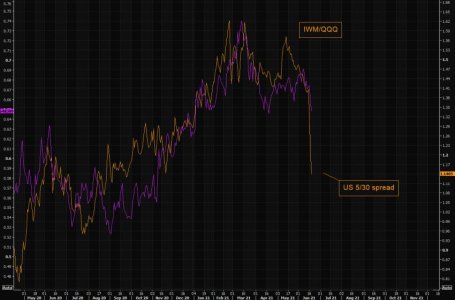
US 5/30 spread horror
Powell's failure was "felt" across assets this week and the "biggest" mover was the US 5/30 yield spread.

This "shock" has many effects, and is NOT "transitory" (more on this here).


On Friday (here) we explained the huge p/l pain from what "just happened", but the question is obviously if this was just a one off, or if this was just the start of p/l pain many thought was impossible.

A few charts to ponder when you think about the move in the 5/30 year spread;

SPX, IWM/QQQ ratio, BCOM and XLF vs the 5/30 year spread are just a a few to consider...
https://themarketear.com/
 

Attachments

  • a.jpg
    a.jpg
    57.6 KB · Views: 52
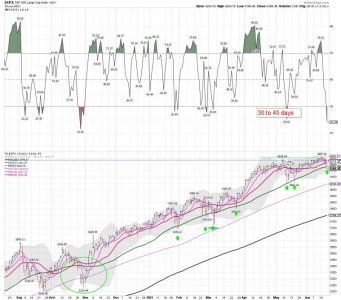
SPX daily: Will this tag of the 50 dma keep the current pattern going? It has been a very good buy signal since the low in November last year We shall see how this plays out. It has been a nice run so far for those that have remained long and added the 50 dma tags.
 

Attachments

  • a.jpg
    a.jpg
    84.9 KB · Views: 48
The Talking Heads Might Be Wrong About This
Jeff Clark | Jun 21, 2021 | Market Minute | 3 min read

Regular readers know I’ve been cautious on the stock market since early June, when our “crystal ball” was predicting the Volatility Index (VIX) would be higher – and that typically goes along with a falling stock market.

Sure enough, the VIX closed Friday about 18% higher than where it was back then. The S&P 500 closed Friday about 50 points lower. So, we’ll give the crystal ball a “win” for that prediction.

And, if we were going to get an even deeper decline in the stock market this week, then the VIX call options should still be a lot more expensive than the VIX put options… But they’re not.
This has happened two previous times this year. Each time marked at least a short-term bottom in the S&P 500.

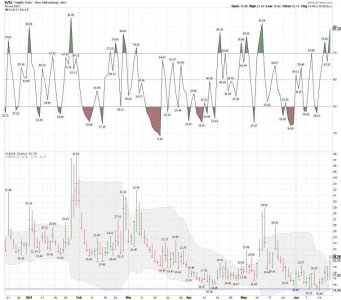
"Traders should also consider that the VIX closed above its upper BB on Friday. So, it’s set to trigger a broad stock market buy signal when it closes back inside the bands."

And that could happen as soon as today…

So, despite the seasonal weakness, the bearish action last week, and the TV talking heads preaching caution, I’m more inclined to want to be a buyer early this week rather than a seller – at least for a short-term move higher.

We can get cautious again once all the talking heads turn bullish.

Best regards and good trading,
https://www.jeffclarktrader.com/market-minute/the-talking-heads-might-be-wrong-about-this/

VIX daily data with BB below:
 

Attachments

  • a.jpg
    a.jpg
    72.8 KB · Views: 50
Back
Top