Bear Cave 2 (Bull Allowed)

It has been a wild one!

The Most Extraordinary Year Of Our Lives

" we haven’t even reached the halfway mark for 2021.
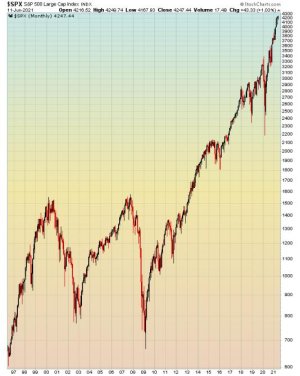
As we begin this article in June 2021, let us zoom back 106 years and examine where markets are today from a multi-decade, even multi-century perspective.
As we view SPX quarterly for the last 100 years, we see only one other period that even comes close to the exceptional nature of the last 12 years. That period was for those years leading up to 1929"

@SevenSentinels

38m
June 13, 2021 - 5 PM
Open To ALL

The Most Extraordinary Year Of Our Lives
https://sevensentinels.com/the-most-extraordinary-year-of-our-lives/

The following chart displays a closer view of this once in a century behavior of SPX since 2009:


We stand by those comments, as all of the data we’ve studied this weekend backs up these observations. But we await final confirmation.
We continue to believe that 2021 will prove to be “The Most Extraordinary Year Of Our Lives.”
Even more importantly, though, once the Bear Market gets underway for good, 2021-2023 has the potential to provide the most profitable period of our lives for trend traders.
 

Attachments

  • a.jpg
    a.jpg
    47.1 KB · Views: 75
Last edited:
Alice’s Adventures in Equilibrium


John P. Hussman, Ph.D.
President, Hussman Investment Trust

June 2021

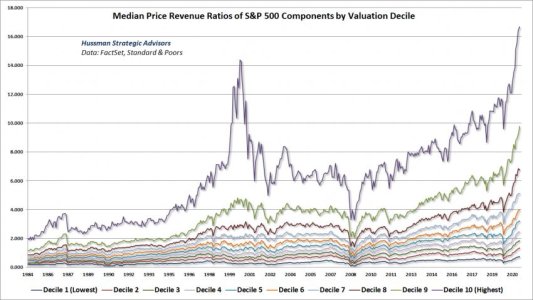
This is not a market that is priced for the smallest shred of disappointment. Below, we’ve sorted S&P 500 into 10 deciles, by price/revenue ratio (thanks as usual to our resident math guru Russell Jackson for compiling all of this data). Each line shows the median price/revenue ratio of each decile. Keep in mind that the lowest valuation deciles typically represent companies in industries such as retail and industrials, while the highest valuation deciles typically represent companies in industries like information technology and medical devices. So each line is best compared with its own history. Presently, every one of these deciles is at the most extreme level in history (unlike the 2000 peak, when there was far more dispersion across valuations). This is breathtaking, and I don’t expect it to end well.
https://www.hussmanfunds.com/comment/mc210614/
 

Attachments

  • a.jpg
    a.jpg
    66 KB · Views: 68
thomas
@VolumeDynamics
·
1m
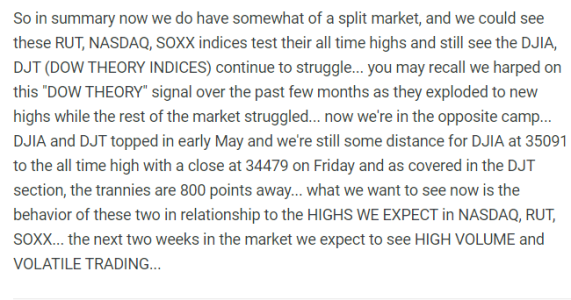
Here's a summary of our short term outlook for equity markets... From Monday's Forecasts - I cover $SPX, $NASDAQ, $SOX, $RUT, $XAU, $DJT, $GC, $CL, $GS, $AAPL with daily forecast updates.
https://twitter.com/VolumeDynamics
 

Attachments

  • a.png
    a.png
    63.2 KB · Views: 72
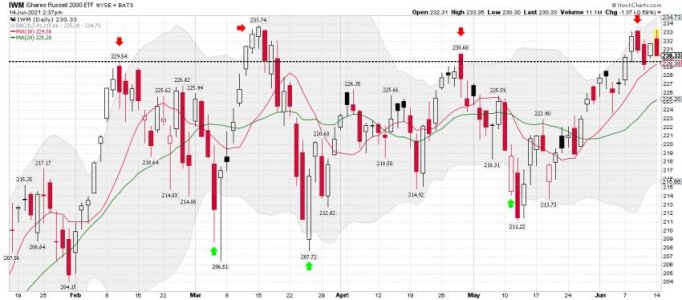
IWM daily: The pattern indicates IWM could move back down to tag the lower BB in the days ahead. Still trending above the 10 dma and it is now close to the Feb 10 price marker. Some good ST trading for those that traded the BB trades... Buy and hold are close to a push if they held the entire 4 months.
 

Attachments

  • a.jpg
    a.jpg
    57.5 KB · Views: 79
This Chart Shows That Options Whales Have Been Beached
Published: 2021-06-15 at 07:45:00 CDT

This call buying accounted for over 9% of all NYSE volume and it's not like these traders are hedging by buying some puts, either. When we look at small traders' call buying volume and subtract their put buying to get a net figure of speculative behavior, it's even more egregious.

This is important because unlike any other period in 20 years, the smallest of traders are the dominant factor in speculative options trading, accounting for 40% - 50% of all call buys to open.
https://www.sentimentrader.com/blog/this-chart-shows-that-options-whales-have-been-beached/
 
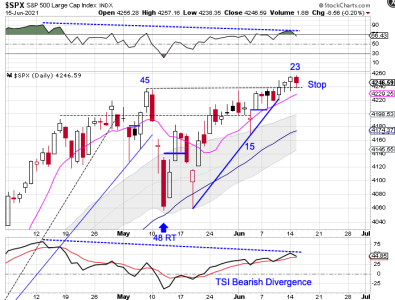
SPX daily cycle data: We shall see how it plays out the next several days!

Possible ‘Sell The News’
Stocks broke out to new high last week, but have not delivered any bullish follow through. We are starting to see bearish divergences developing on the oscillators. This has me concerned that Wednesday's statement might trigger a 'sell the news' response. A swing high and close below the 4240 breakout level would indicate the daily cycle decline.
https://likesmoneycycletrading.wordpress.com/2021/06/15/possible-sell-the-news/
 

Attachments

  • a.png
    a.png
    48 KB · Views: 77
Is The Crash in the Lumber to Gold Ratio a Good Sell Signal?

Jason Goepfert
Published: 2021-06-16 at 07:15:00 CDT

The ratio of lumber to gold is crashing, and it's raising concerns among some investors.

Lumber is considered a proxy for economic growth since it's an input to many construction projects. Gold is considered a "safe haven" asset that investors flock to in times of duress. Both assertions are questionable, but when the ratio of lumber to gold is rising, the theory is that investors are focused more on growth than safety, and it's a risk-on environment.

Ever since the Optimism Index on lumber hit 90%, lumber has been in a free-fall, surpassing the last couple of post-euphoria crashes in speed, if not magnitude.

The last time the ratio crash, it preceded trouble in the S&P.
https://www.sentimentrader.com/blog/is-the-crash-in-the-lumber-to-gold-ratio-a-good-sell-signal/
 
Interesting thing about lumber is I don't think retail investors are buying it. I'd bet it was mostly the work of those family type offices registered in the Seychelles using leveraged swaps or something else I don't understand to run up the price. High leverage = margin calls = forced selling for liquidity. So besides lumber, what else is being hit?
 
Interesting thing about lumber is I don't think retail investors are buying it. I'd bet it was mostly the work of those family type offices registered in the Seychelles using leveraged swaps or something else I don't understand to run up the price. High leverage = margin calls = forced selling for liquidity. So besides lumber, what else is being hit?

I think ( my opinion) the next move for the dollar is going to be up so that should change things related to commodities. Many are still heavy into the inflation trade. It has been unwinding for weeks now. We shall see how that plays out. It just tagged the upper BB, and that pattern has caused the dollar to move back down as traders continue to add short positions for the dollar.
 

Attachments

  • a.jpg
    a.jpg
    47.9 KB · Views: 66
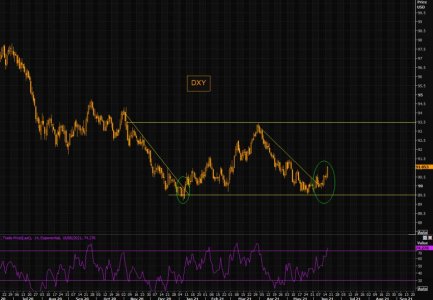
Some King dollar Stuff:

With the latest out from Fed we are finally seeing some volatility across assets. Mighty dollar continues squeezing, creating huge p/l pain, as the crowd has reloaded the so popular short trade in the dollar.

Note the negative trend line is gone and the RSI positive divergence worked again.

On June 2 we reminded our readers;

"It would be too perfect if it bounced here, especially as the crowd has been adding to Dollar shorts."

Charts 2, 3 and 4 all show the various dollar shorts having been added lately.

Our DXY - January Déjà Vu? similarity is playing out perfectly...
https://themarketear.com/
 

Attachments

  • unnamed (2).jpg
    unnamed (2).jpg
    66.6 KB · Views: 69
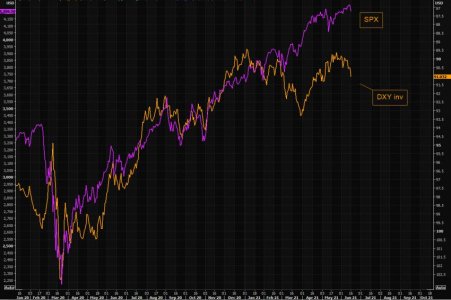
Remember the dollar and equities love?
Dollar down, equities up worked well. Does the inverse work?

The gap between SPX and the DXY (inverted) is huge.

Looks we should add it to another of those Jaws gaps to watch...
https://themarketear.com/
 

Attachments

  • a.jpg
    a.jpg
    61.4 KB · Views: 69
I think this is about to change... (An opinion since I trend trade)
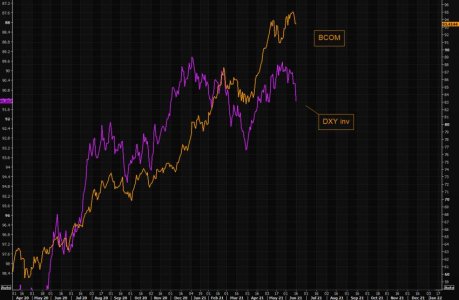
What about the dollar and commodities logic?
Do you still buy commodities because the dollar is weak?

Let's see how BCOM performs going forward, but the weak dollar logic is not in play at the moment, at least not as a short term narrative.

The gap between BCOM and inverted DXY is getting very wide...
https://themarketear.com/
 

Attachments

  • a.jpg
    a.jpg
    58 KB · Views: 70
Shake out some weak hands before the next leg up?

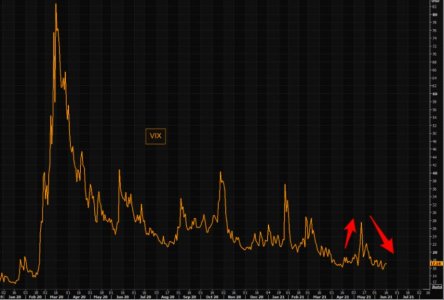
Sell in May didn't work. The only thing that worked in May was to be long gamma/vol going into the May panic (recall the "VIX guy" note here). The VIX collapse that occurred later was not as "sexy", sure protection collapsed post mid May, but you did not want to be short gamma those moves as the initial upside panic was almost as violent as the sell off.

Here we are, waiting for Fed and Powell's "grand" meeting. VIX is up some from "panic must sell lows" last week, but protection remains overall low(er).

Low VIX does not necessarily mean it is cheap. Nobody has missed the low realized vols lately, with SPY realized vols at "depressed" levels.

Add to this that dealers have been stuck in long gamma land, and you understand what has been feeding the vol collapse;

no new macro narratives and dealers stuck in long gamma (basically suppressing vols by selling if markets go up, and buying if markets go down).

Note we are trading slightly below max long gamma levels.

What about the short term seasonality and flow picture?

1, last two weeks in June is the worst two week period of the year

2, pension funds will need to reduce equities more than models predict

3, Black out window started two days ago (outlined here)

4, The big Russell re balancing on June 25

Above points via GS could be some the ingredients for a tactical mini puke as we enter the worst two week period of the year. Imagine the p/l pain if this would sell off quickly, and then rip higher and break out in size...

After all, the worst two week period in June is followed by the first two week period of July, the best period of the year by far.

What about protection?

VIX is up from lows last week, but has come down big. The gap vs VVIX has increased over past sessions and is now rather wide.

Credit protection, CDX IG, has collapsed recently, offering relatively cheap hedges.

We have had boring equities and extremely low realized volatility across indexes. Last chart shows how the long gamma exposure is about to fade post coming expirations. Ceteris paribus, this will make market more "fluid", i.e long gamma dealers will not "suppress" moves in the same way we have seen over past weeks.

Let's see what Powell delivers in a few hours...
 

Attachments

  • a.jpg
    a.jpg
    46.8 KB · Views: 65
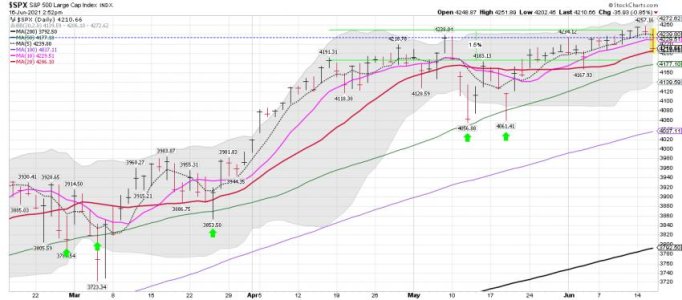
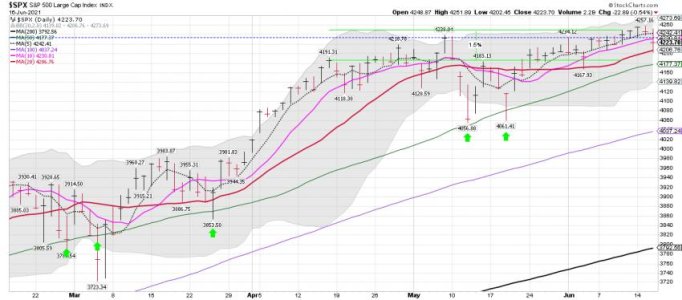
SPX daily: We did tag the 20 dma and bounced..... We shall see if the bulls can get the 10 dma back tomorrow....

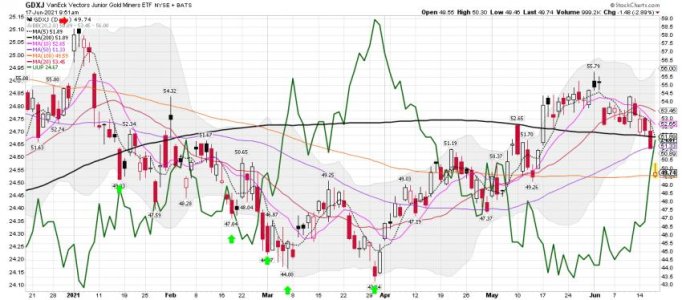
Bottom Line: No sell signal yet for those using the 20 dma to trend trade, but gold and GDXJ be having some trouble.
 

Attachments

  • a.jpg
    a.jpg
    55.3 KB · Views: 68
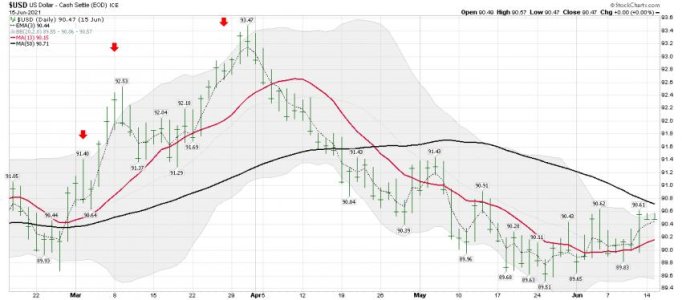
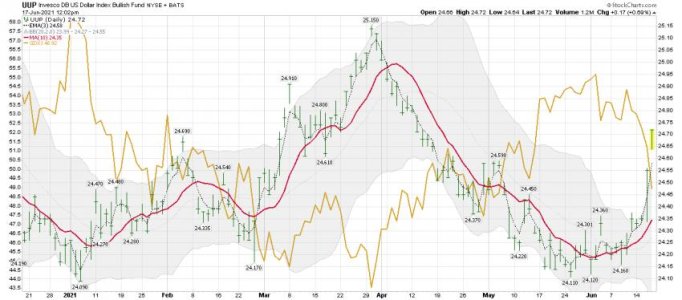
UUP daily: Based on the pattern and the current move up, one would think UUP is going to pull back some down to the upper BB to start. Some of the USD shorts had to cover today!
 

Attachments

  • a.jpg
    a.jpg
    57.3 KB · Views: 60
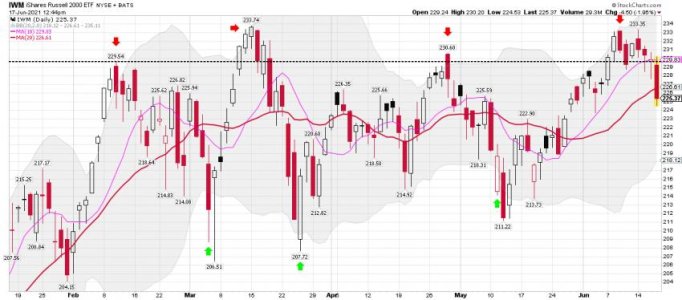
IWM daily: A move back down to the lower BB? Very possible..... IWM moved under the 20 dma fairly quick this morning ( a sell signal for some). The upper/lower BB tag pattern has been a good one to trade and we are now back under the Feb high..... No gains for buy and hold, and not very good for trend trading as we have had to many whipsaws trading this index the last four months. However, the weekly looks good....
https://stockcharts.com/h-sc/ui?s=IWM&p=D&yr=0&mn=5&dy=0&id=p72985267637&a=970039333
 

Attachments

  • a.jpg
    a.jpg
    58.3 KB · Views: 64
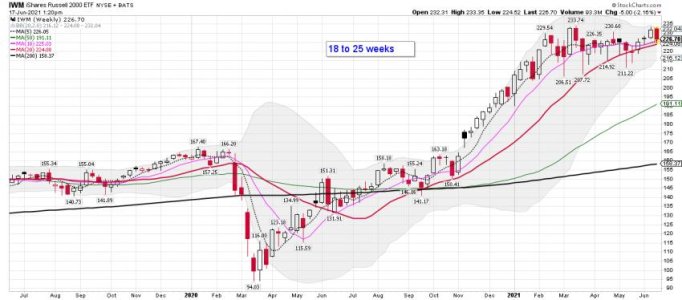
IWM weekly: Remains above the 10 and 20 wma. I use the daily closing price for trend trading. We shall see how it closes and if buyers come in. The dollar is putting huge pressure on stocks right now. Note the BB squeeze that has been taking place. Will the first big move be a fake-out? That is something we will just have to wait and see. Unless you have a magic 8 ball to ask use some Risk Management here and stay nimble. I agree that BTFD has been a winner, but one should respect the current cycle and where we are in it. That is why I use cycles as a tool for risk management.
 

Attachments

  • a.jpg
    a.jpg
    54.8 KB · Views: 87
Last edited:
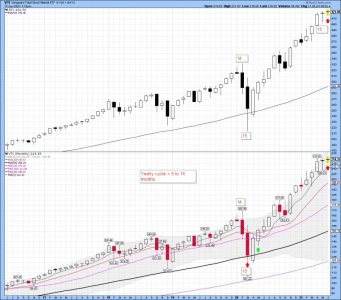
Yearly cycle data: If you are an investor and using the monthly cycle data, we haven't even gotten close to a sell signal. However, this deep into the cycle one should have reduced some and taking some profits. We are stretched above the 50 mma which is the mean to watch. The rubber band can only stretch so far and so long before it pulls back some.
 

Attachments

  • a.jpg
    a.jpg
    86.3 KB · Views: 62
Back
Top