-
The Forum works well on MOBILE devices without an app: Just go to: https://forum.tsptalk.com
-
Please read our AutoTracker policy on the IFT deadline and remaining active. Thanks!
-
$ - Premium Service Content (Info) | AutoTracker Monthly Winners | Is Gmail et al, Blocking Our emails?
Find us on: Facebook & X | Posting Copyrighted Material
-
Join the TSP Talk AutoTracker: How to Get Started | Login | Main AutoTracker Page
You are using an out of date browser. It may not display this or other websites correctly.
You should upgrade or use an alternative browser.
You should upgrade or use an alternative browser.
Bear Cave 2 (Bull Allowed)
- Thread starter robo
- Start date
robo
TSP Legend
- Reaction score
- 471
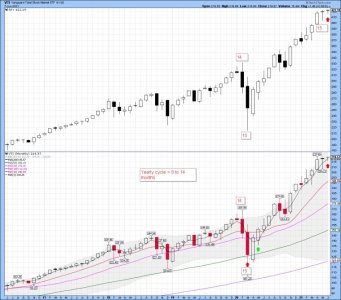
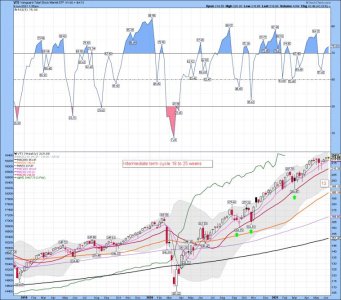
VTI/SPY yearly cycle: On month 15..... What a nice run we are on since the last yearly cycle low! If you bought close to the 50 month ma tag and held it's been a nice run. Not even close to a sell signal since moving above the 10 ma in May of 2020. We are on month 15, but only a tad stretched since the last yearly cycle low..
Stocks are now on their 3rd intermediate cycle. So we are getting a stretched yearly cycle as the Fed continues to pump money into this market. The insiders continue to sell.
Bottom Line: The monthly trend remains up!
Stocks are now on their 3rd intermediate cycle. So we are getting a stretched yearly cycle as the Fed continues to pump money into this market. The insiders continue to sell.
Bottom Line: The monthly trend remains up!
Attachments
Last edited:
robo
TSP Legend
- Reaction score
- 471
Hmmmmm....
BEAR SIGHTING?
Probability of a New Bear Market is Rising
Jason Goepfert
Published: 2021-06-08 at 07:34:37 CDT
BEAR SIGHTING?
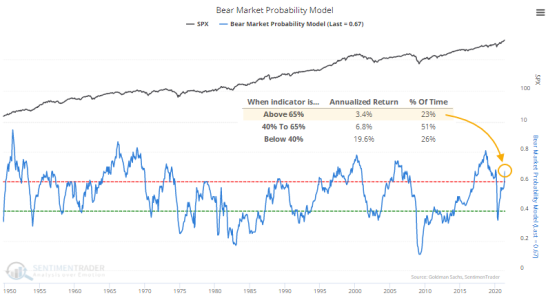
The probability of a new bear market is rising.
Now that data from May have been finalized, the Bear Market Probability model has risen to its highest level since January 2020.
When the model is above this threshold, the S&P 500 has returned an annualized +3.4%. That's not disastrous, but it's well below average and only a sixth of the return when the probability is below 40%.
Bear Market Probability is our version of a model outlined by Goldman Sachs using five fundamental inputs. Each month's reading is ranked versus all other historical readings and assigned a score. The higher the score, the higher the probability of a bear market in the months ahead.
https://www.sentimentrader.com/blog/the-probability-of-a-new-bear-market-is-rising/
BEAR SIGHTING?
Probability of a New Bear Market is Rising
Jason Goepfert
Published: 2021-06-08 at 07:34:37 CDT
BEAR SIGHTING?
The probability of a new bear market is rising.
Now that data from May have been finalized, the Bear Market Probability model has risen to its highest level since January 2020.
When the model is above this threshold, the S&P 500 has returned an annualized +3.4%. That's not disastrous, but it's well below average and only a sixth of the return when the probability is below 40%.
Bear Market Probability is our version of a model outlined by Goldman Sachs using five fundamental inputs. Each month's reading is ranked versus all other historical readings and assigned a score. The higher the score, the higher the probability of a bear market in the months ahead.
https://www.sentimentrader.com/blog/the-probability-of-a-new-bear-market-is-rising/
Attachments
robo
TSP Legend
- Reaction score
- 471
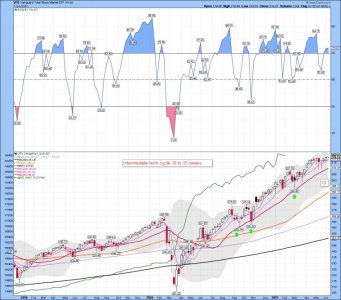
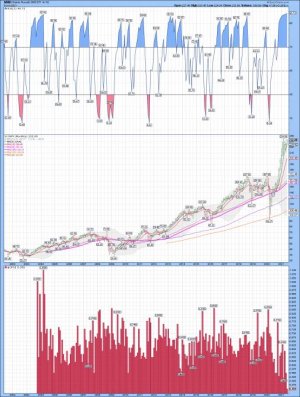
VTI weekly: I hope you haven't been trying to pick a top since the March 2020 lows. There has been some nice swing trades, ( tags of the 20 wma were also very nice times to add shares - red line) but buy and hold/hope investors have done well! LOL.... The dumb money has out performed many pros the last 12 months. The Fed probably has an index fund with Blackrock.
IWM be helping VTI in making a new all time high. Another 1 trillion, or more, of spending is getting closer and the market loves it. LOL.... how do they pay for it? Someone is going to pay higher taxes in the end, and inflation will come back. Will we get tax selling this year? STBD, but I think taxes are going up this year.
Bottom Line: The weekly trend remains UP!
The red 20 wma is a good one to use for LT investors. It has been REALLY good this run, but the next several years I doubt will continue like the last 14 months. However, if it does then I will just trade the trend as we move higher.
Attachments
robo
TSP Legend
- Reaction score
- 471
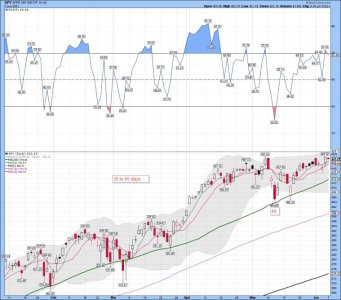
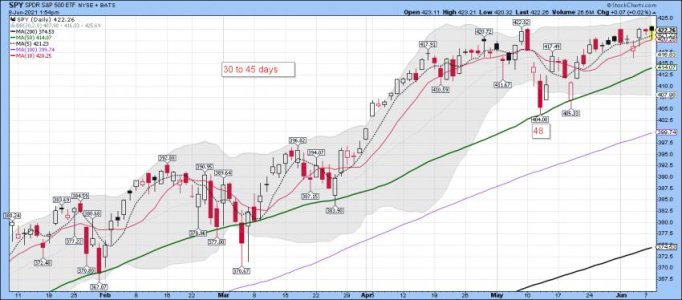
SPY daily: Another BT and bounce off the 10 dma..... The BOTS got this covered.....
Bottom Line: The trend remains up and the Bears continue to get smoked and stopped out. Who be buying protection? Why waste money on that....
SPY testing the high..... we shall see how we close.....
Have a nice day!
Bottom Line: The trend remains up and the Bears continue to get smoked and stopped out. Who be buying protection? Why waste money on that....
SPY testing the high..... we shall see how we close.....
Have a nice day!
Attachments
robo
TSP Legend
- Reaction score
- 471
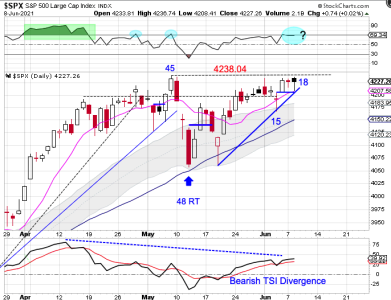
Daily Cycle - Right Translation
We have been watching RSI as stocks emerged from their day 48 DCL. Just prior to the day 48 DCL, RSI became overbought twice. As it became overbought it delivered quick bearish reversals. Now we are seeing a change in behavior. RSI became overbought on Friday. However it did not deliver a quick bearish reversal. If RSI embeds in overbought that would indicate that stocks are resuming their intermediate cycle advance. Stocks have been consolidating for the past 2 weeks just below the all time high of 4238.04. A bullish break above this resistance level could lead to a trending move.
https://likesmoneycycletrading.wordpress.com/author/likesmoneystudies/
Attachments
Last edited:
robo
TSP Legend
- Reaction score
- 471
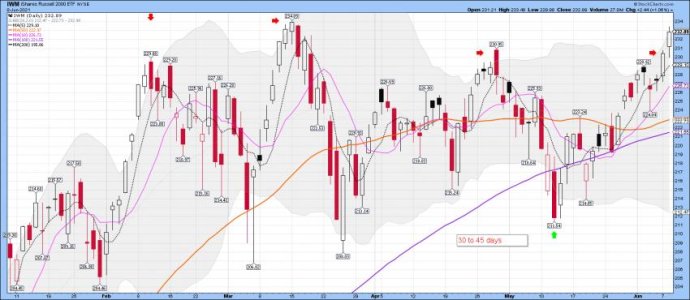
IWM continues its move higher:
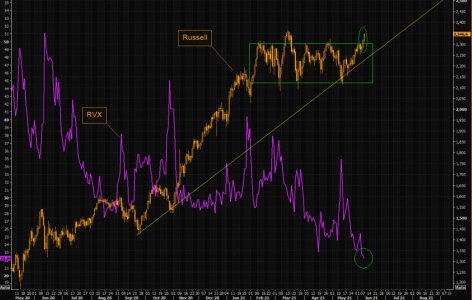
Mighty small caps break out continues
Small caps continue surging, adding to the break out move. Russell has closed slightly higher on two occasions, during the false break out in March.
Given the fact we have seen the index consolidate for months, this move has more momentum to it as the weak hands have been worked off during the range.
Note the new lows of RVX (Russell VIX) offering great options upside calls plays, which remains our logic of how to play various break out trades.
As we pointed out yesterday, CCC spreads have collapsed, and small caps have move in sympathy with those imploded spreads, although there is a Russell "catch up" to be realized.
https://themarketear.com/
Attachments
robo
TSP Legend
- Reaction score
- 471
Attachments
robo
TSP Legend
- Reaction score
- 471
Hmmm....
https://themarketear.com/
https://themarketear.com/
Attachments
robo
TSP Legend
- Reaction score
- 471
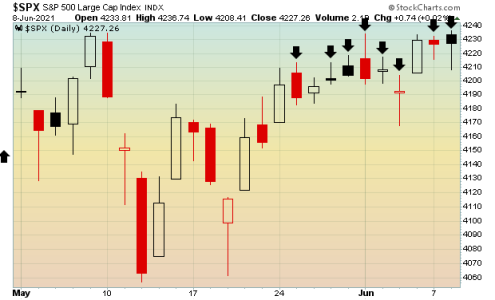
SPX daily: We shall see how this rejection plays out the rest of the week!
https://twitter.com/SevenSentinels?ref_src=twsrc^google|twcamp^serp|twgr^author
SevenSentinels
@SevenSentinels
1h
June 8, 2021, 8:20 PM
SPX Rejection At The High
https://twitter.com/SevenSentinels?ref_src=twsrc^google|twcamp^serp|twgr^author
SevenSentinels
@SevenSentinels
1h
June 8, 2021, 8:20 PM
SPX Rejection At The High
Attachments
robo
TSP Legend
- Reaction score
- 471
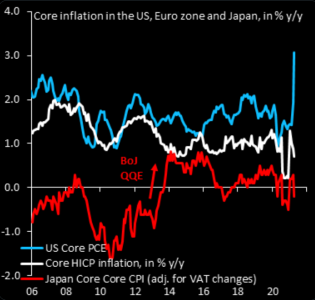
Will June 10th be the inflation shocker day, or will it just be a whimper?
Part of the poetry of inflation is that very few understand where it comes from and even fewer are good are forecasting it. Ahead of tomorrow's big print TME has listed a random selection of "the good, the bad and the ugly" latest data points on this what Buffet calls a "gigantic corporate tapeworm". Let's start with the bad news.
June 10th - the potential inflation shocker day
Nordea's macro team continues to be vocal about inflation printing higher. They see risks of a big surprise to the upside for June 10 (May report) with core inflation around 4%, way above early consensus at 3.4%
Meanwhile, the market is still in transitory mode, but for how long?
Nordea's main points to consider;
"2, Clear risks of core inflation >4% in May or June already
2, Headline inflation above 6%?
3, Watch used cars and rent of shelter components in the May report
4, Markets still find inflation mostly transitory"
The used cars "squeeze" continues to be huge. Second chart showing various scenarios assuming 50% up in used cars adding different scenarios to rent of shelter.
GS latest on inflation isn't as "bullish "as Nordea's macro team is. GS writes;
"In the US, our economists forecast a peak core CPI of 3.6% yoy in June, followed by 3.5% at end-2021 and an average of 2.7% in 2022. Their core PCE inflation forecast remains at 2.8% in April/May, followed by 2.3% at end-2021 and an average of 2% in 2022"
The investment bank also notes that inflation is good up to a certain point, so Nordea's take should be considered.
A sudden surge Nordea is describing is not currently "priced" by the market. Given the latest equity vol implosion, our long VIX logic from last week stays intact when we outlined the following;
"As we outlined earlier today, VXHYG reversed two days ago already, and the little late gap vs VIX should come in as the natural low for VIX here."
...but chasing it at 19 now looks a little rich for the short term
https://themarketear.com/
Attachments
Last edited:
robo
TSP Legend
- Reaction score
- 471
Inflation? No Worries says David Rosenberg - Maybe no worries for some, but prices continue to increase.
David Rosenberg Retweeted
Jay Taylor
@JayTaylorMedia
https://twitter.com/EconguyRosie?lang=en
Jun 3
A growing number of investors and financial pundits are suggesting the Fed may be wrong in suggesting inflation transitory. But David Rosenberg agrees with J Powell and provides some good arguments here
https://www.youtube.com/watch?v=-yGlI22Z3Zk&t=4s
Mohamed A. El-Erian
@elerianm
·
40m
The avalanche continues this morning with a
@DeutscheBank
A report that is getting some attention on #WallStreet
Economists there warn that the Fed's policy stance and framework risk a "time bomb" that "could create a significant recession and set off a chain of financial distress"
https://twitter.com/elerianm
LOL..... Buy and hold love it!
Sven Henrich
@NorthmanTrader
1h
“The Fed itself is increasing the pressure on the system by continuing to buy $120 billion a month of Treasuries and mortgage-backed securities to push down long-term interest rates.”
https://twitter.com/NorthmanTrader
Last edited:
robo
TSP Legend
- Reaction score
- 471
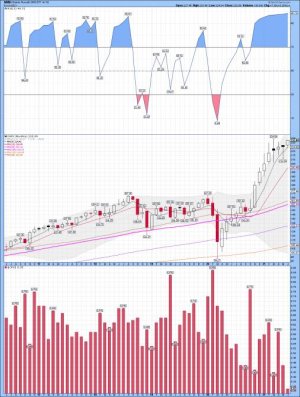
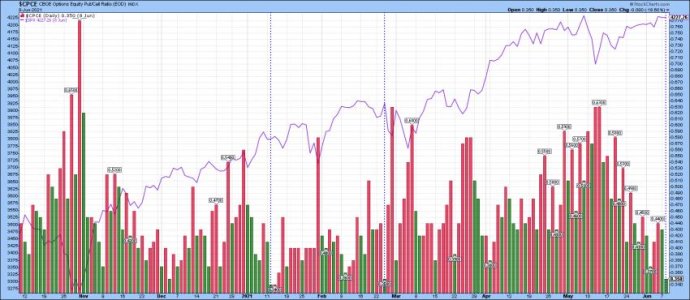
IWM monthly: As we head to a new all time high - IWM has the Highest RSI and the Lowest $CPCE in 20 years on the monthly chart. LOL.... not that anyone cares....
Bottom Line the trend remains up.... Oh Boy! Ride the wave....
Very stretched above the 50 mma (month moving average) I will post a five year chart below.
Bottom Line the trend remains up.... Oh Boy! Ride the wave....
Very stretched above the 50 mma (month moving average) I will post a five year chart below.
Attachments
Last edited:
robo
TSP Legend
- Reaction score
- 471
Jesse Felder
@jessefelder
1h
NEW POST: Markets Have Bought The Fed’s ‘Transitory’ Narrative Hook, Line And Sinker
https://twitter.com/jessefelder
Markets Have Bought The Fed’s ‘Transitory’ Narrative Hook, Line And Sinker
jessefelder
June 9, 2021
https://thefelderreport.com/2021/06...ds-transitory-narrative-hook-line-and-sinker/
robo
TSP Legend
- Reaction score
- 471
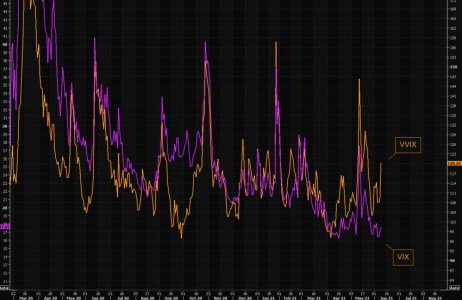
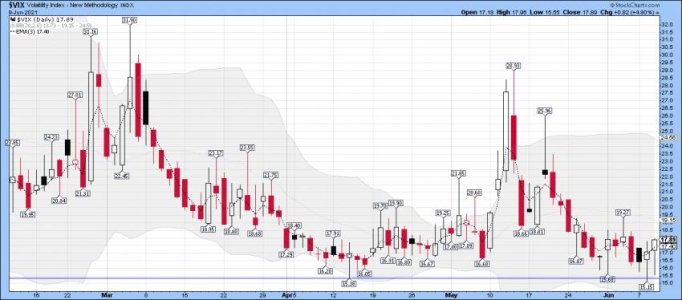
VVIX telling us something?
VVIX continues to refuse "buying" any of the most recent VIX implosion. Note the sharp move higher in VVIX.
We are adding the gap between VVIX and VIX to our risk radar of important "stuff" to watch closely going forward.
Earlier this week we asked ourselves rhetorically;
"The question is if we are reaching the "natural floor" in protection?
Volatility is mean reverting, and thus has a "natural floor". Note that VIX has basically held lows around these levels since April.
Credit protection, CDX IG, has also managed holding this "floor" levels pretty much this entire year.
Markets still lack big new macro narratives, but that will soon change..."
VIX downside is limited from here, while there is a lot of upside potential...
https://themarketear.com/
Attachments
robo
TSP Legend
- Reaction score
- 471

