Bear Cave 2 (Bull Allowed)

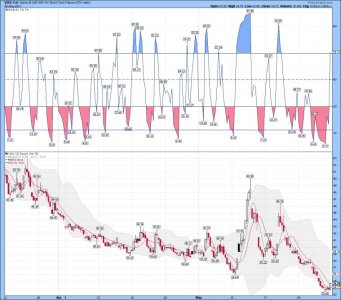
VXX 2 hour chart: A possible ST bounce could be in play..... (note the spike close to the close...... someone was buying protection) That doesn't mean we will sell off next week, but protection is protection. It's the same as reducing some shares after a nice run, and things be looking weak. Risk Management!
 

Attachments

  • a.jpg
    a.jpg
    82.5 KB · Views: 83
Last edited:
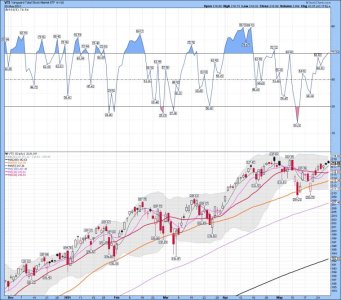
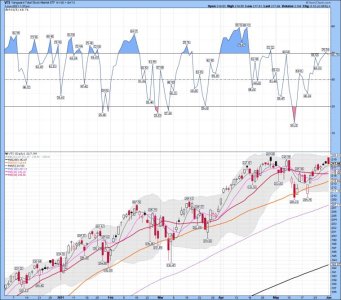
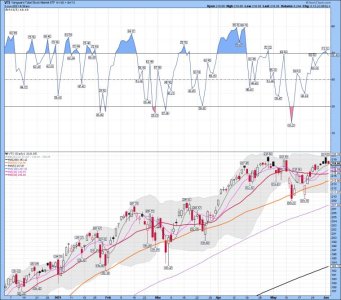
VTI The Total Stock Market...... For now a lower high, but with the Fed pumping 130 billion a month into the market..... who can say what will happen next. Close to tagging the upper BB, 2 black candles, and the RSI be looking weak (RSI 5)..... A time to reduce a tad in my opinion. I like to buy the lower BB tags, and reduce as we get close to the UPPER BB tags or lower.

Bottom line the trend remains up!
 

Attachments

  • a.jpg
    a.jpg
    86.3 KB · Views: 81
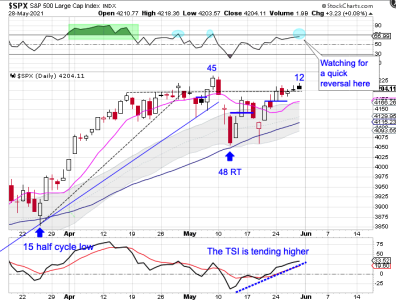
Stocks are on day 12 for the daily cycle and RSI 05 still has not embedded in overbought.
During the advancing phase of the intermediate cycle, RSI 05 tends to get embedded in overbought as evidenced in early April. But notice as stocks broke out to a new high in late April and early May those breakouts were followed by 2 quick bearish reversals in RSI. That could be an early warning that an emerging bearish RSI pattern is beginning to emerge.

Now that stocks are rallying out of their DCL we need to keep a watch on RSI. If it begins to embed once again in overbought, that would indicate a resumption of the intermediate cycle advance. However, a quick bearish reversal would indicate an end to the intermediate cycle advance and the beginning of an intermediate cycle decline. We will use a close below the 4200 breakout level as a warning and a close below the 10 day MA to signal the daily cycle decline.


https://likesmoneycycletrading.wordpress.com/
 

Attachments

  • a.png
    a.png
    61.5 KB · Views: 82
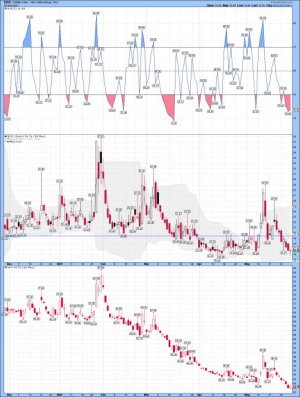
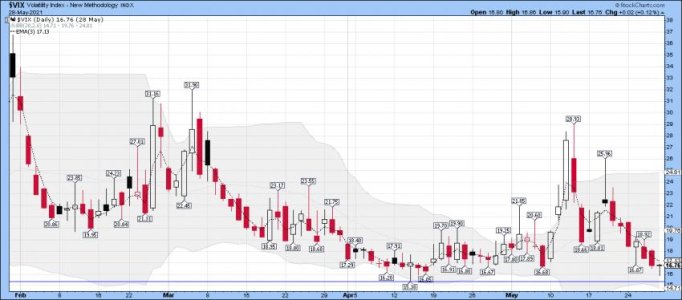
$VIX daily: a closer look.... A higher low? We shall see next week.......
 

Attachments

  • a.jpg
    a.jpg
    54.8 KB · Views: 83
mostly bad news on the re-open front in Asia this week
Reasons enough to get worried?

1) Malaysia reported record-high daily infection cases and deaths, while the country’s vaccination pace has failed to pick up, with Malaysia government advising the broader public to prepare for the worst

2) Australia’s Melbourne and Victoria State have entered a seven-day lockdown in a bid to curb the state's growing COVID-19 infections; Singapore announced a ban on flights from Australia’s Victoria State

3) Taiwan continues to report a rise in daily infections and deaths despite the Level 3 restrictions

4) Thailand has tightened border controls amid discovery of COVID-19 variants

5) Japan is mulling extending the state of emergency that includes Tokyo and other major cities to a new prospective date of Jun 20 amid surging infection cases, with lingering uncertainty over the upcoming Summer Olympics

6) China reported this week a few local cases linked to variants in Guangzhou and Shenzhen.

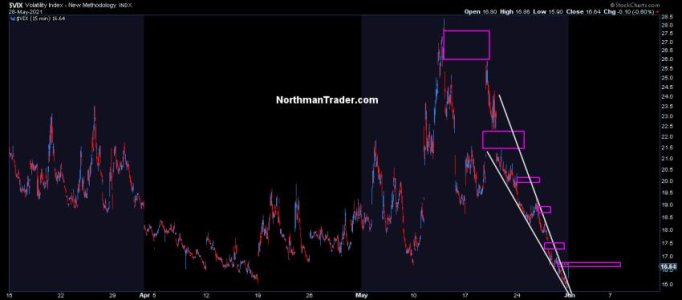
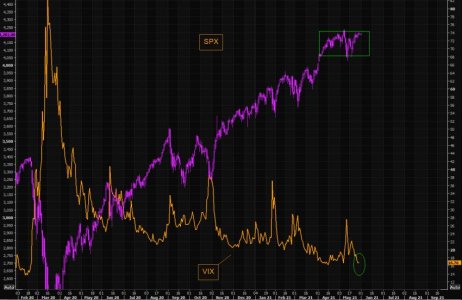
Given the fact SPX is once again in the upper part of the range, and VIX trading at these levels; VIX longs are starting to look like cheap hedges, and protection you buy when you can, not when you must...

https://themarketear.com/
 

Attachments

  • a.jpg
    a.jpg
    63.8 KB · Views: 80
robo,

would you have a recommendation on where I could educate myself about learning how to read/trade the cycle?

thank you,
Max
 
robo,

would you have a recommendation on where I could educate myself about learning how to read/trade the cycle?

thank you,
Max

I would recommend likesmoney if you are just learning. He sometimes runs a 6 week deal for $15.00. Once you get access to his web site just read over things. It will give you a very good idea how cycles can be used as "PART" of your trading. I don't trade based on only cycles, but find it useful for Risk Management.

You can signup for his free reports after that or just try out his service for 6 months as you are learning. I'm not a sub with him because I trend trade, but I "DO" use cycle data as part of my trading. He just points out the cycles and doesn't make calls for the indexes I trade. My current main stock index is VTI at Vanguard, but I sometimes use other indexes.

If you learn the basics you will be fine - Give a Man a Fish, and You Feed Him for a Day. Teach a Man To Fish, and You Feed Him for a Lifetime

Learning how to use cycles for trading, is a good tool to have in your trading tool box!

Take Care....
 

Attachments

  • a.jpg
    a.jpg
    86.6 KB · Views: 77
Last edited:
Likesmoney: Link https://likesmoneycycletrading.wordpress.com/

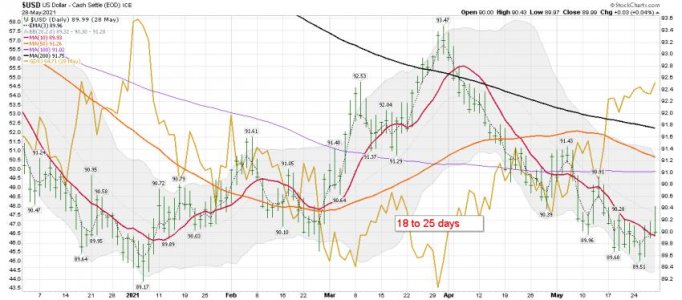
The 5/29/21 Weekend Report
Posted on May 29, 2021

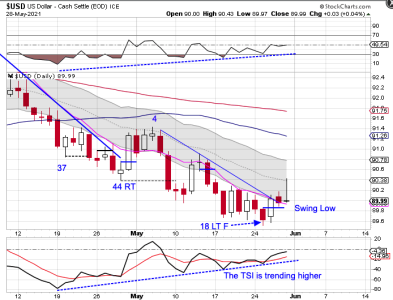
The dollar formed a swing low on Wednesday.

The dollar closed above the 10 day MA and the declining trend line on Friday so will will label day 18 as the DCL. The dollar should go on to turn the 10 day MA high as it rallies out of its DCL. Currently, the dollar is in a daily downtrend. The dollar will remain in its daily downtrend unless it can close back above the upper daily cycle band.
 

Attachments

  • a.png
    a.png
    56 KB · Views: 82
$USD daily: My USD tracking data, and I do track cycles.
 

Attachments

  • a.jpg
    a.jpg
    62.7 KB · Views: 87
Last edited:
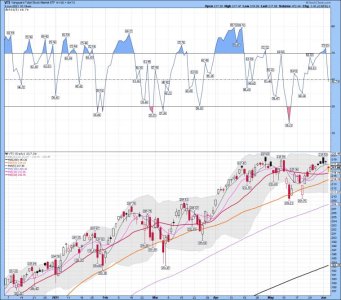
VTI daily - The total stock market) Another go at new all time highs for VTI? It got within pennies of tagging the old marker. Also, a rare 3 black candles in a row pattern. LOL..... maybe 4 today....

Bottom Line: The trend remains up!
 

Attachments

  • a.jpg
    a.jpg
    86.1 KB · Views: 92
SPY daily: Click on the link to see some charts with rare extremes from Jesse. https://thefelderreport.com/2021/06/02/speculators-bet-the-farm-on-stocks/

June 2, 2021

LOL..... I agree we are seeing and hitting some historical extremes, but the trend remains up!


Speculators Bet The Farm On Stocks

""We have seen the assets in leveraged ETFs scream higher over the past year or so. From just under $10 billion in assets at the March, 2020 low, these funds have grown to well over $25 billion in assets. Clearly, small speculators have come to embrace risk in ways we have never seen before."""

jessefelder
June 2, 2021

This post is an excerpt of a report recently featured on The Felder Report Premium.

It’s common knowledge now that the stock market is obscenely valued. To go along with these lofty valuations, we now have an obscene amount of bullish positioning in the equity markets. First, as noted recently by SentimenTrader, small speculators in the futures market have gone nuts recently. The chart below plots the total value of the net position of “non-reportable” in S&P 500 contracts. Never before have we seen these wrong-way traders make such a massive bet on higher stock prices.
https://thefelderreport.com/2021/06/02/speculators-bet-the-farm-on-stocks/
 
Sentiment: I don't trade based on Sentiment, but I do track it.

Where Are We in the Typical Sentiment Cycle?
Jason Goepfert
Published: 2021-06-03 at 07:35:00 CDT
For more than six months, investors have had shown at least Returning Confidence and even Enthusiasm. That's according to the latest correlations to a Typical Sentiment Cycle.

The idea of a repeatable pattern of investor behavior is questionable because the environment and inputs are always different. Human behavior is relatively constant, though, so many use some version of the Cycle popularized by Justin Mamis in his 1999 book, The Nature of Risk.

So, it has been more than six months, 140 days to be exact, that the price pattern of the S&P 500 has had at least a +0.60 correlation to both Returning Confidence and Enthusiasm, while also showing at least a -0.40 correlation to Discouragement and Panic.

That has moved us into the top 15 stretches of time with this kind of confidence among investors.

If we go back to 1928 and compare all periods that are similar to that 1990-1991 period, we can see the correlation we have to each part of the Cycle. When we do that, we get the following estimates for where we are in the Cycle:

Enthusiasm: +0.93
Returning Confidence: +0.77
Discouragement: -0.69
Panic: -0.80

The correlations range from -1.0 (perfect opposite) to +1.0 (perfect symmetry). Based on that, there is a strong probability that we're in the Enthusiasm phase. Last September, the correlations suggested we were moving into the Returning Confidence phase, a good sign. It stayed there for a while, then moved into Enthusiasm near the end of last year.


https://www.sentimentrader.com/blog...l&utm_term=0_1c93760246-75bb644af2-1271291994
 
"Are Sell Signals Useless in Mania Markets?" ..... LOL...... Read the article.... For now the trend remains up.....

During a bull cycle, “buy and hold” will outperform.
However, as stated, you won’t know when that has changed until it is too late.
For example, an individual runs 100 stop signs without consequence and saves an hour driving to work.
It is easy to assume that such activity is “risk-free” because no negative outcome has occurred.
On the 101st event, the driver is hit and killed.
Was applying the brakes and paying attention to the risk worth avoiding the eventual outcome?
The same applies to the markets.
Just because there has been no consequence to investors taking on excess risk over the last 12 years doesn’t mean there won’t be.

--Lance Roberts, "Are Sell Signals Useless in Mania Markets?",
https://realinvestmentadvice.com/technically-speaking-are-sell-signals-useless-in-mania-markets/

Top corporate insiders keep setting new records of the total U.S. dollar amount of insider selling relative to insider buying.


The ratio of the total number of U.S. dollars in insider sales relative to insider purchases in 2021 is by far at an all-time record, surpassing the previous highest marks which were all set near major market topping patterns. This suggests that the upcoming percentage losses for U.S. equity indices will likely surpass those for all previous bear markets with the sole exception of 1929-1932.

Kaplan
https://truecontrarian-sjk.blogspot.com/
 
Last edited:
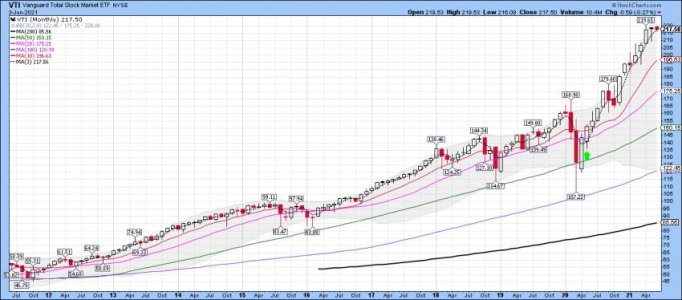
Yearly cycle data - ( 8 to 14 months)

I agree Tom. If you are an investor and use the monthly trend trading data, along with the 10 month MA, the last buy signal was indeed 14 months ago. Not even close to a sell signal since. This cycle is getting a tad stretched.
 

Attachments

  • a.jpg
    a.jpg
    62.6 KB · Views: 73
Back
Top