Bear Cave 2 (Bull Allowed)

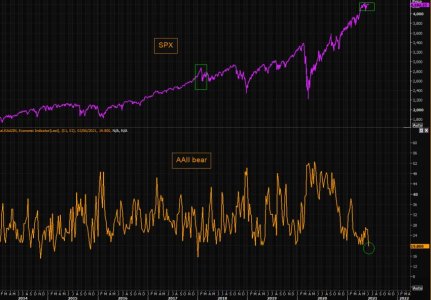
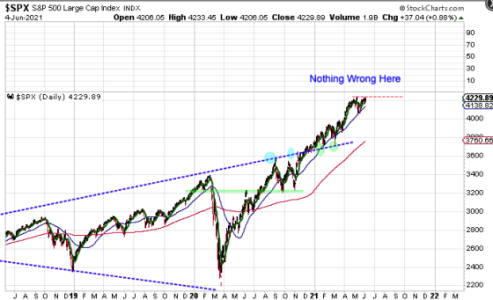
The most bearish chart of the day
Latest AAII bearish readings in total free fall, printing post corona lows and trading at early Jan 2018 levels.

The AAII bear low was shortly followed by the 2018 crash in SPX, partly blamed on rising bond yields and higher inflation. It looks like the last bear has given up for now.

Déjà Vu anyone?
https://themarketear.com/
 

Attachments

  • a.jpg
    a.jpg
    75.5 KB · Views: 72
The Crystal Ball Is Warning of a Fall
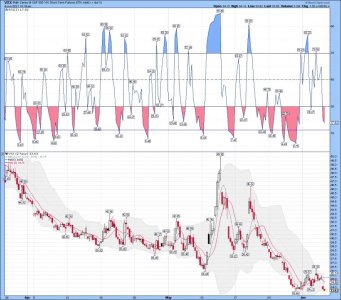
After a great deal of volatility during the first three weeks of May, the index has been range-bound for the past two weeks. It needs some sort of catalyst to break out of this range, and I suspect today’s jobs report will do the trick.

The question, of course is… Which way will it go?

The crystal ball says we’ll go lower from here.

Let me explain…

Long-time readers know about the predictive power of VIX option prices. We’ve used extreme deviations in option prices before as a sort of “crystal ball” for the immediate direction of the stock market.

In other words, traders were willing to pay 100% more for a VIX call option that was out of the money than for a VIX put option that was $0.50 in the money. This tells us that traders who are making bets on the VIX expect the index to move higher over the next two weeks.
https://www.jeffclarktrader.com/market-minute/the-crystal-ball-is-warning-of-a-fall/
 
Excess Liquidity Is Draining From the Market
Jason Goepfert

Published: 2021-06-04 at 07:35:00 CDT
The flood of money that found its way into financial markets is leaving and pooling into economic production. This behavior suggests that Excess Liquidity is plunging.

On our site, we define Excess Liquidity as:

This shows the growth in growth in M2, a broad measure of the money supply that includes deposits and money market funds, and the growth in the economy. In the long term, they tend to grow together. However, when the supply of money grows faster than the economy (represented by the growth in Industrial Production), the excess money is not invested in "things" but rather tends to find its way into financial assets. Therefore, high levels of excess liquidity tend to be positive for stock prices. Low levels of excess liquidity are negative for stocks but are not as strong as the opposite condition.

We can see just how much this figure spiked and then plunged with the latest economic releases.

https://www.sentimentrader.com/blog...l&utm_term=0_1c93760246-131d568a79-1271291994
 
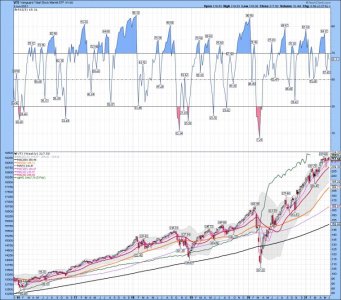
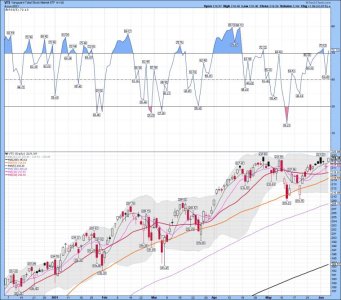
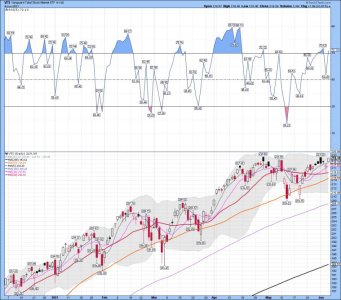
VTI weekly and the M2 supply: VTI is the total stock market at Vanguard.... A index I sometimes like to use for trend trading.
 

Attachments

  • a.jpg
    a.jpg
    96.3 KB · Views: 73
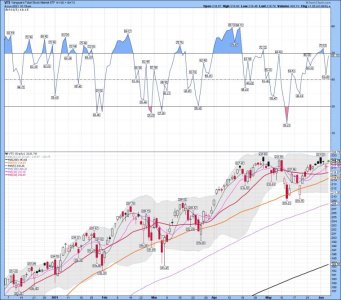
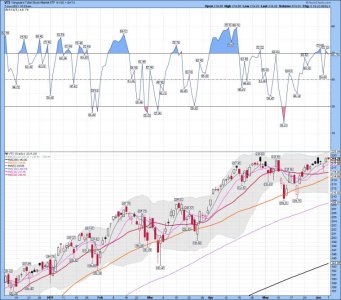
VTI daily: It sure looks like we are heading to new all time highs next week. For now a lower high, but if that was the half cycle low we are heading higher. Watching the show.
 

Attachments

  • a.jpg
    a.jpg
    86.3 KB · Views: 65

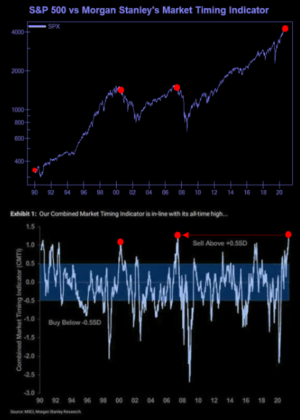
Morgan Stanley is recommending overweight financial, material, consumer staple sectors since "re-opening" stocks have too high an execution risk right now. too much baked into these airlines, hotels, cruises.

Health care and communications are preferred over tech. They under-weighted industrials relative to the market and removed their underweight small caps after a 12% relative under-performance to the general market in the past two months. Small caps are now expected to perform in-line with large caps.

As for the chart, who knows what they're telling accredited investors. Probably something completely different.

Well, someone there is recommending to investors to buy those sectors. But I'm not an investor. LOL..... I agree with you Brother, on what they are saying and what they are actually doing. That's why I trend trade these days and use the total market most of the time. I post the links and comments, but trade the trend! The total stock market covers all the sectors.

Bottom Line: The move up for VTI continues, and the trend remains up..... we shall see if it's topping or making another move higher.....

For the record: I "DID NOT" always trend trade, but it works well in a market like this one. LOL..... "SOMEDAY" that will change, but for now I will just follow the trend and use cycles for Risk Management. Load up at daily cycle lows and reduce as we get deeper into the daily cycle. I would reduce if I still had a position of VTI at Vanguard. I'm flat right now and only ST trading in other accounts.
 

Attachments

  • a.jpg
    a.jpg
    86.7 KB · Views: 56
Last edited:
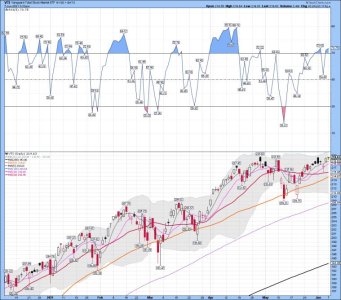
VTI daily: So if you are a investor, and riding the waves, we are now back to the May high.....

Have a nice day, and good trading
 
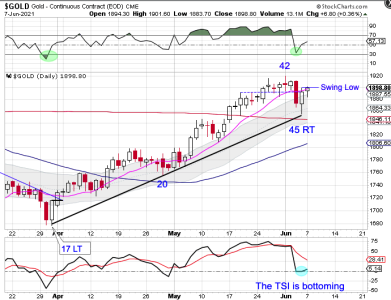
Gold daily cycle: Got gold?

Gold Delivers Buy Signal

While gold did not break below the daily cycle trend line, Gold did print its lowest point on Friday, day 45. That places gold very deep in its timing band for a daily cycle low. The quick bullish RSI 05 reversal is characteristic of gold continuing its intermediate cycle advance. That aligns with gold begin in a daily uptrend. Since gold formed its swing low above the lower (and upper) daily cycle band that signals that gold remains in its daily uptrend and triggers a cycle band buy signal. So we will label day 45 as the DCL.

https://likesmoneycycletrading.wordpress.com/2021/06/07/gold-delivers-buy-signal/
 

Attachments

  • a.png
    a.png
    46.1 KB · Views: 53
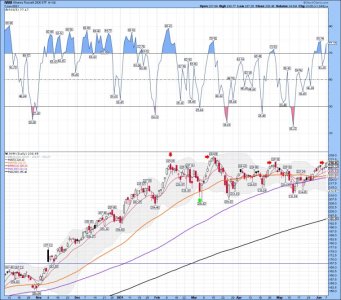
IWM daily: I'm sure not going to chase this move. I like to buy when we tag the 50 dma or the lower BB. I'm not a MO MO kind of trader.

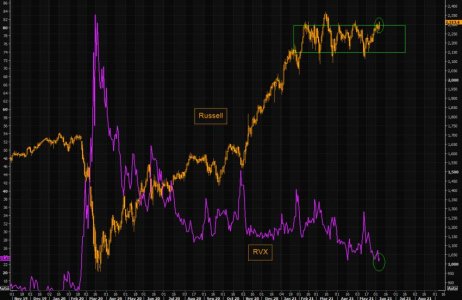
Russell - breaking above range mania highs?

The Russell has been stuck inside the great range since early this year. It is currently trading at levels where we haven't seen small caps close at since that failed break out attempt Feb/March.


All time highs are still "up there", but a close here or higher and Russell takes out the first part of the range mania range.

Second chart shows IWM gamma. We have just entered small long gamma land, but the biggest gamma exposure in IWM continues to be the downside (negative gamma).

As BofA noted last week, CCC junk is at junkiest levels since 2007 and it moves in tandem with the small/large caps ratio.


Time for chasing small caps...?
https://themarketear.com/
 

Attachments

  • unnamed (1).jpg
    unnamed (1).jpg
    64 KB · Views: 56
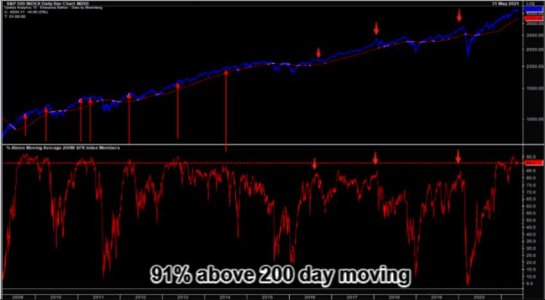
SPX daily: Say what! 91%..... LOL..... maybe it's going higher...... only the shadow knows for sure! However, there are indicators that support a move to all time highs. If that happens I will just trade the trend and not pick a top. I will trade what is happening and not what I think will happen.

Bottom Line: The trend remains up..... Easy money Monday has completed..... We shall see what Mrs. Market wants to go higher the rest of the week. I will say it again, the market looks tired, but remains in a uptrend. Price overrides everything and drives the trend.....

This one is elevated
Some 91% of S&P names are trading above their 200 day moving average.

Yes, we have seen even higher readings, but this is rather high. If this is a "cap" to the break out scenario is to be seen, but it should all things equal be a "mini drag" on a possible violent break out.

Elevated readings have led to SPX selling off before, but it is not a must.
https://themarketear.com/
 

Attachments

  • a.jpg
    a.jpg
    39.6 KB · Views: 57
Last edited:
IWM daily: Helping to move VTI up again today. As was pointed out above, there are reasons to like small caps, but I remain flat for now. IWM just moved slightly above the Feb 21 high marker. Not much of a gain for 4 months unless you are trading the swings. We shall see if IWM can tag new highs this week.

Bottom Line: The trend remains up, but a tag of the upper BB has not been kind to IWM in the days after the tag the last four months. We shall see if things are changing.
 

Attachments

  • a.jpg
    a.jpg
    92.2 KB · Views: 51
Last edited:
Back
Top