robo
TSP Legend
- Reaction score
- 471
The Forum works well on MOBILE devices without an app: Just go to: https://forum.tsptalk.com
Please read our AutoTracker policy on the
IFT deadline and remaining active. Thanks!
$ - Premium Service Content (Info) | AutoTracker Monthly Winners | Is Gmail et al, Blocking Our emails?
Find us on: Facebook & X | Posting Copyrighted Material
Join the TSP Talk AutoTracker: How to Get Started | Login | Main AutoTracker Page

 www.hussmanfunds.com
You're welcome. The Carter's were great people.Thank you "robo" very much for your posting/ sharing here. I especially appreciated your link-post Tuesday from Hussman-Funds; I waded through all the Econ-numbers & charts (which are very worthwhile though I struggle to comprehend well & seek to heed), when I got to his unexpected shift and heartfelt comments about the "peacemakers" & particularly J. E. Carter & wife; great humans, great POTUS & 1st-Lady, faithful in their spiritual faiths to Him - as much as they could be.

 thefelderreport.com

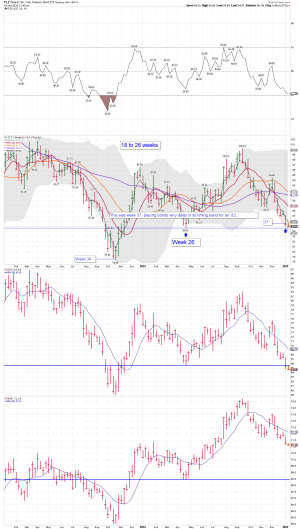
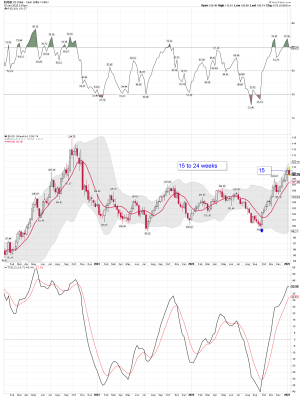
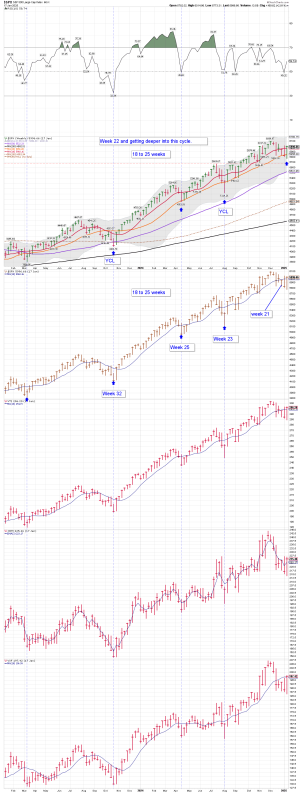
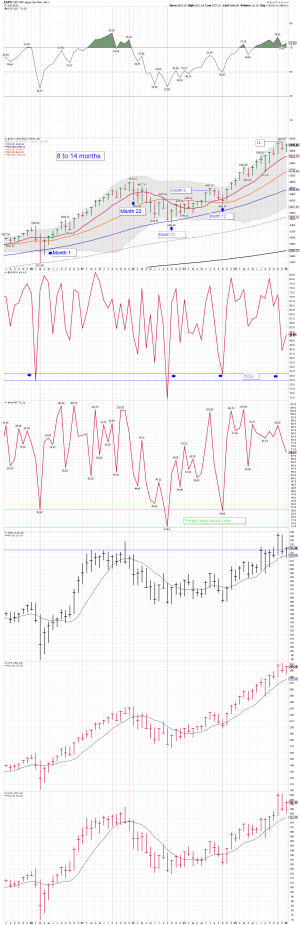
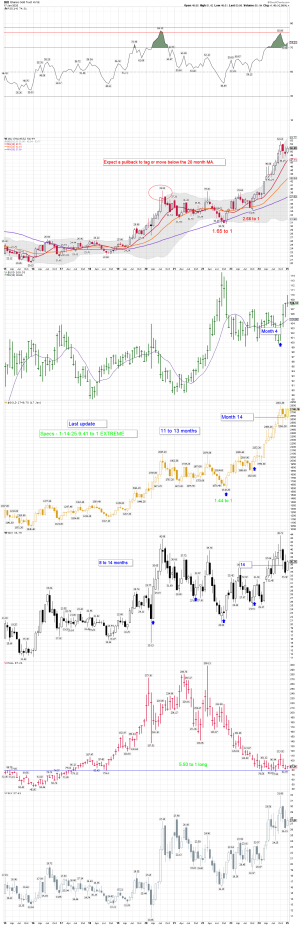
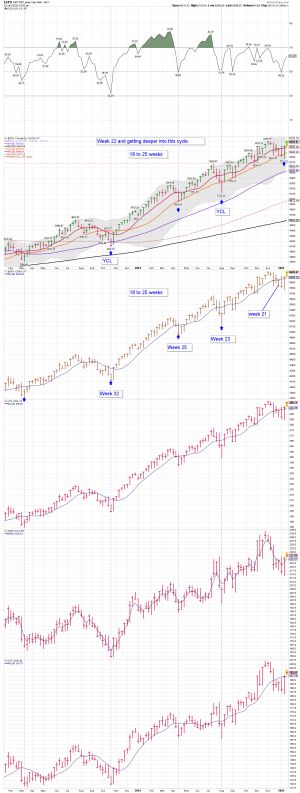
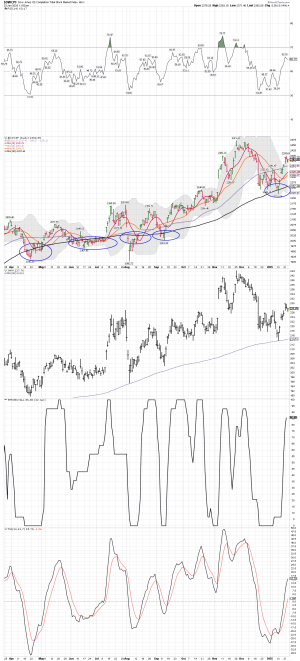
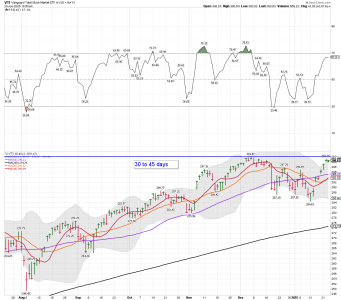
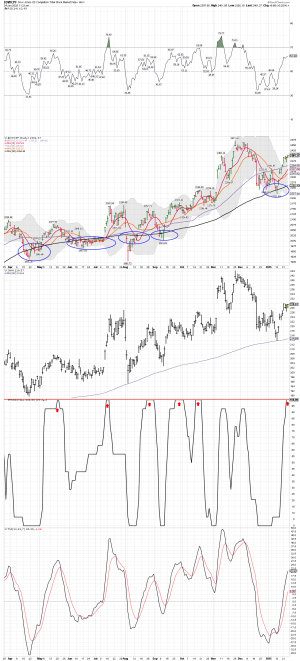
 likesmoneycycletrading.blog

 www.mauldineconomics.com