-
The Forum works well on MOBILE devices without an app: Just go to: https://forum.tsptalk.com
-
Please read our AutoTracker policy on the IFT deadline and remaining active. Thanks!
-
$ - Premium Service Content (Info) | AutoTracker Monthly Winners | Is Gmail et al, Blocking Our emails?
Find us on: Facebook & X | Posting Copyrighted Material
-
Join the TSP Talk AutoTracker: How to Get Started | Login | Main AutoTracker Page
You are using an out of date browser. It may not display this or other websites correctly.
You should upgrade or use an alternative browser.
You should upgrade or use an alternative browser.
Bear Cave 2 (Bull Allowed)
- Thread starter robo
- Start date
robo
TSP Legend
- Reaction score
- 471
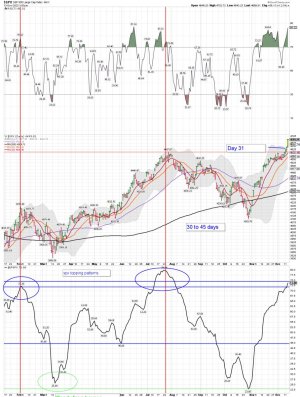
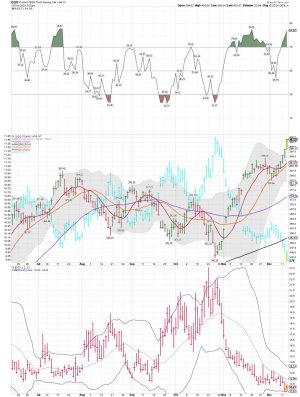
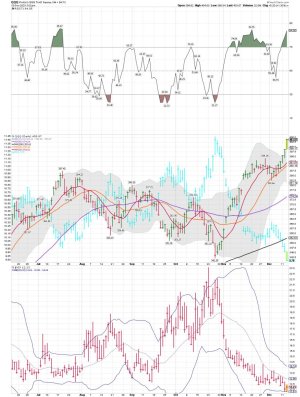
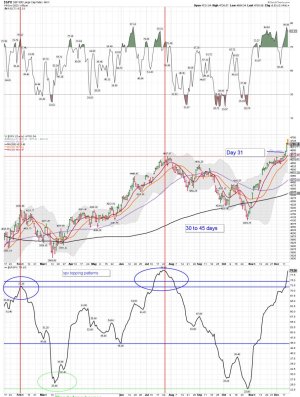
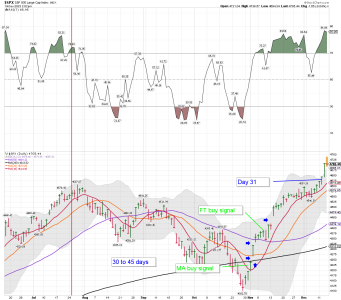
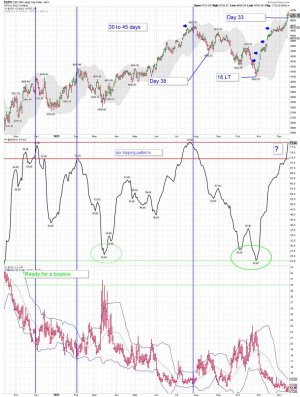
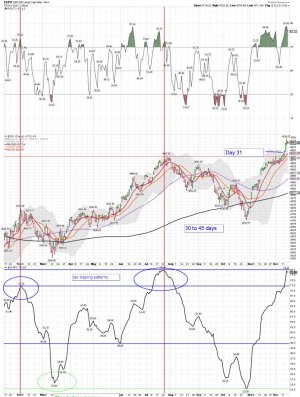
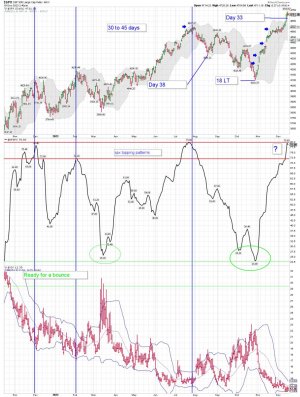
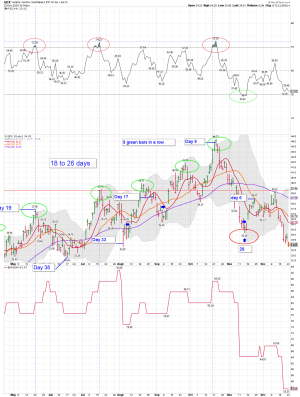
SPX/QQQ daily: Day 33 of the current daily cycle, BPSPX topping pattern in play, a move above the upper BB, a move under 11.50ish for the VIX, and a few other Risk Management indicators.
Bottom Line: The odds for trading on the long-side have increased. However, I still DO NOT have a sell signal. We shall see how it plays out. The move up continues, but stretched above the 10 day MA.
Bottom Line: The odds for trading on the long-side have increased. However, I still DO NOT have a sell signal. We shall see how it plays out. The move up continues, but stretched above the 10 day MA.
Attachments
robo
TSP Legend
- Reaction score
- 471
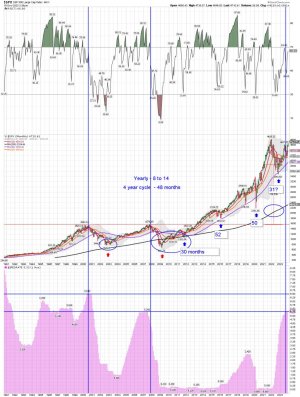
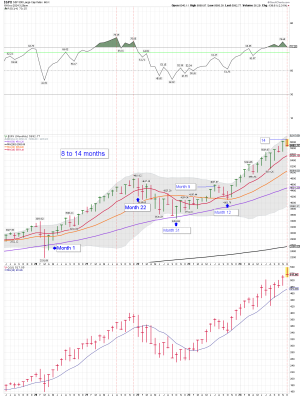
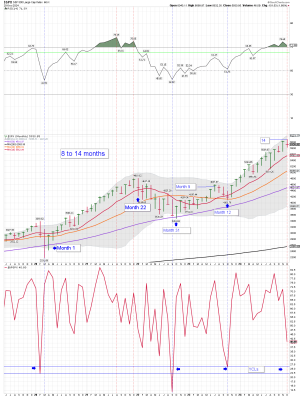
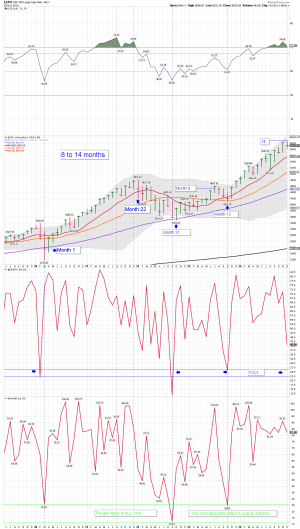
SPX monthly:
SPX/BPSPX/VIX daily:
The Secret Life of Fed Pivots
Print Friendly, PDF & Email
John P. Hussman, Ph.D.
President, Hussman Investment Trust
December 2023
Speculative bubbles collapse. I don’t know how to make that point simpler, but somehow it needs to be said. Still, attention to investor psychology – speculation versus risk-aversion – can help enormously. A market crash is nothing more than low risk-premium meeting risk-aversion. Indeed, when investors become risk-averse, they treat safe liquidity as a desirable asset rather than an inferior one, so creating more of the stuff does nothing to support stocks. That’s how the market could collapse in 2000-2002 and 2007-2009 despite aggressive and persistent Fed easing.
The yearning affection that investors hold for Fed pivots is quietly driven by the fact that nearly all the pivots occurred when the S&P 500 already stood at historically normal or depressed levels of valuation. The associated market returns were typically a function of two factors: favorable valuations, coupled with an improvement in market internals. It’s those factors – the central elements of our investment discipline – that actually correlate with favorable market outcomes.
The Secret Life of Fed Pivots - Hussman Funds
Attachments
robo
TSP Legend
- Reaction score
- 471
I thought I would update the gold miners / gold data. It is a sector I trade. I currently have NO positions, but looking to make a ST small trade using GDX as it is hitting an oversold extreme on the daily chart. All of my ST trades are small ones.... Beer Money... Not doing much trading in front of the changeover in DC. We all watched what the dollar did yesterday. I'm staying very nimble in the weeks ahead.
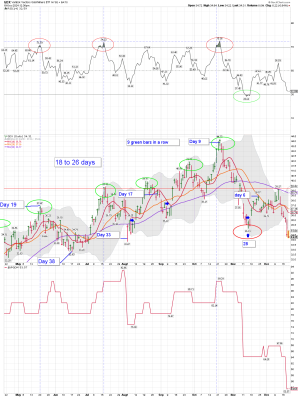
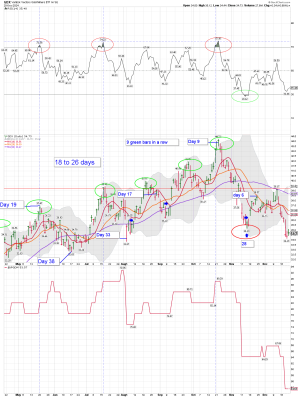
GDX daily: Remains oversold, the weekly trying to find an ICL.
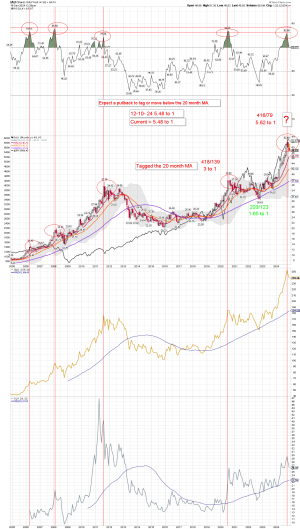
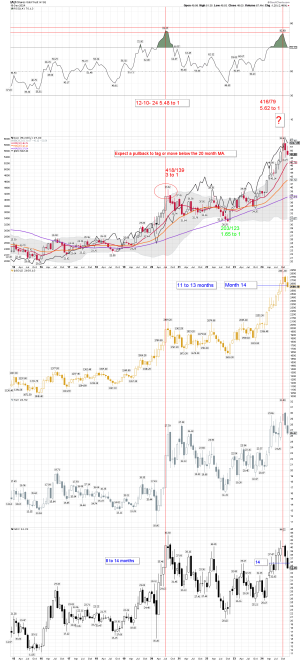
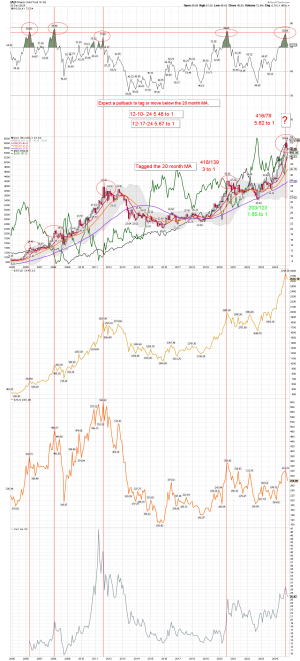
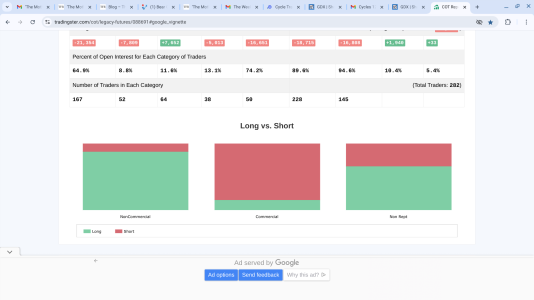
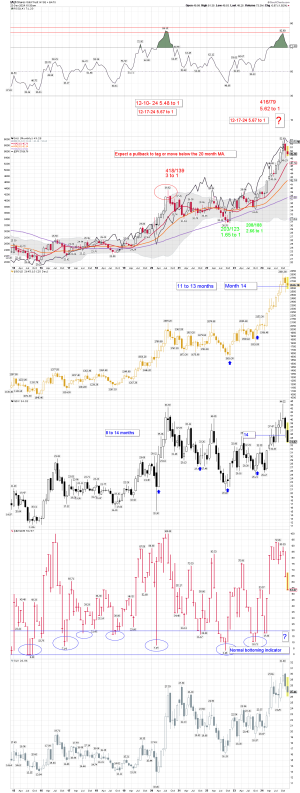
IAU/COT monthly: I'm still looking for IAU to tag or under cut the 20 month MA during the YCL. IAU remains extended and the commercial COT for gold is currently @ a 5 to 1 ratio short to long. This is a huge warning signal. I posted both charts below.
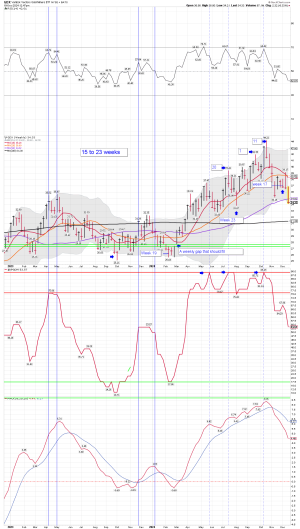
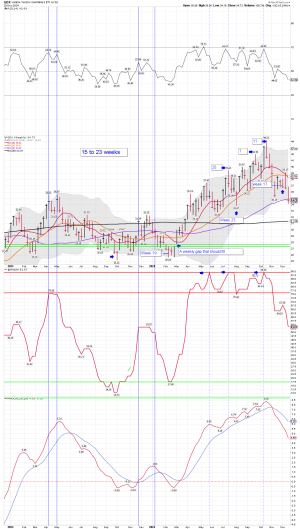
GDX weekly: Fill the gap under $28.00ish?
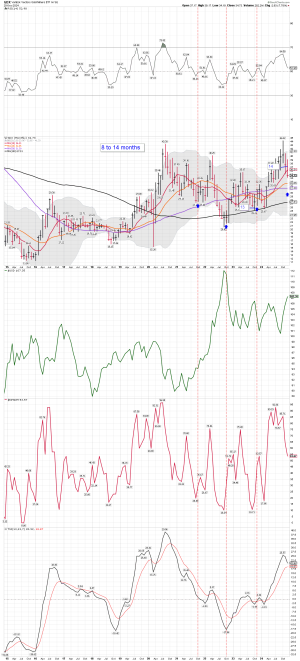
GDX monthly: The YCL looks to be in play
Attachments
Last edited:
robo
TSP Legend
- Reaction score
- 471
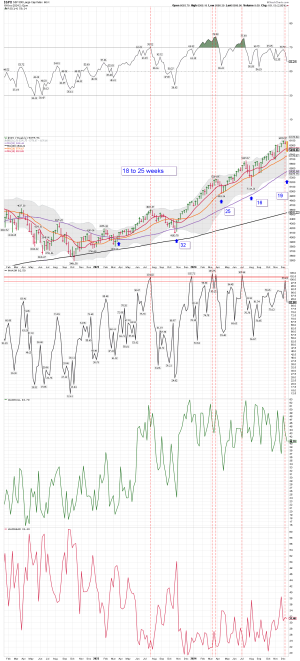
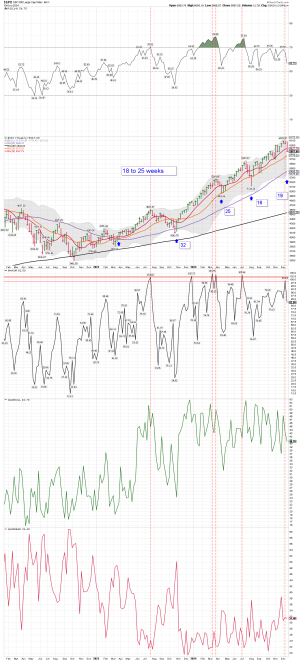
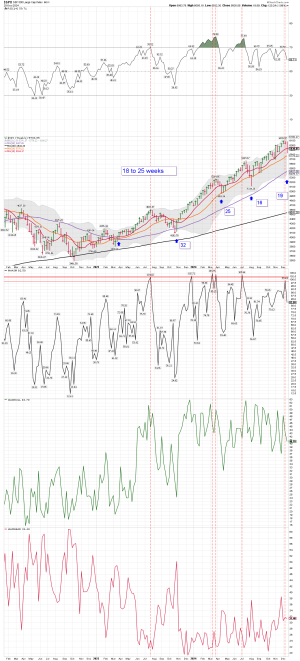
SPX weekly: The SPX moved below the 10 week MA @ week 20 of this cycle. We should see a tag or undercut of the 20 week MA, and maybe a move down into the YCL. However, that could all get put on hold if Santa comes to town.
I "only" track the NAAIM and AAII bull/bear as I watch for topping indicators when the SPX is getting deeper into the weekly cycle. During other times I don't use it unless it is at a rare extreme. I'm always looking for extremes, and as we get close to cycle tops, they sometimes start to appear.. The NAAIM group of traders sometimes get close or over a 100 as the weekly cycle is completing. That is a warning signal for me to reduce shares of VTI at Vanguard. The main data I use is the cycle data, and the other indicators are used for risk management. I don't use sentiment for trading..... I leave that to Tom and others, but again, I do track it. They do an excellent job of it. I'm mainly a cycle guy these days, with several other indicators I also use.
SPX monthly:
Attachments
Last edited:
robo
TSP Legend
- Reaction score
- 471
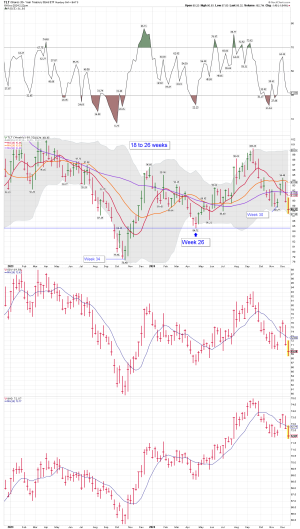
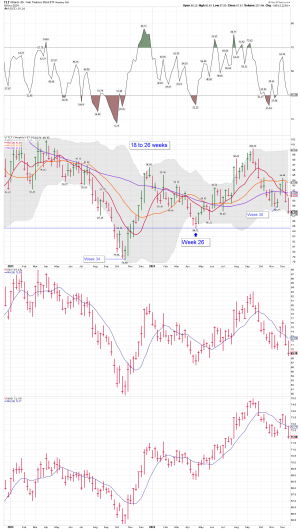
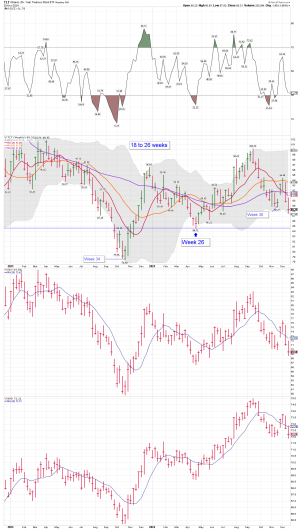
TLT/EDV/BND weekly chart: I might have jumped the gun as I tried to time the ICL. We shall see if we get a higher low. Not looking good right now, but TLT did get a bounce off the lower BB as buyers are coming in. I'm looking for a higher low....
Long TLT, and BND
Long TLT, and BND
Attachments
robo
TSP Legend
- Reaction score
- 471
Thanks! Back for awhile why I wait for the change out in DC.Had it been a year since your last post? Wow.
Good to see you back!
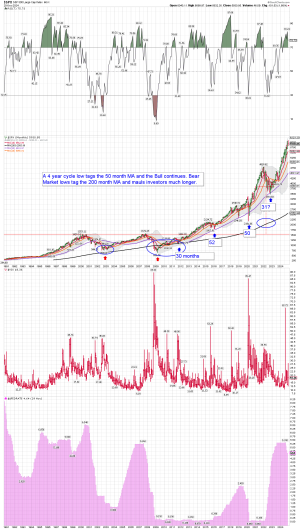
There hasn't been much to say since the last YCL for the SPX. It's time to get ready for the next one.... A normal revert to the mean would be a tag of the 50 month MA. Most traders doubt that will happen, but the data indicates it has above average odds! As always, we shall see how it plays out since NO ONE knows for sure. Lots of crazy stuff going on all over the world right now, that could move the markets and the dollar.
Attachments
robo
TSP Legend
- Reaction score
- 471
The Market Ear | Live news, analysis and commentary on what moves markets and trading | The Market Ear
The Market Ear | Live news, analysis and commentary on what moves markets and trading
Attachments
robo
TSP Legend
- Reaction score
- 471
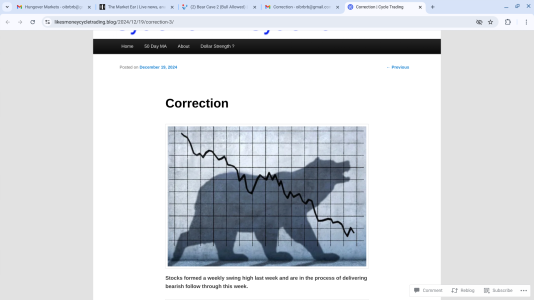
SPX weekly: Looking for the next ICL, and keeping an eye out for the YCL. We shall see if the possible Santa rally delays the YCL.

 likesmoneycycletrading.blog

Correction
Stocks formed a weekly swing high last week and are in the process of delivering bearish follow through this week. This is week 19, placing stocks in the early part of its timing band for an ICL. A…
Attachments
robo
TSP Legend
- Reaction score
- 471
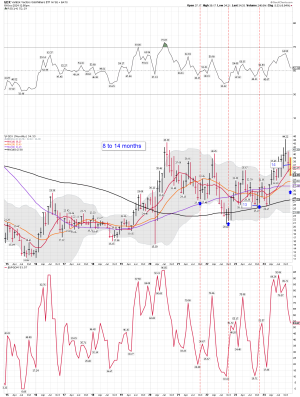
IAU/GOLD/SLV/GDX: Based on the data I use, and the current patterns I'm seeing, my opinion is IAU is headed down to tag or undercut the 20 month MA.
The YCLs are all currently in play. 2025 is looking good for buying some MT positions for the miners, and the metals. But not at these prices.... IAU has been trending up above its 10 month MA for 14 months. It has been a nice run....
Good luck to those trading this sector.....
I currently have NO positions in this sector, but I do like to trade it.

 www.goldenmeadow.eu
The YCLs are all currently in play. 2025 is looking good for buying some MT positions for the miners, and the metals. But not at these prices.... IAU has been trending up above its 10 month MA for 14 months. It has been a nice run....
Good luck to those trading this sector.....
I currently have NO positions in this sector, but I do like to trade it.
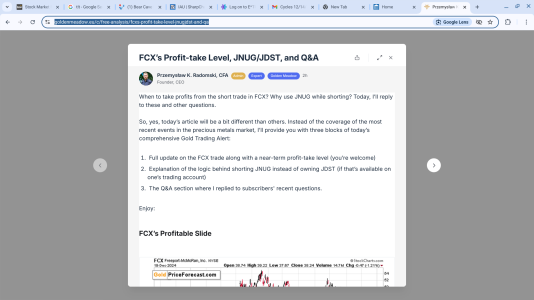
FCX’s Profit-take Level, JNUG/JDST, and Q&A | Golden Meadow®
When to take profits from the short trade in FCX? Why use JNUG while shorting? Today, I’ll reply to these and other questions. So, yes, today’s article will be a bit different than others. Instead of the coverage of the most recent events in the prec...
Attachments
Last edited:
robo
TSP Legend
- Reaction score
- 471
robo
TSP Legend
- Reaction score
- 471
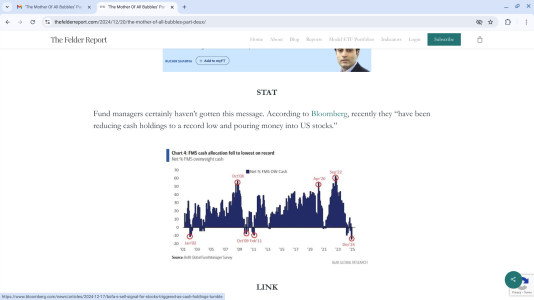
The Mother of all Bubbles:

 thefelderreport.com

‘The Mother Of All Bubbles’ Part Deux
Below are some of the most interesting things I came across this week. Click here to subscribe to our free weekly newsletter and get this post delivered to your inbox each Saturday morning. LINK Following up on his earlier piece published a couple of weeks ago, Ruchir Sharma writes, "by some point
 thefelderreport.com
Attachments
robo
TSP Legend
- Reaction score
- 471
IAU/GOLD/SLV: Waiting to buy the miners again. (Gold COT) - A 5.67 to 1 ratio is very extreme for the commercial trades
GDX weekly: Will the gap around $28.00ish fill during the next YCL? (Yearly cycle low)
GDX monthly: I want to see a confirmed YCL for GDX before I start scaling back into a MT miner position using the weekly chart. (Medium Term) The move down into the YCL is in play.... We shall see how it plays out as the change over in DC gets closer. The wildcard is the dollar.
GDX daily: Oversold!
Gold COT: The commercial ratio continues to be a warning indicator.
Attachments
Last edited:
robo
TSP Legend
- Reaction score
- 471
Some bullet comments and a few charts to look over:
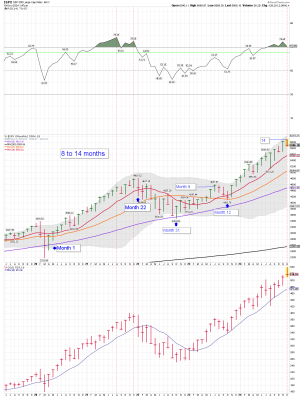
SPX and the YCL: A tag or an undercut of the 20 month MA is a normal move lower, for the YCL on the SPX monthly chart. We shall see if Santa can delay/extend this cycle some more.
I am waiting on a confirmed YCL, and a possible move lower into a 4 year cycle low. For the record: These days I mainly trade the weekly charts.
SPX monthly chart: The SPX remains in an uptrend above the 10 month MA.
SPX weekly chart: Holding around the 10 week MA after tagging and undercutting it this week. The dip was bought Friday, so we shall see if the YCL will get extended into next year.
TLT/BND weekly chart:
SPX and the 4 year cycle low chart:
I currently have NO position in the SPX/SPY as I wait to see how all of this plays out. To much crazy stuff in DC going on for me to be long stocks.
Long TLT and BND for a MT trade as it looks like TLT is trying to form an ICL.
Bottom Line: The monthly trend remains up and the SPX remains on a buy signal if using the monthly charts. And that is how most investors and traders are positioned. Buffett, and the insiders are doing something different....
Good Trading/investing to all in the months and weeks ahead.
Have a nice weekend!
Attachments
Last edited:
robo
TSP Legend
- Reaction score
- 471
The SPX and the YCL: For now, the monthly trend remains up...
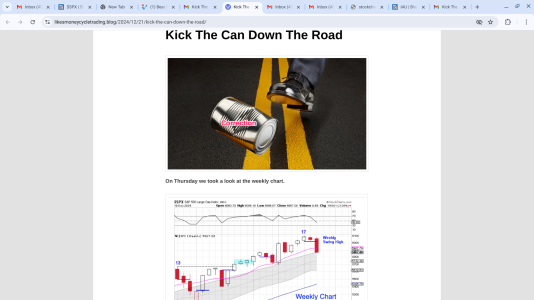
Cycles - https://likesmoneycycletrading.blog/2024/12/21/kick-the-can-down-the-road/
Cycles - https://likesmoneycycletrading.blog/2024/12/21/kick-the-can-down-the-road/
Attachments
Last edited:
robo
TSP Legend
- Reaction score
- 471
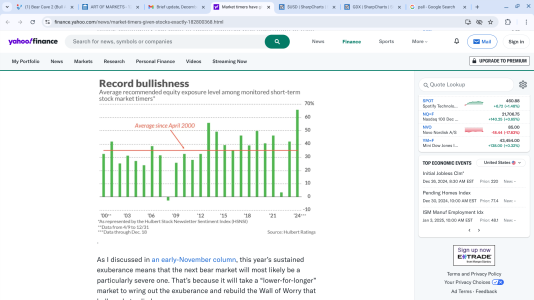
Mark Hulbert:
3 min read

 finance.yahoo.com
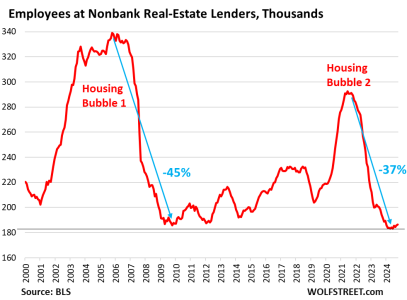
Keep an eye on the housing market..... It looks like problems are coming...
3 min read
Market timers have given up on stocks — which is exactly what you want to see now
Hopeful signs in the short term, but the longer-term picture for stocks is troubling.
Keep an eye on the housing market..... It looks like problems are coming...
Attachments
robo
TSP Legend
- Reaction score
- 471
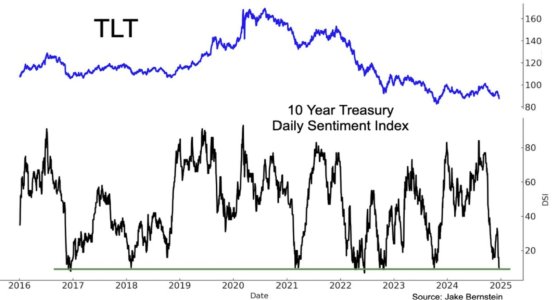
TLT: Getting closer to a possible ICL.
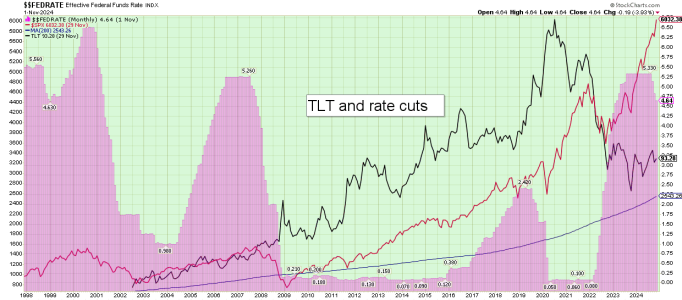
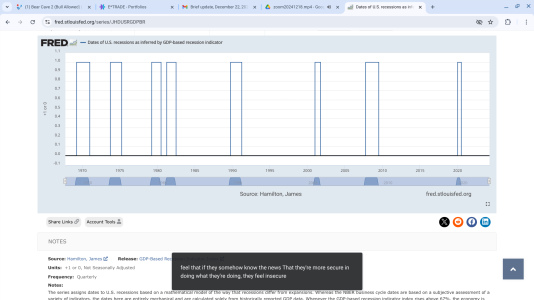
Why TLT? I think we are headed into a recession.....
If we have a recession, and the Fed cuts rates, TLT could pop 30-40% over the next year. With that said, I could be wrong, and TLT keeps moving lower..... So, I placed my bet that more rate cuts are coming in the next year.

Why TLT? I think we are headed into a recession.....
If we have a recession, and the Fed cuts rates, TLT could pop 30-40% over the next year. With that said, I could be wrong, and TLT keeps moving lower..... So, I placed my bet that more rate cuts are coming in the next year.

Dates of U.S. recessions as inferred by GDP-based recession indicator
Graph and download economic data for Dates of U.S. recessions as inferred by GDP-based recession indicator (JHDUSRGDPBR) from Q4 1967 to Q2 2024 about recession indicators, GDP, and USA.
fred.stlouisfed.org
Attachments
Last edited:

