Bear Cave 2 (Bull Allowed)

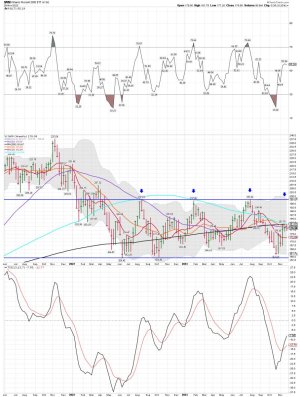
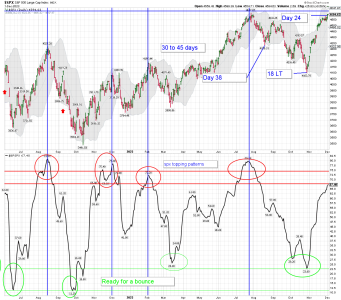
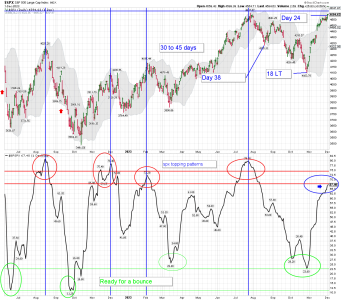
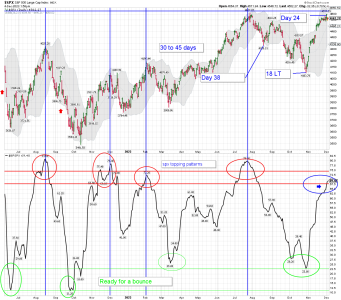
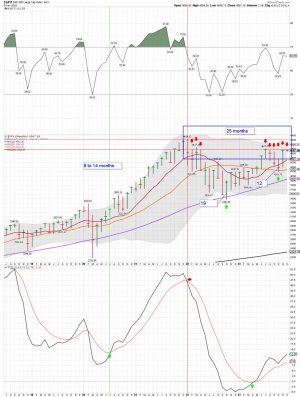
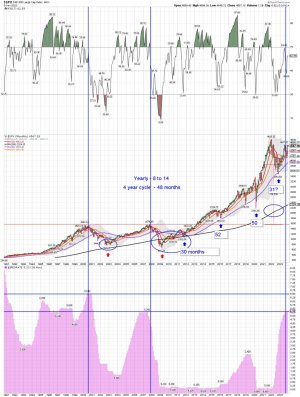
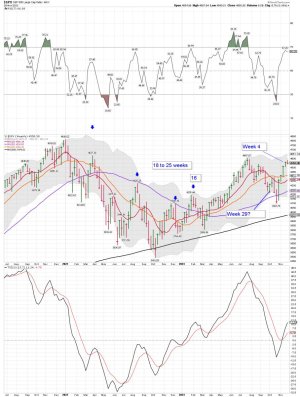
SPX weekly: The SPX is still stretched to far above its 10 week MA. A BT of the 20 week could be coming. That opinion is based on the chart below. Usually a move up this quick results in some sideways action as the 10 week MA needs to get back above the 20 week MA - "IF" this move up has legs, and for now it sure looks that way. The 10 week MA has turned up so we shall see how this ICL plays out.

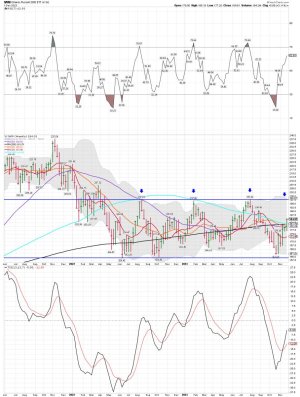
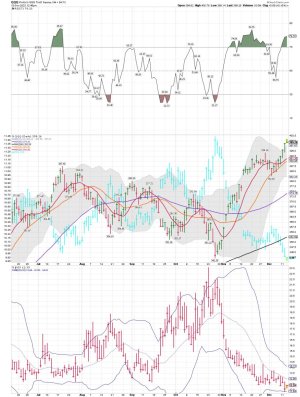
IWM weekly: IWM still remains below the 20,50,100, and 200 weeks MAs. Waiting on the big move that's coming.
 

Attachments

  • a.jpg
    a.jpg
    153.9 KB · Views: 99
  • a.jpg
    a.jpg
    160.3 KB · Views: 98
Last edited:
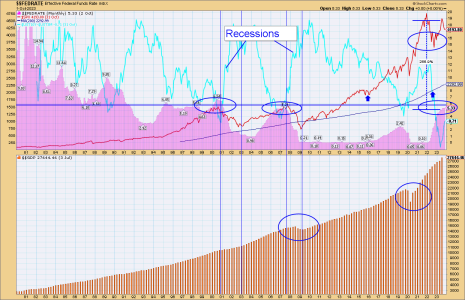
Just wanted to throw sumpthin in this thread that I saw yesterday. I don't visit here much, so I hope it hasn't been covered yet already. Just an observation that may be relevant in anticipating future movement.
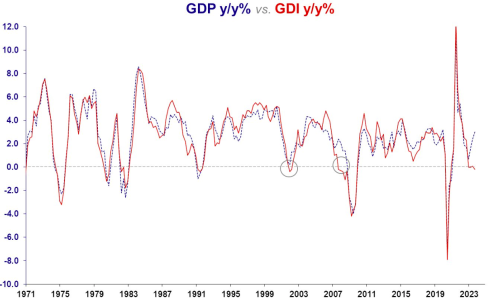
Dot-com recession (March 2001 to November 2001) / The Great Recession began in December 2007 and ended in June 2009
All of this (below) is from:
https://twitter.com/spomboy?ref_src=twsrc^google|twcamp^serp|twgr^author

It appears that GDI has only been negative y/y while GDP was positive twice before-- 2001 and 2007.....in those incidents, it was not a bullish indicator.

GDP1.PNG

(reply)
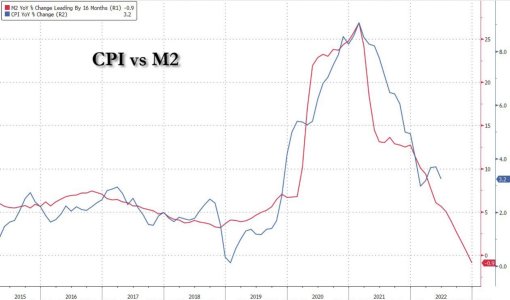
Yep, we're already in a deflationary recession, but the FED doesn't realize it yet due to lagging/massaged CPI data


GDP2.jpg

 
Thanks for that! In case anyone was wondering:

Why do gross domestic product (GDP) and gross domestic income (GDI) differ, and what does that imply?

Access Denied (not sure why the title says access denied. It's a .gov website.)


It appears that GDI has only been negative y/y while GDP was positive twice before-- 2001 and 2007.....in those incidents, it was not a bullish indicator.
 
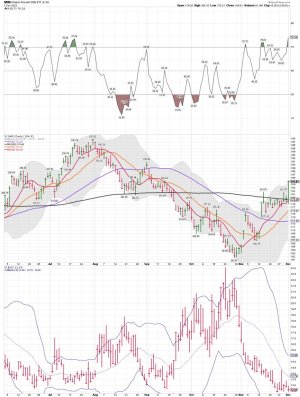
IWM weekly: All I can say is.... nice! We shall see how this IC plays out.

IWM daily: A very nice move above the 200 day MA. We shall see how the daily handles the upper BB tag.....

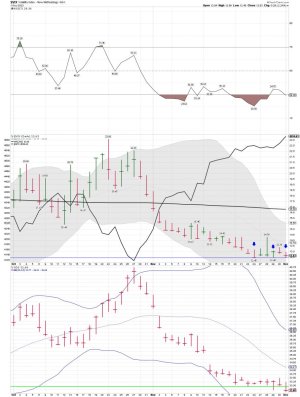
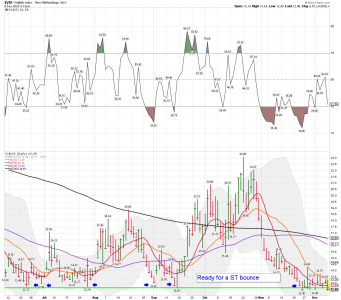
$VIX daily: The VIX continues to bounce around the 12.50ish area. Not much fear out there......
 

Attachments

  • a.jpg
    a.jpg
    160.1 KB · Views: 88
  • a.jpg
    a.jpg
    160.2 KB · Views: 88
  • a.jpg
    a.jpg
    128.1 KB · Views: 89
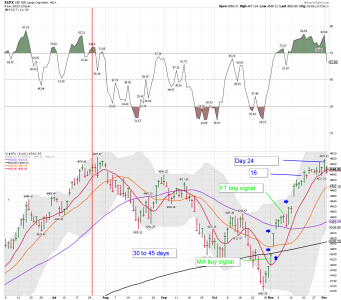
SPX daily: The move up continues.... We shall see how the SPX handles the current overbought conditions.


Intellectually bearish
From one of the most accurate strategists on Wall Street, Hartnett: "...everyone thinks we rally into Valentine’s Day, everyone emotionally bullish, but still intellectually bearish and likely to stay that way until leadership changes".
https://themarketear.com/newsfeed

This is the Check-Engine Light of the Market
Jeff Clark | Dec 1, 2023 | Market Minute | 2 min read
Take down the tree. Turn off the lights. Put all the ornaments away.

Santa has already been to Wall Street.

Investors who are expecting even greater gifts from the stock market between now and the end of the year are setting themselves up to be disappointed.

The S&P 500 bottomed in late October at about 4150. It closed on Wednesday at 4550.

That’s nearly a 10% gain in just one month!

But the market needs fuel to keep the rally going. And it looks to me like the tank is running dry.
This is the Check-Engine Light of the Market | Jeff Clark Trader
 

Attachments

  • a.png
    a.png
    93.1 KB · Views: 92
  • a.jpg
    a.jpg
    125.7 KB · Views: 92
  • a.png
    a.png
    77.8 KB · Views: 91
  • a.png
    a.png
    66.8 KB · Views: 91
Last edited:
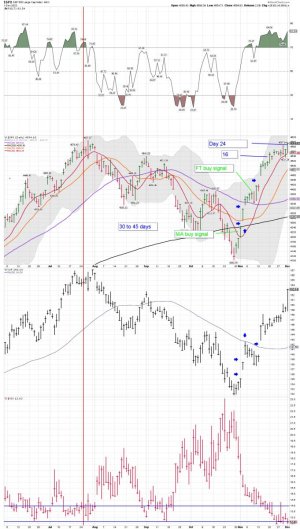
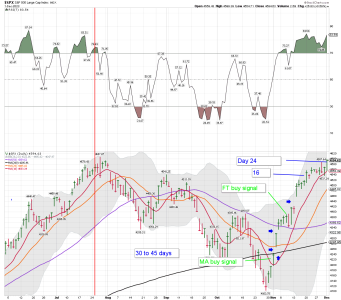
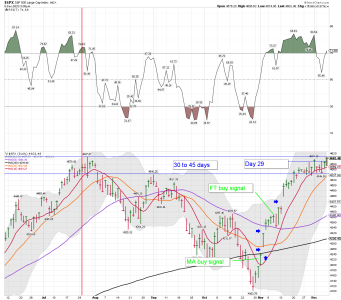
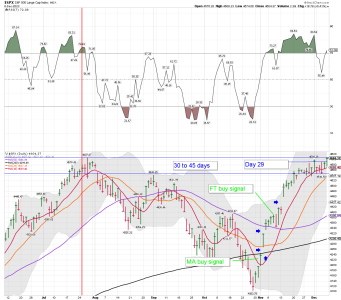
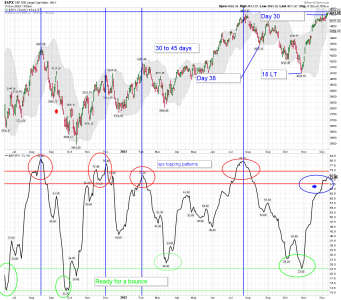
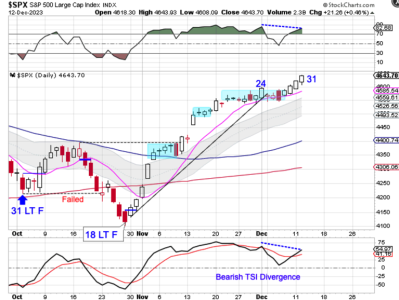
SPX daily: After a very nice move off the bottoming pattern, it's now day 25 into the current daily cycle. The SPX is overbought, the topping pattern signal is in play, and the SPX looks tired. We shall see how it all plays out.

Bottom Line: Still NO SELL signal.
 

Attachments

  • a.png
    a.png
    93.7 KB · Views: 82
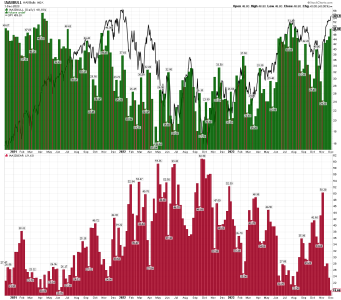
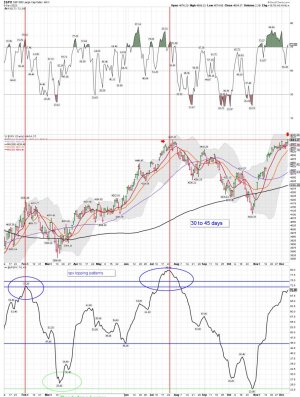
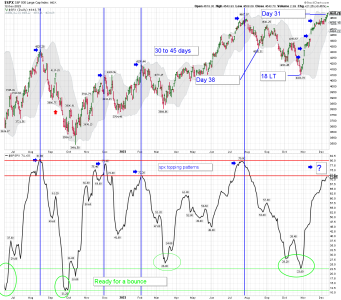
The SPX and the BPSPX topping pattern: It's day 25 into this daily cycle and the BPSPX is tagging the 70ish numbers. We shall see how much higher it can go.

Bottom Line: The buy signal remains in play, but the odds for a pullback into the next DCL are increasing. I still expect a back-test of the 20 day MA or lower as we move into the next DCL.
 

Attachments

  • a.png
    a.png
    94.2 KB · Views: 82
  • a.png
    a.png
    76 KB · Views: 81
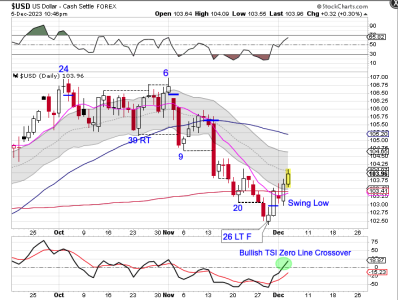
This will put pressure on some sectors..... We shall see if this dollar move has legs.

The explanation for this relationship is based on two well-known premises. A barrel of oil is priced in U.S. dollars across the world. When the U.S. dollar is strong, you need fewer U.S. dollars to buy a barrel of oil. When the U.S. dollar is weak, the price of oil is higher in dollar terms.

What is the relationship between gold and the dollar?
Gold prices in India and the Indian rupee's value are dependent on the U.S. dollar's value in the international market. The gold rate in the market and its relation to the U.S. dollar is inversely proportional. If there is a rise in the U.S. dollar value, gold value decreases and vice versa.


Dollar Rebound – Update

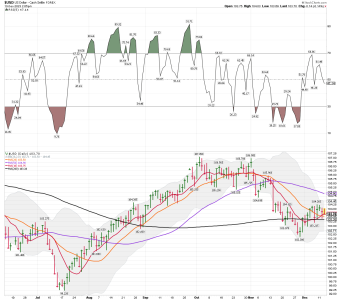
The dollar closed above the converging 10 day MA and 200 day MA on Thursday to signal that day 26 hosted the DCL. Then the dollar lost both of the 10 day MA and 200 day MA on Friday to cause the status of the daily cycle to be uncertain.

The dollar closed back above the converging 10 day MA and 200 day MA on Monday. The dollar delivered bullish follow through on Tuesday, turning the 10 day MA higher, to confirm that day 26 was the DCL. We will be watching the declining 50 day as the dollar rallies out of its DCL. How the dollar reacts to the declining 50 day MA will signal if the 3 year cycle low has been set or is it still out in front.
Dollar Rebound – Update | Cycle Trading
 

Attachments

  • a.png
    a.png
    38.5 KB · Views: 70
Last edited:
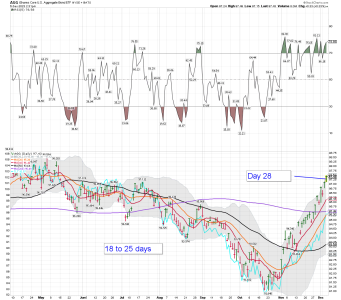
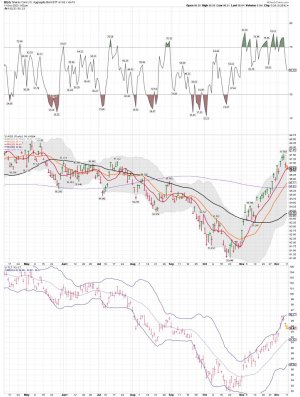
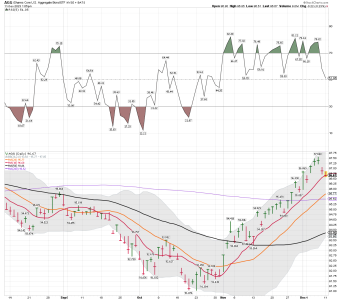
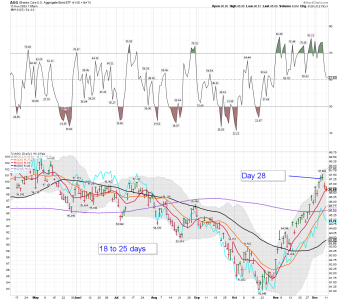
AGG and TLT daily: It's been a really nice DC - daily cycle. One would think a pullback is coming as we move into the next DCL - daily cycle low.
 

Attachments

  • a.png
    a.png
    94 KB · Views: 70
Last edited:
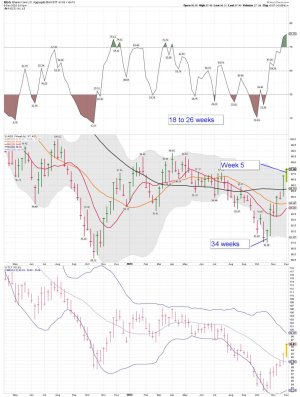
AGG weekly: It's only week 5, so we are early into this IC..... I'll be watching to see how AGG handles the upper BB tag as AGG is a tad overbought. However, a pullback should be a op to add.
 

Attachments

  • a.jpg
    a.jpg
    145.3 KB · Views: 91
$VIX daily: Looks to be ready for a ST bounce, and SPX is getting closer to a move down into the next DCL. We shall see how it plays out.
 

Attachments

  • a.png
    a.png
    80.3 KB · Views: 95
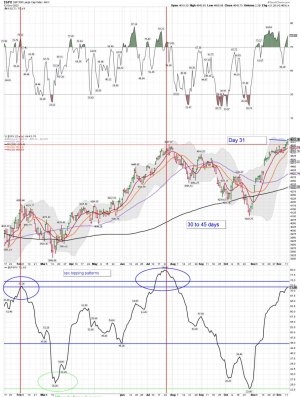
BPSPX topping pattern: Getting close to completing...... We shall see how it handles the next daily cycle....
 

Attachments

  • a.jpg
    a.jpg
    182 KB · Views: 89
  • a.png
    a.png
    75.9 KB · Views: 88
SPX daily: This has been one sweet DC - daily cycle. The move up continues.....
 

Attachments

  • a.png
    a.png
    91.8 KB · Views: 82
AGG daily: Back testing the 10 day MA.
 

Attachments

  • a.jpg
    a.jpg
    158 KB · Views: 85
  • a.png
    a.png
    63.9 KB · Views: 83
  • a.png
    a.png
    94.4 KB · Views: 82
FOMC Meeting

Stocks broke bullishly out of consolidation on Friday and continued higher into Tuesday, ahead of Wednesday’s FOMC meeting.

Tuesday was day 31 for the daily cycle. That places stocks in its timing band for a daily cycle decline. As I motioned in the Weekend Report, breakouts that occur late in the daily cycle are often not sustained. Stocks are currently in a daily uptrend. Stocks will remain in its daily uptrend unless they close below the lower daily cycle band.
FOMC Meeting | Cycle Trading
 

Attachments

  • a.png
    a.png
    231.9 KB · Views: 72
  • a.png
    a.png
    178.5 KB · Views: 72
  • a.png
    a.png
    91.6 KB · Views: 70
  • a.jpg
    a.jpg
    182.3 KB · Views: 71
The Fed effect, and I'll be watching. We shall see how it all plays out. Some crazy stuff going on in DC too.

USD daily:


The U.S. Dollar
Like the U.S. dollar.

The dollar is fascinating. Some analysts consider the dollar a safe haven. Others say the dollar seems to do well when the U.S. economy is doing well.

The truth is, both camps are correct...

In many ways, the dollar is the ultimate safe haven. As the global reserve currency, it’s backed by the full might of America. That’s why during times of uncertainty, you can see the dollar strengthen quickly.

When looking for a safe haven, the U.S. has many attractive options. Whether it’s Treasuries, stocks, or just plain old cash, the U.S. has something for everyone.


Why GM’s embarrassing EV hiccup could skyrocket 1 battery firm

80,000 Americans are anxiously awaiting the delivery of their new Hummer EVs.

They’ve signed the paperwork… handed over the deposit…

But so far this year — GM has delivered just 2 electric Hummers. Two!


“This is just the tip of a $10 Trillion iceberg,” says the best-selling financial author Nomi Prins, “No automaker is safe.”

She discovered a new battery stock that could save America’s floundering EV market.

One firm using AI has unlocked a novel solution…

She calls it “Forever Lithium.”

The CEO of Jeep said: “You have to secure your supply. If not, you’re out of business.”

And one company that supplies it could mint more EV millionaires than the rise of Tesla.


On the other hand, let’s say the U.S. economy is outperforming the rest of the world by a wide margin. In such a scenario, the dollar can also strengthen.

During such a time, investors are afraid of putting their money to work in emerging markets. While emerging markets can deliver better returns, they’re also riskier. And if the global economy is lagging the U.S., then investing in the U.S. is the best move.

What about when the dollar is declining in value? That scenario happens for a couple different reasons as well.

The first is when other countries are successfully outcompeting the U.S. for investment flows. If growth prospects are considered more attractive outside the U.S., there will be less demand for the dollar.

The second scenario is when investors see weakness in the U.S. economy. This means they expect the Fed to cut interest rates to help the economy out.

Free Trading Resources

Have you checked out Jeff's free trading resources on his website? It contains a selection of special reports, training videos, and a full trading glossary to help kickstart your trading career – at zero cost to you. Just click here to check it out.

More Weakness Coming
Right now, we’re trending more closely to the second scenario, which results in dollar weakness.

The reasoning is simple. Higher rates should cool off the economy. And it’s unlikely the Fed will get the balancing act of raising rates high enough to tamp down inflation – while not sinking the economy into a recession – exactly right.

If the Fed overshoots raising rates, the economy will eventually start cooling down. At this point, the Fed will go back to its old playbook of cutting rates and printing money to help stimulate the economy.

Although more and more central banks are expected to hold rates – or even cut them – next year, the Fed is likely to be among the first to act.

This was true in the opposite direction, too. The Fed was the first major central bank to raise rates in 2022.

It was the Fed that kicked of the dollar’s period of strength in 2022. And it will be the Fed that kicks off this next period of dollar weakness.

In fact, the decline in the dollar has already started. At the beginning of October, DXY was up nearly 4% year-to-date. As of writing, DXY is now up just 0.37%.

Based on my analysis, I expect at least another 10% decline or so before the dollar stabilizes.

Happy trading,

The Dollar Decline Has Started | Jeff Clark Trader
 

Attachments

  • a.png
    a.png
    69.6 KB · Views: 69
For traders only:

QQQ and PSQ daily: Getting late in the cycle: I bought some PSQ..... However, everything I track using my system remains on a buy signal. When we get deep into a daily cycle I reduce or take a small short position for some Beer Money.

Filled Buy 500 PSQ Market 9.8899 11:47:32 12/13/23
 

Attachments

  • a.jpg
    a.jpg
    160.7 KB · Views: 70
Back
Top