Bear Cave 2 (Bull Allowed)

If we define an equity Bear Market by a 20% Drop, then we've already had it, right?:scratchchin:

I was thinking the same thing, but it's interesting that the bear market was already near the lows when the yield curve re-inverted in July of 2022. And we haven't had a recession yet. Maybe it is different this time? :dunno:

tsp-111023a.gif
 
Hey Robo. I see you made an IFT on Friday morning...

Can you confirm if the TSP processed this with a COB 11/10?

I called the TSP on Thursday and they told me they were closed on Friday, which I unfortunately took to mean they were not processing transactions, but I see they posted share prices for Friday, so I'm not sure what's going on.

Thanks!

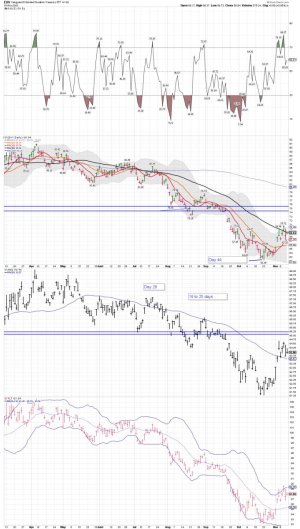
You can make it for today. I just wanted to get more funds back into the G Fund after a nice run for the F Fund. I only pay close attention when moving in or out of the C or S funds. Most of my funds are in Vanguard now and I'm using TLT and EDV not AGG. I make the moves on the same day.

I actually started building a short position Friday even though the SPX buy signal remains in play.

11/10/2023 15:09:48 Bought 100 PSQ @ 10.3949
11/10/2023 14:53:46 Bought 100 SDS @ 35.395
 

Attachments

  • a.jpg
    a.jpg
    125.1 KB · Views: 115
  • a.png
    a.png
    74 KB · Views: 109
Last edited:
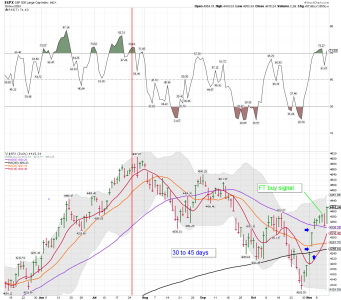
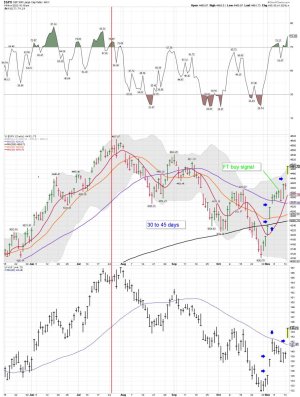
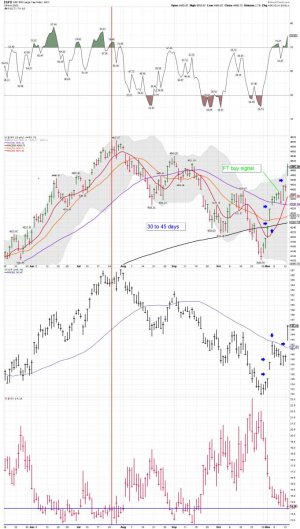
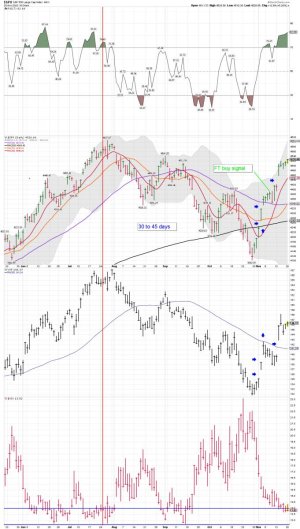
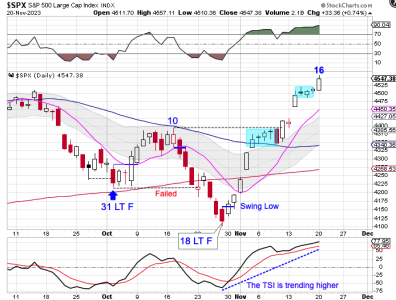
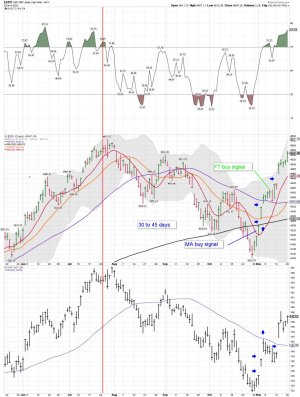
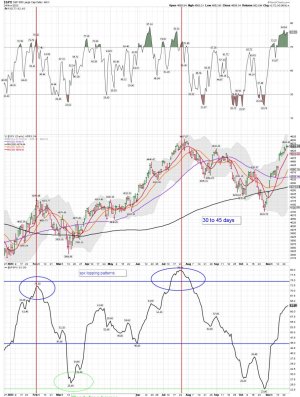
SPX daily: The SPX remains on a buy signal, and we are in the best 6 months, but there are other things to consider when placing position size.

Extremely weak relative breadth, during a time were this government is in real trouble for trying to get anything done. Follow the signals, stay long, but use care and risk management when placing position size.

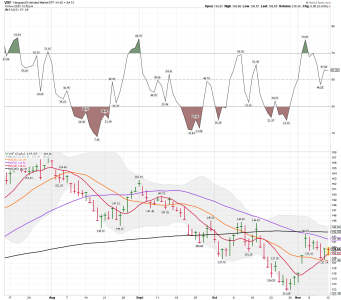
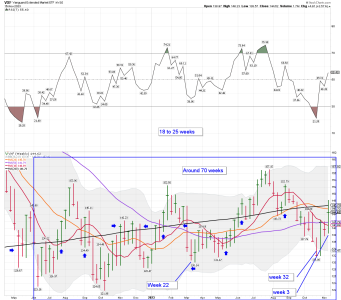
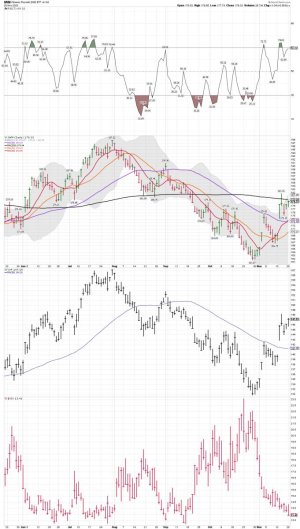
VXF daily: Remains below the 50 and 200 day MA's.

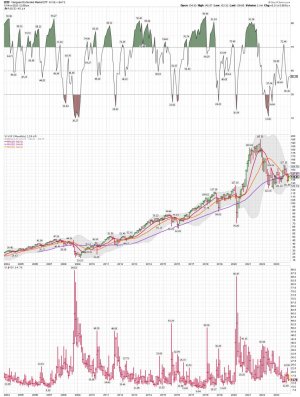
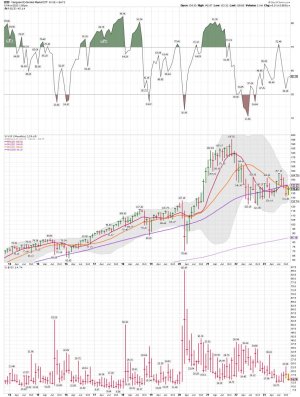
VXF monthly: Still NO LT buy signal for investors based on the data I use for monthly signals. VXF remains below its 10, 20, and 50 month MAs.

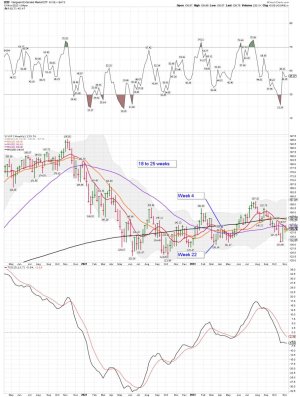
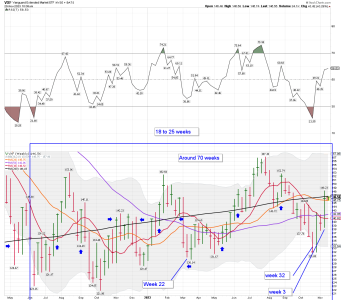
VXF weekly:
 

Attachments

  • a.jpg
    a.jpg
    162.9 KB · Views: 118
  • a.png
    a.png
    63.9 KB · Views: 112
  • a.jpg
    a.jpg
    187.3 KB · Views: 119
  • a.jpg
    a.jpg
    164.5 KB · Views: 115
  • a.jpg
    a.jpg
    154.7 KB · Views: 116
Last edited:
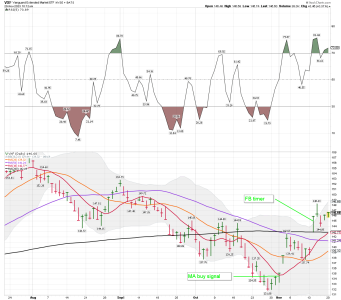
SPX/VXF daily: The buy signal remains in play, but getting a tad stretched above the 10 day MA. The move above the upper BB and the gaps left behind should cause one to reduce long positions. However, some will chase. I'm still on a buy signal, and will add to my MT short position.... A very nice run since moving above the 10 day MA late in the daily cycle and causes a buy signal. Day 10 since moving above the 10 day MA. I trade this signals at Ameritrade using a trading account. Some of the time I will be long and short at the same time. During extreme oversold or overbought setups.

A very nice move for VXF too this morning.

VXF weekly: A nice move above the 10, and 50 week MA. The 20 and the 200 week MAs be up next. A weekly buy signal for VXF ( a move above the 10 week MA). We shall see how it plays out.
 

Attachments

  • a.jpg
    a.jpg
    156.2 KB · Views: 112
  • a.jpg
    a.jpg
    174.6 KB · Views: 107
Last edited:
SPX daily: This will be day 11 since the buy signal.


The VIX is Reaching the Danger Zone
Imre Gams | Nov 15, 2023
There’s a value range in the VIX from about 11 to 13.50 that has historically resulted in some fierce market selloffs. I refer to this as the “danger zone.” As a point of reference, the VIX is currently trading at around 14.20. Not too far away from the danger zone.

The last time the VIX fell into this danger zone was on September 14. That coincided with the Nasdaq and the S&P 500 both selling off for over 9%. And the time before that was on July 27. That marked a quick sell-off in the S&P 500 of 5.9% in just 17 days.

https://www.jeffclarktrader.com/market-minute/the-vix-is-reaching-the-danger-zone/
 

Attachments

  • a.jpg
    a.jpg
    123.7 KB · Views: 98
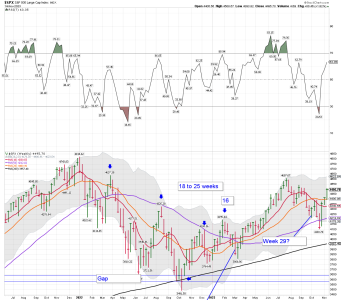
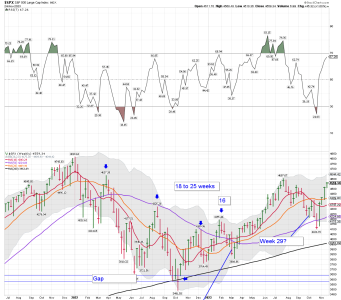
SPX weekly: It's still very early into this ICL during the best 6 months. We shall see how it plays out. The last run for the SPX on the weekly chart it trended above the 10 week MA for 20 weeks.
 

Attachments

  • a.png
    a.png
    77.2 KB · Views: 105
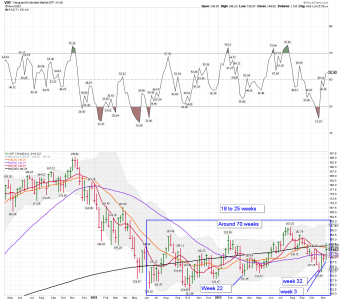
VXF weekly: Since the 2022 July low, which was around 70 weeks ago, VXF has struggle to hold above the 200 week MA. Once again the 200 week is being tested. We shall see how it plays out. There have been some nice runs to trade using VXF, but far from a Bull Market. Maybe VXF is just making higher lows and moving sideways, or we are getting closer to the next mover lower. I will just trade the signals..... For now VXF remains on a weekly buy signal. We shall see if it can move back above the 200 week MA and start a nice trending move for several week.
 

Attachments

  • a.png
    a.png
    76.4 KB · Views: 92
  • a.png
    a.png
    67.4 KB · Views: 92
Soft Selling a Hard Landing
"The S&P 500, Nasdaq 100, and even the Russell 2000 responded with what we often call a “fast, furious, prone-to-failure” clearing rally, eliminating the short-term oversold conditions of late-October by moving from the bottom to the top of their respective Bollinger bands (from -2 to +2 standard deviations around their 20-day averages)."

https://www.hussmanfunds.com/comment/mc231120/


The move up continues....
 

Attachments

  • a.jpg
    a.jpg
    125 KB · Views: 98
  • a.png
    a.png
    68.8 KB · Views: 95
  • a.png
    a.png
    65 KB · Views: 97
Don’t Call Me Bearish… It’s Just Math
Jeff Clark | Nov 21, 2023 | Market Minute |

In other words, my forecast for 2024 is bearish. My year-end target for the S&P 500 is 4080. That’s about 10% below where the index closed on Friday.
https://www.jeffclarktrader.com/market-minute/dont-call-me-bearish-its-just-math/


Cycles:

Stocks printed a new daily cycle high on Monday.

Monday was a day 16 for the daily equity cycle. The new high on day 16 shifts the odds towards a right translated daily cycle formation. Stock are now getting a bit stretched above the 10 day MA and may need to consolidate to allow the 10 day MA catch up to price.
Stocks are also stretched above the 10 week MA. And stocks are running into resistance at the August high. This is an area where we can see some profit taking after a nice 4 week run up.

In the short term I would advise some caution. But my intermediate view for stocks is bullish. Which is something that I detailed in the recent Weekend Report.

https://likesmoneycycletrading.blog/2023/11/20/possible-take-profit/


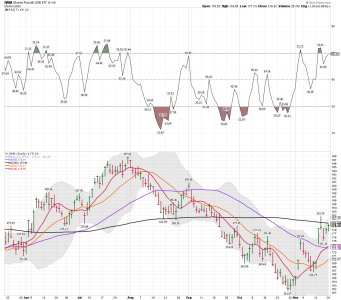
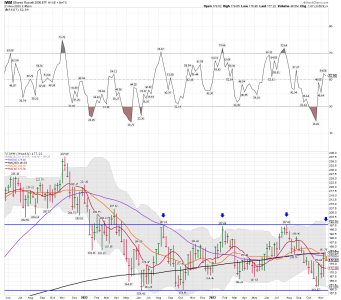
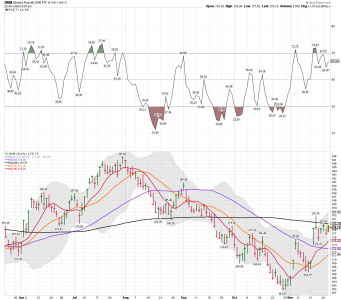
SPX and IWM daily charts: Both remain on a buy signal, but IWM still unable to move above resistance at the 200 day MA.

IWM weekly: It remains below the 20, 50, and 200 week MA. Not what you want to see from the leader. We shall see how it plays out in the weeks ahead.

Bottom Line: The move up continues.....
 

Attachments

  • a.png
    a.png
    43.5 KB · Views: 84
  • a.jpg
    a.jpg
    157 KB · Views: 90
  • a.jpg
    a.jpg
    118.4 KB · Views: 88
  • a.png
    a.png
    71.5 KB · Views: 86
  • a.png
    a.png
    71.6 KB · Views: 86
Last edited:
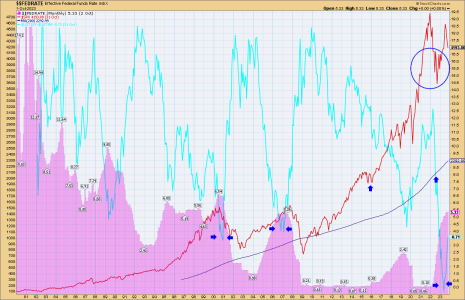
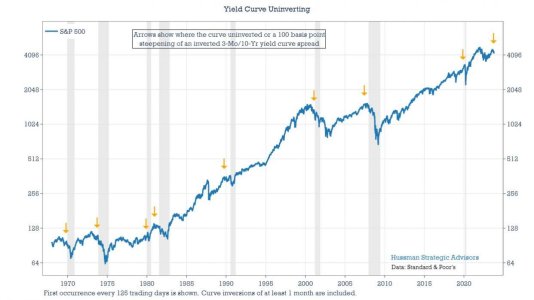
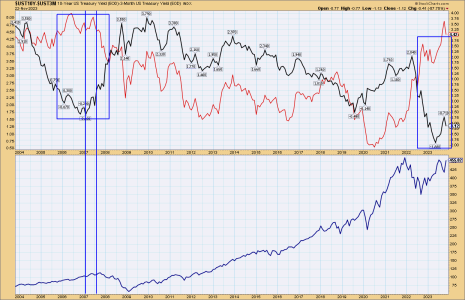
The SPX, Fed rates and the inverted yield curve. It had better be different this time.

2000 market: The inverted yield curve turned up and the SPX went down.

2007 market: The inverted yield curve turned up and the SPX went down.

2023 market: The inverted yield curve turned up and the SPX went??? we shall see how it plays out.

Bottom Line: The SPX remains on a buy signal as we head into the craziest time I have every seen coming from our government. I just trade the signals.

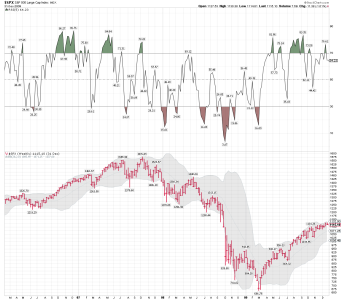
Weekly SPX 2008:

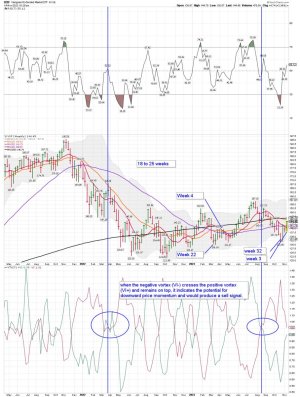
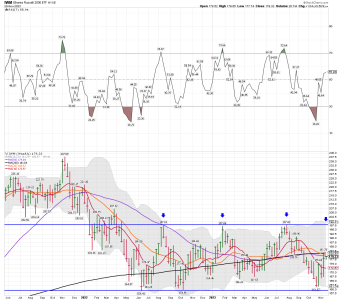
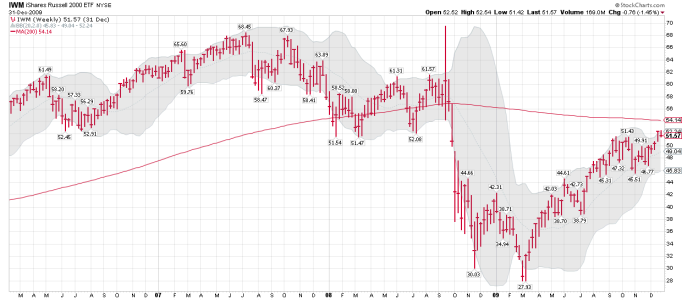
Weekly IWM 2008 and 2023: In 2008 IWM bounced around the 200 week MA...... until it didn't. I'm not calling out anything right here. I use historical data in my LT trading, and I'm just pointing out what the historical data is showing me. Once the inverted yield curve turns back up the market comes under lots of pressure.


Instincts vs. Market Timing Strategy

Humans are born with basic instincts for survival. They need to protect themselves at all costs.


Devoid Of Emotions

Experienced market timers, in contrast, react more decisively.

They carefully follow a trading strategy that is completely devoid of emotions. They follow through on buy and sell signals with absolute precision.

They know that any one or more buy or sell signals may be wrong, but they realize that to trade profitably they must learn to trust their timing strategy and act on it. Only over time are substantial profits realized, and only by those market timers who stay the course.

Think Outside The Box

If you want to be a winning market timer, you must learn to identify your need to follow the masses, and teach yourself to avoid doing what your need for security compels you to do.

You must reprogram yourself to think outside the box. Rather than follow the masses, you must follow your timing strategy, which may be contrary to what most people would do.

Over time, and with extensive experience, you will develop the skills that will allow you to trade decisively.

Once you have reprogrammed your behaviors, you will not be tempted to follow the masses, but will instead recognize these feelings for what they are. Instincts for survival, which may work in the physical world, are likely to cause poor decisions and loss of capital in the financial world.

Rather than Following The Masses, you must learn to follow a timing plan, which is not affected by the emotions of the masses.

The more decisively you can follow the timing strategy, the more profits you'll realize.
https://www.fibtimer.com/subscribers/fibtimer_commentary.asp
 

Attachments

  • a.png
    a.png
    84.8 KB · Views: 82
  • a.png
    a.png
    74.4 KB · Views: 79
  • a.png
    a.png
    34.1 KB · Views: 76
  • a.png
    a.png
    73 KB · Views: 81
Last edited:
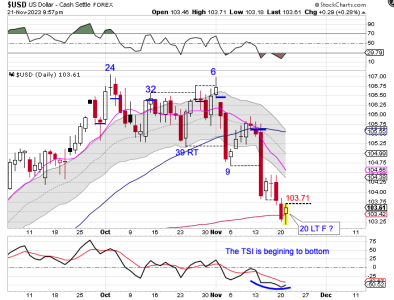
USD/SPX daily:


Keep an eye on the dollar! Some traders will be watching closely. When the dollar moves up or down it can cause some sectors to rally and others to sell off. We shall see if the 200 day MA holds.
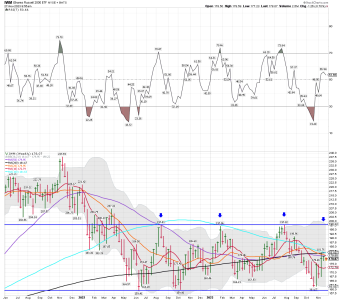

The Dollar & The 200 Day MA
Posted on November 21, 2023

The 200 day MA is a major dynamic support/resistance level for the dollar.


The Dollar formed a bullish reversal of support from the 200 day MA on Tuesday.


Tuesday was day 20, placing the dollar in the early part of its timing band for a DCL. The bullish reversal of support from he 200 day MA signals a new daily cycle. We will use a close above the 10 day MA to label day 20 as the DCL. The Dollar is currently in daily downtrend. The dollar will remain in its daily downtrend unless it closes above the upper daily cycle band.
https://likesmoneycycletrading.blog/2023/11/21/the-dollar-the-200-day-ma/
 

Attachments

  • a.png
    a.png
    38.5 KB · Views: 75
Last edited:
The trader below thinks the $USD 200 day MA will NOT hold and is getting ready to move much lower.... Maybe?

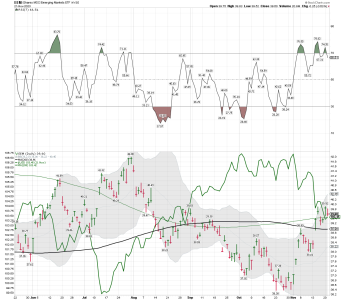
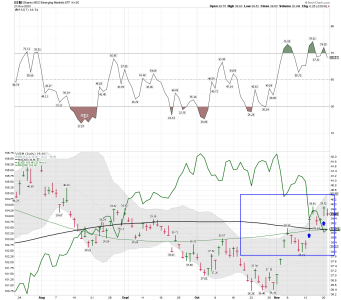
EEM and the $USD: Both are at their 200 day MAs. It's a chart worth watching as any big move for the dollar will cause some sectors huge moves too.... Up and down!

For the record: I DO NOT trade EEM.

Why the Weekend is Crucial to Traders
Imre Gams | Nov 22, 2023 | Market Minute | 3 min read

Most people look forward to the weekend.

It gives them an opportunity to rest and recharge before going back to work.

But for traders, it’s a little different. The weekend is where a trader should be the most productive.

That period between Friday evening and Monday morning is crucial. It’s a time to look at the markets while they’re closed.

When prices aren’t flying around, you can spot opportunities you normally wouldn’t. That’s why I love using the weekend to build my watchlist for the upcoming trading week.

One such opportunity I happened to spot this weekend was the iShares Emerging Markets ETF (EEM).But the dollar is setting up for a steep decline. That could be a big boost that will help EEM sustain a major rally.

This kind of fundamental analysis is great at supporting a longer-term investment thesis. But for a shorter-term trade, the price chart has to look good too.

And that’s what makes the current setup in EEM so enticing. EEM has just recently broken above its 20- and 50-period moving averages (MA). These MAs are ideal for measuring short- and intermediate-term trends.

Breaking above both MAs is a positive sign. It means there’s bullish momentum in the market. And given the larger chart pattern EEM is trading within, it also allows us to calculate a high-probability target.

Take a look…

https://www.jeffclarktrader.com/market-minute/why-the-weekend-is-crucial-to-traders/
 

Attachments

  • a.png
    a.png
    76.9 KB · Views: 82
  • a.png
    a.png
    66.3 KB · Views: 82
Last edited:
IWM daily and the 200 day MA.


Beware the Complacency of Turkeys
Jeff Clark | Nov 23, 2023 |


On Monday, the Volatility Index (VIX) – the best tool for measuring fear in the marketplace – closed at 13.41.

That’s near its lowest level in about three years.

And this is happening despite a lackluster earnings season, rising interest rates, the global economy tumbling headfirst into a recession, and a new War in the Middle East.

And just like the frolicking turkeys in my backyard, investors are relaxed – maybe too relaxed.

Of course, that’s what happens when the stock market bounces hard for a few weeks.

That’s what happens when the financial television talking heads turn universally bullish. And when nearly everyone expects Santa to show up.

The talking heads in the financial media are suggesting there’s nothing to worry about.

They’re relaxed… comfortable… and completely unprepared for any sort of downside action.

But at this point, it may make more sense to cackle, flap our wings wildly, and scatter in all directions.

Otherwise, we might end up as coyote food.

Best regards and good trading,
https://www.jeffclarktrader.com/market-minute/beware-the-complacency-of-turkeys-4/
 

Attachments

  • a.png
    a.png
    72.5 KB · Views: 79
  • a.jpg
    a.jpg
    11.4 KB · Views: 75
Hmmm..... closing his short fund. We shall see how this plays out. The trend remains up.....

Also, the yield curve and un-inversion... What Is the Un-Inversion Signaling?

"It tells you something when a famous short seller is closing his fund."

"Long funds often close near major bottoms for the assets they contain, while short sellers usually bail out near the top:
Short seller Jim Chanos to close hedge funds, return cash to investors:"

Kaplan

https://truecontrarian-sjk.blogspot.com/

Published: Nov. 17, 2023 at 5:49 p.m. ET
By Claudia AssisFollow

Legendary short seller Jim Chanos told the Wall Street Journal Friday that he is closing his hedge funds, saying that “the marketplace for what I do has changed.” Chanos expects to return most of his investors’ cash by Dec. 31, the newspaper reported.
https://www.marketwatch.com/story/s...e-funds-return-cash-to-investors-wsj-c52ac8fa

https://www.hussmanfunds.com/comment/mc230424/


We shall see....

"When the yield curve un-inverts, it is signaling that the recession is closer (within one year based on the past three recessions). While the inversion says trouble is coming in the medium term, the un-inversion says trouble is coming within a year. Again, this idea is consistent with the signaling from the bond markets, as recessions typically last a year or less. The recent un-inversion, therefore, is a signal that a recession may be closer than we think, not a signal we are in the clear."
"If you look at the past 30 years, however, you have to at least consider the possibility that the countdown has started. And that is something we need to be aware of."
 

Attachments

  • a.jpg
    a.jpg
    67.9 KB · Views: 86
  • a.png
    a.png
    54.5 KB · Views: 82
Last edited:
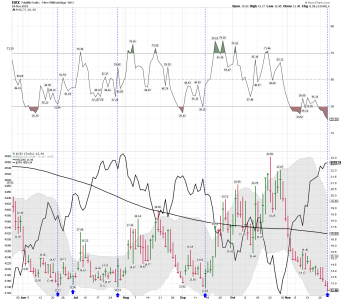
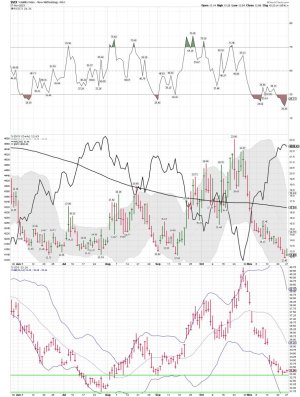
$VIX daily: If you are a short-term trader in some sectors like me.... keep an eye on the $VIX. When the VIX moves into the 12's it's time to reduce or hedge. That's a opinion based on the ST data below.

SPX daily: The move up continues, but with a very low VIX and it's moving deeper into the current daily cycle.

Remains on a buy signal on the daily and weekly charts.

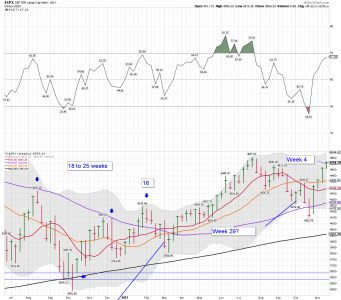
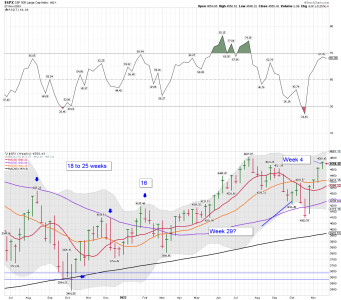
SPX weekly: Week 4 since moving above the 10 week MA.
 

Attachments

  • a.png
    a.png
    80.5 KB · Views: 84
  • a.jpg
    a.jpg
    178.6 KB · Views: 84
  • a.png
    a.png
    75.6 KB · Views: 84
  • a.png
    a.png
    61.5 KB · Views: 82
Inverse panic
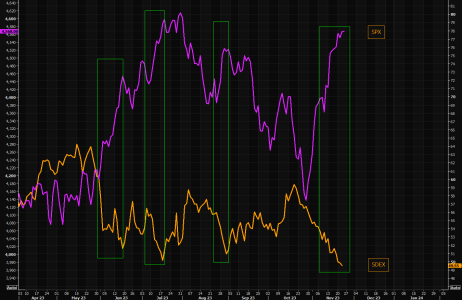
Chasing stocks and puking downside protection (skew down) has been the story over the past month. Low skew isn't necessarily telling you the market must reverse, but note previous occasions over the past months where skew has reset sharply lower has led to the SPX taking a pause/reversing lower.
https://themarketear.com/newsfeed
 

Attachments

  • a.png
    a.png
    51.9 KB · Views: 85
IWM weekly: I'll be watching, but for now IWM is still unable to move back above the 20, 50, 100, and 200 week MAs. Note the compression and resistance taking place. "Maybe" a big move be coming..... For now, the weekly remains above the 10 week MA and that's a buy signal for my system..... However, I sure don't like it!
 

Attachments

  • a.png
    a.png
    73.2 KB · Views: 76
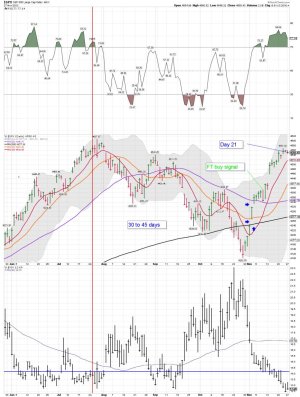
SPX daily: Around day 20 since the DCL, and the SPX is stretched to far above the 20 day MA. The odds now favor a BT of the 20 day MA. We shall see how it plays out. I'm holding an SDS position in my ST trading account.

Bottom Line: The trend remains up!

SPX weekly: What's not to like, but one should expect some downward movement after this 4 week run.

$VIX daily:

"VIX slid to 12.45, its lowest point in 3 years and 10 months and signaling an unusually dangerous degree of complacency toward the possibility of a true U.S. equity bear market. IWM and QQQ have experienced their greatest divergence since 2000."

"VIX has slid from 23.08 on October 23, 2023 to 12.45 on November 24, 2023. Almost all investors are much more worried about missing out on additional upside than they are about the possibility of losing money. Especially since the Russell 2000 and many baskets of small- and mid-cap U.S. stocks are down more than 25% from their peaks from two years ago, investors should be far more concerned about losing money."

Kaplan

True Contrarian


Investors flood $40B into the market over 2 weeks:

Investors flood $40B into the market over 2 weeks: BofA

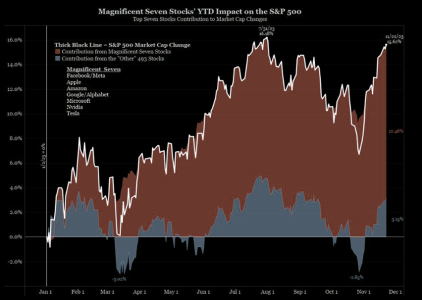
According to a new note from Bank of America Global Research (BAC), a large amount of money has flowed into the stock market recently, the biggest 2-week inflow since February of 2022. With inflation cooling and many believing the Federal Reserve is done with rate hikes, bullish sentiments have picked up. One bright spot leading the charge has been in the tech sector, with some of the Magnificent Seven leading large gains in the S&P 500 (^GSPC).
 

Attachments

  • a.jpg
    a.jpg
    158 KB · Views: 70
  • a.png
    a.png
    61.5 KB · Views: 69
  • a.jpg
    a.jpg
    164.3 KB · Views: 69
  • a.png
    a.png
    231.5 KB · Views: 69
Last edited:
Back
Top